


Abstract
Programmed cell death-1 antibody therapy has demonstrated improved progression-free survival and overall survival in patients with metastatic renal cell carcinoma. However, there are limited studies on biomarkers that can predict the efficacy of immune checkpoint inhibitors. We examined the influence of peripheral inflammatory biomarkers on the clinical outcomes of patients with metastatic renal cell carcinoma treated with nivolumab.
Data of 38 patients with metastatic renal cell carcinoma, who were treated with nivolumab monotherapy after receiving at least one molecular targeted therapy from November 2016 to February 2021, were retrospectively reviewed and analyzed.
Median progression-free survival and overall survival were significantly shorter in patients with low absolute lymphocyte count (<1300/μl) versus those with high absolute lymphocyte count (progression-free survival: P = 0.0102; overall survival: P = 0.0026). Median overall survival was shorter in patients with high neutrophil–lymphocyte ratio (≥3.0) versus those with low neutrophil–lymphocyte ratio (P = 0.0344). Multivariate analysis showed that absolute lymphocyte count was an independent factor for progression-free survival (hazard ratio = 2.332, 95% confidence interval = 1.012–5.375, P = 0.0468) and overall survival (hazard ratio = 4.153, 95% confidence interval = 1.108–15.570, P = 0.0347). Increased absolute lymphocyte count, 1 month after nivolumab initiation, was a positive predictive factor for progression-free survival (hazard ratio = 0.419, 95% confidence interval = 0.189–0.926, P = 0.0317) and overall survival (hazard ratio = 0.285, 95% confidence interval = 0.091–0.890, P = 0.0308).
Our study indicates that peripheral absolute lymphocyte count, before nivolumab initiation, is a predictor of poor response in metastatic renal cell carcinoma. Additionally, increased absolute lymphocyte count, 1 month post-nivolumab initiation, can be a predictor of the effects of nivolumab.
Introduction
With the advent of immune checkpoint inhibitor (ICI) therapy, the treatment strategies in metastatic renal cell carcinoma (RCC) have revolutionized. In particular, ICIs that target programmed cell death-1 (PD-1), programmed cell death-ligand 1 (PD-L1) and cytotoxic T lymphocyte-associated antigen-4 have changed the therapeutic landscape and are now considered the standard treatment modality for patients with advanced and metastatic RCC (1,2). Nivolumab, a human monoclonal PD-1 antibody, is the first approved ICI in Japan for metastatic RCC based on the results of the CheckMate 025 trial (1). Despite meaningful clinical applications, the efficacy of ICIs in RCC varies greatly across individual patients. Therefore, it is crucial to explore reliable predictors to improve the prognosis of patients with RCC who receive ICI therapy. Studies have reported biomarkers, such as PD-L1 and PD-L2 positivity (1–3), tumor mutation burden (4) and immune-related gene profiles (5), for predicting the prognosis of patients treated with ICIs. Recently, circulating inflammatory biomarkers, such as neutrophil–lymphocyte ratio (NLR), monocyte–lymphocyte ratio (MLR) and C-reactive protein (CRP) levels, have shown potential in predicting treatment efficacy in patients undergoing nivolumab therapy for metastatic RCC (6). Moreover, recent studies have shown that absolute lymphocyte count (ALC) is a useful predictive factor in patients with advanced non-small cell lung cancer (NSCLC) who were treated with ICIs. However, only few studies have assessed the association between changes in the peripheral inflammatory biomarkers and survival after nivolumab treatment (7,8). Therefore, it is critical to explore reliable biomarkers that predict the therapeutic effects before or just after nivolumab initiation.
In the present study, we performed a retrospective analysis to examine the influence of peripheral inflammatory biomarkers on the clinical outcomes of patients with metastatic RCC who were treated with nivolumab monotherapy. In addition, we evaluated the changes in the peripheral inflammatory markers as a predictor of the efficacy of nivolumab therapy.
Patient characteristics
| Clinical characteristics | n = 38 |
|---|---|
| Age in years, range | 68 (44–80) |
| Gender, n (%) | |
| Male | 30 (78.9) |
| Female | 8 (21.1) |
| Prior nephrectomy, n (%) | |
| Yes | 35 (92.1) |
| No | 3 (7.9) |
| Performance status, n (%) | |
| 0, 1 | 34 (89.5) |
| ≥2 | 4 (10.5) |
| Histological subtype, n (%) | |
| Clear cell type | 33 (86.8) |
| Papillary type | 1 (2.6) |
| Unclassified | 1 (2.6) |
| Unknown | 3 (7.9) |
| IMDC risk classification, n (%) | |
| Favorable | 5 (13.2) |
| Intermediate | 24 (63.2) |
| Poor | 9 (23.7) |
| Site of metastasis, n (%) | |
| Lung | 29 (76.3) |
| Bone | 12 (31.6) |
| Liver | 6 (15.8) |
| Brain | 3 (7.9) |
| Others | 14 (36.8) |
| Number of prior regimens, n (%) | |
| 1 | 21 (55.3) |
| ≥2 | 17 (44.7) |
Patients and methods
Study design and patients
We retrospectively examined clinical information collected from 38 patients with RCC who were treated with nivolumab after receiving at least one molecular targeted therapy at the Kurume University Hospital, Japan, from November 2016 to February 2021. Patients with systemic inflammatory diseases were not included in our cohort. The patients were stratified according to the International Metastatic Renal Cell Carcinoma Database Consortium (IMDC) risk classification at the initiation of nivolumab therapy. Nivolumab was intravenously administered at 3 mg/kg, 240 mg/body for every 2 weeks, or 480 mg/body for every 4 weeks. Dose reductions were not permitted for any reason; however, the dose interval could be modified according to the condition of the patient. Pretreatment assessments of clinical characteristics were performed, and blood data were collected just before nivolumab initiation. Post-treatment blood data were collected 4 ± 1 weeks following nivolumab initiation. Progression-free survival (PFS) was measured from the time of nivolumab initiation to clinical progression, radiographic progression or death from any cause. Overall survival (OS) was measured from the time of nivolumab initiation to death from any cause.
Statistical analysis
Kaplan–Meier curves were generated for PFS and OS. Comparison of PFS and OS among different groups was achieved via log-rank tests. Cox proportional hazard model was used for univariate and multivariate analyses to calculate the hazard ratio (HR) and 95% confidence interval (CI). For NLR, MLR and platelet–lymphocyte ratio (PLR), the cut-off values were set as 3.0 based on a previous study (6). For the CRP level, the cut-off value was set as 1.0 mg/dl based on previous studies in a metastatic RCC setting (9). For the ALC, the cut-off value was set at 1300 cells/μl based on a previous study (10). Variables with P value < 0.1 in the univariate analysis were selected for multivariate analysis. All statistical analyses were performed using JMP version 14 (SAS Institute, Inc, Cary, NC, USA). All P values were two-sided, and significance was considered at P < 0.05.
Ethical approval
This study was conducted in full accordance with the principles of the World Medical Association, Declaration of Helsinki, and was independently reviewed and approved by the Ethics Review Committee at the Kurume University School of Medicine. Patients were not solicited for informed consent, given the retrospective nature of our study. All patient data were processed in anonymity and de-identified prior to analysis.
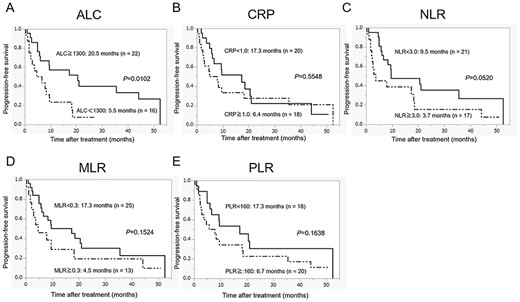
Progression-free survival in patients with metastatic renal cell carcinoma (RCC) who were treated with nivolumab according to the pretreatment peripheral inflammatory biomarkers: (A) absolute lymphocyte count (ALC), (B) C-reactive protein (CRP), (C) neutrophil–lymphocyte ratio (NLR), (D) monocyte–lymphocyte ratio (MLR) and (E) platelet–lymphocyte ratio (PLR).
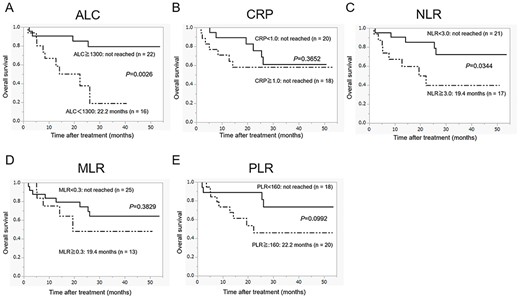
Overall survival in patients with metastatic RCC who were treated with nivolumab according to the pretreatment peripheral inflammatory biomarkers: (A) ALC, (B) C-reactive protein (CRP), (C) neutrophil-lymphocyte ratio (NLR), (D) MLR and (E) PLR.
Univariate and multivariate analyses of progression-free survival (PFS) in patients with metastatic renal cell carcinoma (RCC) who were treated with nivolumab
| Variable | PFS (n = 38) | |||
|---|---|---|---|---|
| Univariate analysis | Multivariate analysis | |||
| HR | P value | HR | P value | |
| Age (years) | ||||
| <68 | 1 | |||
| ≥68 | 0.769 (0.363–1.631) | 0.4935 | ||
| Sex | ||||
| Male | 1 | |||
| Female | 1.370 (0.577–3.252) | 0.4753 | ||
| Performance status | ||||
| 0, 1 | 1 | |||
| ≥2 | 1.047 (0.313–3.498) | 0.9411 | ||
| IMDC risk classification | ||||
| Favorable | 1 | |||
| Intermediate | 0.997 (0.331–3.003) | 0.9956 | ||
| Poor | 0.965 (0.276–3.380) | 0.9560 | ||
| Liver metastasis | ||||
| No | 1 | |||
| Yes | 0.910 (0.343–2.415) | 0.8497 | ||
| Bone metastasis | ||||
| No | 1 | |||
| Yes | 0.999 (0.434–2.298) | 0.9973 | ||
| Number of prior regimens | ||||
| 1 | 1 | |||
| ≥2 | 0.683 (0.322–1.449) | 0.3210 | ||
| Alb (g/dl) | ||||
| ≥3.5 | 1 | |||
| <3.5 | 1.047 (0.491–2.233) | 0.9053 | ||
| CRP (mg/dl) | ||||
| <1.0 | 1 | |||
| ≥1.0 | 1.251 (0.592–2.640) | 0.5574 | ||
| NLR | ||||
| <3.0 | 1 | 1 | ||
| ≥3.0 | 2.064 (0.975–4.366) | 0.0581 | 1.623 (0.737–3.575) | 0.2292 |
| ALC | ||||
| ≥1300/μl | 1 | 1 | ||
| <1300/μl | 2.708 (1.226–5.980) | 0.0137 | 2.332 (1.012–5.375) | 0.0468 |
| MLR | ||||
| <0.3 | 1 | |||
| ≥0.3 | 1.731 (0.806–3.715) | 0.1593 | ||
| PLR | ||||
| <160 | 1 | |||
| ≥160 | 1.705 (0.795–3.658) | 0.1706 | ||
HR, hazard ratio; Alb, albumin; CRP, C-reactive protein; NLR, neutrophil–lymphocyte ratio; ALC, absolute lymphocyte count; MLR, monocyte–lymphocyte ratio; PLR, platelet–lymphocyte ratio.
Univariate and multivariate analyses of overall survival (OS) in patients with metastatic RCC treated with nivolumab
| Variable | OS (n = 38) | |||
|---|---|---|---|---|
| Univariate analysis | Multivariate analysis | |||
| HR | P value | HR | P value | |
| Age (years) | ||||
| <68 | 1 | |||
| ≥68 | 1.443 (0.484–4.310) | 0.5107 | ||
| Sex | ||||
| Male | 1 | |||
| Female | 2.319 (0.755–7.083) | 0.1424 | ||
| Performance status | ||||
| 0, 1 | 1 | |||
| ≥2 | 2.316 (0.510–10.517) | 0.2768 | ||
| IMDC risk classification | ||||
| Favorable | 1 | |||
| Intermediate | 2.341 (0.296–18.499) | 0.4198 | ||
| Poor | 1.904 (0.198–18.323) | 0.5773 | ||
| Liver metastasis | ||||
| No | 1 | |||
| Yes | 1.330 (0.365–4.853) | 0.6654 | ||
| Bone metastasis | ||||
| No | 1 | |||
| Yes | 1.253 (0.385–4.081) | 0.7078 | ||
| Number of prior regimens | ||||
| 1 | 1 | |||
| ≥2 | 1.255 (0.421–3.740) | 0.6831 | ||
| Alb (g/dl) | ||||
| ≥3.5 | 1 | 1 | ||
| <3.5 | 3.007 (0.925–9.780) | 0.0673 | 2.083 (0.582–7.457) | 0.2595 |
| CRP (mg/dl) | ||||
| <1.0 | 1 | |||
| ≧1.0 | 1.648 (0.553–4.916) | 0.3701 | ||
| NLR | ||||
| <3.0 | 1 | 1 | ||
| ≥3.0 | 3.183 (1.029–9.850) | 0.0446 | 1.496 (0.410–5.461) | 0.5423 |
| ALC | ||||
| ≥1300/μl | 1 | 1 | ||
| <1300/μl | 5.461 (1.616–18.452) | 0.0063 | 4.153 (1.108–15.570) | 0.0347 |
| MLR | ||||
| <0.3 | 1 | |||
| ≧0.3 | 1.650 (0.530–5.139) | 0.3875 | ||
| PLR | ||||
| <160 | 1 | |||
| ≥160 | 2.626 (0.799–8.629) | 0.1118 | ||
Results
Patient characteristics
Clinicopathological characteristics of all 38 study participants are summarized in Table 1. The median age of the patients was 68 years (range = 44–78), and most patients were male (77.8%). Based on the classification by the IMDC, 5 (13.2%), 24 (63.2%) and 9 (23.7%) patients were segregated into favorable, intermediate and poor risk categories, respectively, at nivolumab initiation. Nivolumab was administered as a second-line therapy in 21 patients and as third-line or greater therapy in 17 patients. The median PFS and OS of all patients were 9.3 months (95% CI = 4.9–18.4) and ‘not reached’ (95% CI = 22.2–not reached), respectively. The objective response rate was 25%.
Clinical course according to the pretreatment peripheral inflammatory biomarkers
Figures 1 and 2 show the estimated curves of PFS and OS, respectively, according to the pretreatment peripheral inflammatory biomarkers. Low ALC was a predictor of significantly worse PFS and OS than high ALC. Although the PFS for patients with high NLR was shorter than those with low NLR, no significant difference was observed between the two groups (P = 0.0520). However, in case of OS, there was a significant difference between the two groups (P = 0.0344). CRP level, MLR and PLR were neither associated with the median PFS (CRP level, P = 0.5548; MLR, P = 0.1524; PLR, P = 0.1638) nor with the median OS (CRP level, P = 0.3652; MLR, P = 0.3829; PLR, P = 0.0992).
Univariate and multivariate analyses of the pretreatment prognostic factors
To identify the pretreatment prognostic factors associated with PFS and OS, univariate and multivariate analyses were performed using the Cox proportional hazards model (Tables 2 and 3). Univariate analysis showed that pretreatment ALC (HR = 2.708, 95% CI = 1.226–5.980, P = 0.0137) was a significant factor that affected PFS. Although high pretreatment NLR, and not low pretreatment NLR, was associated with shorter PFS, there was no significant difference (HR = 2.064, 95% CI = 0.975–4.366, P = 0.0581). Univariate analysis also showed that pretreatment NLR (HR = 3.183, 95% CI = 1.029–9.850, P = 0.0446) and ALC (HR = 5.461, 95% CI = 1.616–18.452, P = 0.0063) were significant factors that affected OS. Multivariate analyses suggested that pretreatment ALC demonstrated an independent prognostic effect on both PFS (HR = 2.332, 95% CI = 1.012–5.375, P = 0.0468) and OS (HR = 4.153, 95% CI = 1.108–15.570, P = 0.0347). We compared the clinicopathological characteristics between the high ALC and low ALC groups before the initiation of nivolumab. More females were included in the low ALC group. However, no significant correlation was found for other factors between the high ALC and low ALC groups (Supplementary Table S1).
Prognostic predictors 1 month after nivolumab initiation
To identify the changes in the peripheral inflammatory markers associated with PFS and OS, univariate and multivariate analyses were performed using the Cox proportional hazards model (Table 4). Univariate analysis showed that the patients with increased ALC 1 month after the start of nivolumab had better PFS (HR = 0.408, 95% CI = 0.185–0.900, P = 0.0263) and OS (HR = 0.252, 95% CI = 0.082–0.781, P = 0.0169) compared with the patients who showed decreased ALC. Multivariate analysis indicated that increased ALC 1 month after nivolumab initiation was an independent prognostic factor for both PFS (HR = 0.419, 95% CI = 0.189–0.926, P = 0.0317) and OS (HR = 0.285, 95% CI = 0.091–0.890, P = 0.0308).
Univariate and multivariate analyses to identify predictors 1 month after nivolumab initiation for PFS and OS
| Variable | PFS (n = 38) | |||
|---|---|---|---|---|
| Univariate analysis | Multivariate analysis | |||
| HR | P value | HR | P value | |
| Post-CRP/pre-CRP | ||||
| <1.0 | 1 | 1 | ||
| ≥1.0 | 1.283 (0.611–2.693) | 0.5106 | 1.216 (0.568–2.599) | 0.6417 |
| Post-NLR/pre-NLR | ||||
| <1.0 | 1 | 1 | ||
| ≥1.0 | 1.285 (0.561–2.944) | 0.5531 | 1.102 (0.470–2.586) | 0.8230 |
| Post-ALC/pre-ALC | ||||
| <1.0 | 1 | 1 | ||
| ≥1.0 | 0.408 (0.185–0.900) | 0.0263 | 0.419 (0.189–0.926) | 0.0317 |
| Post-MLR/pre-MLR | ||||
| <1.0 | 1 | |||
| ≥1.0 | 1.043 (0.484–2.250) | 0.9143 | ||
| Post-PLR/pre-PLR | ||||
| <1.0 | 1 | |||
| ≥1.0 | 1.035 (0.488–2.198) | 0.9279 | ||
| Variable | OS (n = 38) | |||
| Univariate analysis | Multivariate analysis | |||
| HR | P value | HR | P value | |
| Post-CRP/pre-CRP | ||||
| <1.0 | 1 | 1 | ||
| ≥1.0 | 2.044 (0.668–6.255) | 0.2105 | 1.982 (0.642–6.121) | 0.2346 |
| Post-NLR/pre-NLR | ||||
| <1.0 | 1 | 1 | ||
| ≥1.0 | 5.014 (0.650–38.657) | 0.1218 | 3.487 (0.442–27.530) | 0.2361 |
| Post-ALC/pre-ALC | ||||
| <1.0 | 1 | 1 | ||
| ≥1.0 | 0.252 (0.082–0.781) | 0.0169 | 0.285 (0.091–0.890) | 0.0308 |
| Post-MLR/pre-MLR | ||||
| <1.0 | 1 | |||
| ≥1.0 | 1.985 (0.545–7.222) | 0.2982 | ||
| Post-PLR/pre-PLR | ||||
| <1.0 | 1 | |||
| ≥1.0 | 1.619 (0.498–5.261) | 0.4232 | ||
Post, post-1 month from nivolumab initiation; pre, pretreatment.
Discussion
Recently, several studies have demonstrated that systemic inflammatory factors, including NLR, MLR and CRP level, have potential in predicting the survival outcomes in patients receiving ICI therapy for metastatic RCC (6,11,12). Hematologic parameters, such as NLR, MLR and PLR, reflect the balance between inflammation and immunoreaction. Pretreatment NLR has been indicated as a prognostic factor that reflects the survival outcome, regardless of the treatment, across multiple cancer types. Along with patient survival, NLR can predict responses to a certain therapy; however; this factor has not been well defined for use in immunotherapy. By contrast, Nishiyama et al. showed that pretreatment NLR is not a significant predictor of response to nivolumab therapy (13). Furthermore, Ishihara et al. have reported that pretreatment CRP level is a predictive factor for OS but not for PFS in case of nivolumab therapy for metastatic RCC (6). Although ICIs have changed the treatment strategies employed for metastatic RCC, there are still unmet needs that need to be addressed; for instance, biomarkers that can predict the effectiveness of ICIs, including nivolumab.
PD-1 is an inhibitory receptor and immune checkpoint protein. Since PD-1 antibody mechanism depends on the activity of functional T lymphocytes, it is assumed that the efficacy of the PD-1 antibody would be compromised in patients with lymphopenia (14). Ho et al. demonstrated that pretreatment ALC in patients with advanced head and neck squamous cell carcinoma can predict the therapeutic response to PD-1 antibody (15). Huemer et al. have also shown that baseline ALC is associated with survival in patients with NSCLC who were treated with PD-1/PD-L1 antibody (16).
In this retrospective study, we compared changes in the peripheral inflammatory markers, pretreatment and during treatment, in patients who received nivolumab after the failure of at least one line of targeted therapy for metastatic RCC. The PFS and OS after initiation of nivolumab therapy were significantly shorter in patients with low pretreatment ALC than in those with high pretreatment ALC. Although various cut-off values have been reported in previous studies (15,17,18), we used the cut-off value of 1300 cells/μl based on a previous RCC study (10). We also considered the median cut-off value and obtained similar results (Supplementary Fig. S1).
Even though the PD-1/PD-L1 antibody mechanism is involved in the activation of tumor-infiltrating lymphocytes (TILs) that enhance antitumor immunity, the role of peripheral lymphocytes is not well understood. The administration of ICIs causes an increase in the number of CD8 T cells in the tumor microenvironment, alters cytokine transcription in the tumor and chemokine secretion and promotes systemic immune changes (19,20). Therefore, we examined the effects of increased ALC on nivolumab treatment. Our findings showed that increased ALC, 1 month after nivolumab initiation, was a positive predictive factor for both PFS and OS. To our knowledge, this is the first study to show that increased ALC after 1 month can be a predictive marker for the efficacy of nivolumab in patients with metastatic RCC. By contrast, changes in other factors, such as NLR, MLR, PLR and CRP levels, had no effects on the PFS and OS. Although there are some studies on prognostic factors that combine multiple factors, such parameters cannot distinguish between patients with increased and decreased lymphocyte counts. Previous reports have suggested that ALC is more useful than NLR at least in identifying patients with activated antitumor immune status (21).
In recent years, researchers have reported that early lymphocyte elevation after PD-1 antibody treatment can be a surrogate marker for predicting therapeutic effects (22,23). Kato et al. demonstrated that anti PD-1 therapy induces the expansion of T cell clones at an early phase post-treatment in responders (24). They suggested that expanded T cell receptor (TCR) clone types, 1 month after treatment with anti PD-1 inhibitor, in the peripheral blood, are significantly shared with tumor-infiltrating T cells in responders. In this study, the relationship between ALC and TCR was not examined. Therefore, further studies are required to verify the usefulness of ALC as a predictive biomarker.
The limitations of our study must be acknowledged. First, this was a retrospective study from a single institution and thus may be prone to selection bias. In addition, the patient sample size was extremely small, and the treatment lines of the patients were heterogeneous. The presence of concurrent inflammatory states or the use of immunomodulators, which could have affected the inflammatory markers, was not validated. Moreover, previously reported biomarkers, such as PD-L1 expression, tumor mutational burden and TIL levels, were not examined in this study. Therefore, to comprehensively elucidate whether the pretreatment ALC and during treatment changes in ALC can predict the PFS and OS in metastatic RCC, further validation in larger and more diverse populations is required.
In conclusion, our study indicated that peripheral ALC, before the initiation of nivolumab, was a predictor of poor response in metastatic RCC. In addition, increased ALC, 1 month after nivolumab initiation, could be a predictor of the effects of nivolumab. We believe that this study provides useful information for patients with metastatic RCC receiving nivolumab therapy.
Funding
This work was supported by JPSS KAKENHI (grant numbers 18007279, 20K18128).
Conflict of interest
None declared.
