


Abstract
Existing cross-sectional observational studies indicate that patients with multiple myeloma experience negative physical and psychological symptoms and low health-related quality of life. The study aim was to determine symptom prevalence, health-related quality of life and symptoms associated with health-related quality of life in patients with newly diagnosed multiple myeloma.
This multicenter longitudinal cohort study was conducted in four hospitals in Japan. Patients with newly diagnosed multiple myeloma were asked to report their symptom intensity and health-related quality of life using validated questionnaires at three points: at diagnosis (T1), 1 month (T2) and 12 months after diagnosis (T3). Symptoms associated with health-related quality of life were explored using a mixed-effects model.
A total of 106 patients completed the assessment at T1. The symptoms more than 30% of patients reported were pain, disturbed sleep and distress at T1, pain, dry mouth, disturbed sleep and fatigue at T2, fatigue, numbness of tingling and pain and numbness or tingling at T3. Pain and depression were significantly associated with health-related quality of life negatively.
The finding suggests that more than 30% of multiple myeloma patients suffered from pain and various symptoms and they received suboptimal palliative care within a year after starting initial chemotherapy. Pain and depression should be the main targets of interventions to improve health-related quality of life in this population.
Introduction
Multiple myeloma (MM) is a common hematological malignancy; the 2018 incidence of MM in Japan was 6.1 per 100 000 individuals per year. There were 7800 new cases of MM in 2018 and the incidence of MM is expected to increase as society ages (1). The treatment of MM has improved in recent decades, and the 5-year survival rate has increased to 53% (2). However, MM remains an incurable disease.
Patients with MM frequently experience symptom burden from pain, fatigue, constipation, numbness, depression, and other symptoms shortly after diagnosis (3,4) and throughout the disease trajectory (5). In addition, some studies have shown that pain (5–7), depression (5–7), anxiety (5,7) and fatigue (5,6) reduce HRQOL in MM patients. However, these studies used cross-sectional designs (5,6) or included patients with different timing of illness trajectories (7,8). To our knowledge, there are few longitudinal investigations of symptom prevalence and HRQOL.
MM patients experience more symptom burden and lower HRQOL than patients with other hematologic malignancies (8,9) but receive less optimal palliative care services (10). To establish and implement early palliative care for MM patients, it is necessary to understand prevalence of symptoms and their effect on HRQOL during initial chemotherapy.
The aim of this prospective longitudinal study was to clarify symptom prevalence of symptoms and symptoms negatively associated with HRQOL in MM patients during the early treatment period.
Patients and methods
Study design and logistics
This was a multicenter longitudinal prospective study conducted in one tertiary care university hospital and three community hospitals in Japan. When eligible patients were admitted to the hospital, the attending physician explained the nature of the study to them before they started chemotherapy. After obtaining informed consent, patients were asked to complete the questionnaires described below at three time points: at diagnosis (T1), 1 month after diagnosis (T2) and 12 months after diagnosis (T3).
The study contained two cohorts that experienced the same study design (described below) but differed in terms of subjects and study period. Cohort 1 comprised patients with lymphoma and MM; Cohort 2 contained only patients with MM. Cohort 1 participated in the study at Nagoya City University Hospital from September 2010 to March 2016. Several papers have been published using Cohort 1 data (11–16). Cohort 2 participated in the study from April 2019 to May 2021 at Nagoya City University Hospital and another three hospitals, to increase the number of participants with MM. The data for 73 patients diagnosed with MM extracted from Cohort 1 and 33 patients from Cohort 2 were combined and analyzed in this study.
This study was conducted with the approval of the institutional review board and ethics committee of each participating site and was conducted in accordance with the principles laid down in the Helsinki Declaration. Written consent was obtained from each eligible patient after a thorough explanation of the purpose and method of the study. Participants received a gift card of 1000 yen (~10 USD) as a reward.
Participants and setting
The eligibility criteria for study inclusion were (i) patients newly diagnosed with MM, (ii) adult patients (≥20 years old), (iii) ability to read and write Japanese and (iv) patients admitted to Nagoya City University Hospital, Kainan Hospital, Nagoya Memorial Hospital, or Nagoya City West Medical Center (the latter three hospitals only participated in Cohort 2) to undergo chemotherapy (in Japan, most MM patients undergo their first chemotherapy in inpatient settings, to monitor side effects and increase safety). The exclusion criteria were (i) having any type of severe mental or cognitive disorder, (ii) too ill to complete the survey questionnaire and (iii) patients whose attending physician considered participation was inappropriate for any reason.
Symptom assessment
The MD Anderson Symptom Inventory (MDASI) is a self-administered questionnaire that assesses patient-perceived symptom severity and symptom interference in daily life (17). In this study, only the symptom severity part of the MDASI was used. The patients rate their experience of 13 symptoms in the previous 24 hours from 0 (not present) to 10 (as bad as you can imagine). We categorized scores of 0–3 as indicating no or mild symptoms and scores of 4–10 as indicating moderate or severe symptoms, according to previous studies on fatigue (18,19). The validity and reliability of the Japanese version of the MDASI have been established (20).
The Patient Health Questionnaire-9 (PHQ-9) consists of nine items that assess the symptoms of major depressive disorder according to the criteria of the Diagnostic and Statistical Manual of Mental Disorders, Fourth Edition (DSM-IV) (21). Response options for each PHQ-9 item are 0 (not at all), 1 (several days), 2 (more than half the days) or 3 (nearly every day). Items are rated according to the frequency of depression symptoms over the previous 2 weeks. The total possible score ranges from 0 to 27. The presence of depression was assumed if scores on at least two symptoms were ≥2, with at least one of the symptoms being depressed mood or anhedonia. The validity and reliability of the Japanese version of the scale have been established (22).
Quality of life assessment
The EuroQoL-5 (EQ-5D) was administered to evaluate patients’ HRQOL (23). The EQ-5D includes a single visual analog scale (VAS) on which the respondent evaluates their overall health status from 0 to 100 (0 = worst imaginable; 100 = best imaginable). The EQ-5D scale also contains five health dimensions: mobility, self-care, usual activities, pain/discomfort and anxiety/depression; each dimension has three response categories (severe, moderate and none). Each profile can be transformed into a corresponding single EQ-5D score (the ‘utility score’) using a conversion table. Each country has a unique conversion table, because ratings of health status vary across countries.
The validity and reliability of the Japanese version of this scale have been established (24).
Demographic and medical information
Information on patient sociodemographic status (e.g. marital status, level of education and employment status) was obtained from an ad hoc questionnaire. Performance status as defined by the Eastern Cooperative Oncology Group was evaluated by the attending physicians. All other medical information (e.g. clinical stage and anticancer treatment) was confirmed from patients’ medical records.
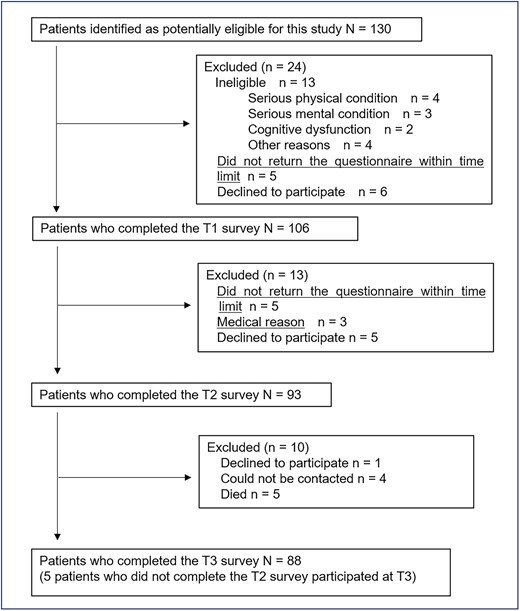
Flowchart showing the number of patients at each time point.
Statistical analysis
Unpaired t-test, Mann–Whitney tests and chi-square tests were used accordingly to compare the demographic and clinical characteristics of patients between Cohort 1 and 2.
The EQ-5D utility index was calculated using Japanese tariffs. We analyzed utility scores using a t-test to compare MM patients with age- and sex-matched population norms obtained from a survey of the Japanese population (25).
A mixed-effects model was used to analyze the longitudinal association between EQ-5D VAS score and severity of symptoms, including depression. The factors lack of appetite; nausea and vomiting were integrated into a gastrointestinal symptom category; and shortness of breath and difficulty remembering were also integrated based on the cluster analysis results for MDASI scores from a previous study (17). Moreover, factors in the mood and mood-related symptom cluster (distress, sadness, drowsiness and disturbed sleep) overlapped with PHQ-9 symptoms, so these were not included in the mixed-effects model. Finally, we used a linear mixed-effects model with pain, fatigue, dry mouth, numbness, shortness of breath and difficulty remembering, gastrointestinal symptoms and PHQ-9 scores as fixed effects; subject as a random effect; and age, sex, marital status, educational level, job, type of myeloma, international staging system (ISS) score at baseline and time as covariates. Standardized partial regression coefficients were also estimated to compare the effect of adjusting for variation in fixed effects on the EQ-5D VAS score.
All P values were two-sided, with those <0.05 considered to indicate statistical significance. All analyses were performed using R version 4.0.4 for Windows (R Development Core Team, 2020). For linear mixed-effects modeling, the ‘Ime4’ and ‘ImerTest’ packages were used.
Demographic and clinical characteristics of patients (N = 106)
| Characteristics | N | (%) | |
|---|---|---|---|
| Age (year), mean ± SD | 67.7 ± 10.7 (range: 36–87; median: 69) | ||
| Sex | Male | 54 | 50.1 |
| Education | ≥High school | 79 | 74.5 |
| Marital status | Married | 74 | 69.8 |
| Job | Employed (full-time/part-time) | 39 | 36.8 |
| Type of myeloma | IgG | 59 | 55.6 |
| IgA | 23 | 21.7 | |
| Light chain disease | 23 | 21.7 | |
| Others | 1 | 0.9 | |
| International Staging System score | I | 17 | 16.0 |
| II | 50 | 47.2 | |
| III | 39 | 36.8 | |
| Performance status | 0 | 31 | 29.2 |
| (ECOG) | 1 | 43 | 40.6 |
| 2 | 11 | 10.4 | |
| 3 | 14 | 13.2 | |
| 4 | 6 | 5.7 | |
| Missing | 1 | 0.9 | |
| Intensity of received treatments at T3a b | Chemotherapy only | 48 | 58.5 |
| Bortezomib-based | 26 | 31.7 | |
| Lenalidomide-based | 14 | 17.1 | |
| +Daratumumab | 5 | 6.1 | |
| Other | 8 | 9.8 | |
| HDC/ASCT | 34 | 41.5 | |
| Chemotherapy at T3b | Chemotherapy free (remission) | 49 | 59.8 |
| Relapsed or undergoing chemotherapy | 33 | 40.2 | |
| Number of prior MM therapies within 1 year | 1 | 63 | 76.8 |
| 2 | 17 | 20.7 | |
| 3 | 2 | 2.4 | |
Abbreviations: ECOG, Eastern Cooperative Oncology Group; SD, standard deviation; HDC/ASCT, high-dose melphalan/autologous stem cell transplantation; Ig, immunoglobin.
a88 patients completed the T3 survey.
bTreatment status data for 6 patients at T3 were missing.
Results
Patient characteristics and medical characteristics
A patient flow diagram is shown in Fig. 1. A total of 130 potentially eligible participants were identified, and 106 patients completed questionnaires at baseline (73 patients were recruited in 2010–2016 and 33 patients were recruited in 2019–2020). There were no differences in demographic and clinical characteristics between the two cohorts, except patients in cohort 1 were significantly older than those in cohort 2. Of the 106 patients, 88 (83.0%), 8 (7.5%), 7 (6.6%) and 3 (2.8%) were recruited at Nagoya City University Hospital, Kainan Hospital, Nagoya City West Medical Center and Nagoya Memorial Hospital, respectively. Thirteen patients were considered ineligible; 5 patients were excluded for logistic reasons and 6 declined to provide consent for participation in the study.
The sociodemographic and clinical characteristics of the 106 patients are shown in Table 1. Patients who did not participate in this study were significantly older and had worse performance status and ISS scores than those who participated (data not shown).
A total of 93 participants completed at T2 and 88 at T3. The follow-up rate was 88.7 and 83.0%. Of the 88 patients participating at T3, 38.6% received autologous stem cell transplantation; 76.8, 20.7 and 2.4% had one, two and three prior treatment(s) within 1 year, respectively.
Symptoms
Table 2 shows the proportion of patients with scores of ≥4 (moderate to severe) on each MDASI symptom at each assessment point. Symptoms reported by more than 30% of patients were pain, disturbed sleep, distress, dry mouth, sadness and depression at T1; pain, dry mouth, disturbed sleep, fatigue, distress and drowsiness at T2; and fatigue, numbness or tingling and pain at T3.
Prevalence of symptoms
| T1 | %(95%CI) (N = 106) | T2 | %(95%CI) (N = 93) | T3 | %(95%CI) (N = 88) |
|---|---|---|---|---|---|
| Pain | 46 (37–56) | Pain | 36 (27–46) | Fatigue | 33 (24–43) |
| Disturbed sleep | 41 (32–50) | Dry mouth | 36 (27–46) | Numbness or tingling | 32 (23–42) |
| Distress | 38 (29–47) | Disturbed sleep | 33 (24–43) | Pain | 31 (22–41) |
| Dry mouth | 35 (27–44) | Fatigue | 33 (24–43) | Distress | 24 (16–34) |
| Sadness | 32 (24–42) | Distress | 32 (23–42) | Drowsiness | 24 (16–34) |
| Depression | 30 (22–40) | Drowsiness | 31 (22–41) | Dry mouth | 23 (15–33) |
| Lack of appetite | 28 (21–38) | Sadness | 26 (18–35) | Disturbed sleep | 18 (11–28) |
| Drowsiness | 26 (19–36) | Depression | 21 (14–31) | Lack of appetite | 18 (11–28) |
| Fatigue | 25 (18–35) | Lack of appetite | 20 (13–30) | Sadness | 17 (11–26) |
| Shortness of breath | 22 (15–31) | Shortness of breath | 16 (10–25) | Shortness of breath | 16 (10–25) |
| Numbness or tingling | 19 (13–27) | Numbness or tingling | 15 (9–24) | Difficulty remembering | 14 (8–23) |
| Difficulty remembering | 12 (7–20) | Nausea | 11 (6–19) | Depression | 10 (5–19) |
| Nausea | 7 (3–13) | Difficulty remembering | 9 (4–16) | Nausea | 6 (2–13) |
| Vomiting | 3 (1–8) | Vomiting | 5 (2–12) | Vomiting | 3 (1–10) |
Abbreviations: MDASI, MD Anderson Symptom Inventory; PHQ-9, Patient Health Questionnaire-9.
Depression was assessed using the Patient Health Questionnaire-9. Other symptoms were assessed using the MDASI.
Data show the proportion of patients reporting scores of ≥4 on each MDASI symptom. Definition of depression was described in the text.
HRQOL
The mean EQ-5D VAS score was 59.0 (SD = 23.5), 64.9 (SD = 10.7) and 72.2 (SD = 18.5) at T1, T2 and T3, respectively. The mean EQ-5D utility index score was 0.64 [standard deviation (SD) = 0.27], 0.66 (SD = 0.24) and 0.78 (SD = 0.17) at T1, T2 and T3, respectively. The utility index score at T3 was significantly lower than the age- and sex-matched population norms (mean = 0.87, SD = 0.16).
Effect of symptoms on HRQOL
The mixed-effects model showed that pain and depression were associated with EQ-5D VAS score negatively, and gastrointestinal symptoms were associated positively, after adjustment for time, age, sex, marital status, education level, job, type of myeloma, ISS scores and four other symptom scores (Table 3). Because it was difficult to interpret the results of the positive association between gastrointestinal symptoms and HRQOL, we additionally explored the association between HRQOL and pain, depression or gastrointestinal symptoms, separately using a mixed-effects with each symptom as fixed effects and same covariates in main analysis. This post hoc analysis revealed a significantly negative association between all of these three symptoms and HRQOL (Supplementary Table 1).
Factors associated with quality of life (VAS scores): results of mixed-effects model
| Coefficient | 95% CI | Standardized coefficient | 95% CI | P value | |
|---|---|---|---|---|---|
| Depression | −1.46 | −2.01, −0.90 | −0.33 | −0.45, −0.20 | <0.001 |
| Pain | −1.80 | −2.68, −0.91 | −0.26 | −0.38, −0.13 | <0.001 |
| Dry mouth | −0.89 | −1.80, 0.03 | −0.11 | −0.23, 0.00 | 0.059 |
| Shortness of breath and difficulty remembering | −0.31 | −1.08, 0.45 | −0.05 | −0.18, 0.07 | 0.418 |
| Fatigue | −0.15 | −1.25, 0.94 | −0.02 | −0.16, 0.12 | 0.782 |
| Numbness or tingling | 0.09 | −0.85, 1.02 | 0.01 | −0.11, 0.13 | 0.855 |
| Gastrointestinal symptoms | 0.66 | 0.06, 1.25 | 0.14 | 0.01, 0.26 | 0.030 |
Abbreviations: CI, confidence interval; VAS, visual analog scale.
Depression was assessed using the Patient Health Questionnaire-9. Other symptoms were assessed using the MD Anderson Symptom Inventory.
Results were adjusted for time, age, sex, marital status, educational level, job, type of myeloma and International Staging System score.
Discussion
To our knowledge, this is the first study to use a longitudinal observational design to explore symptom prevalence, HRQOL and factors associated with HRQOL in patients with newly diagnosed MM. Our results showed that patients frequently experience a range of symptoms. Pain, depression was negatively associated with HRQOL.
Patients experienced a wide range of symptoms at each assessment point. Medical staff should recognize these symptom patterns to provide optimal palliative care for patients with MM. The prevalence of psychological symptoms, such as depression, distress and sadness at diagnosis, could be attributed to the psychological effects of a cancer diagnosis. A previous study reported that early palliative care for patients with MM a median of 355 days after diagnosis is both feasible and beneficial (10). We considered that early palliative care, including psychological support, should be initiated at the start of anticancer treatment for patients having psychological symptoms.
Our results also indicated that patients experienced various symptoms 1 year after starting chemotherapy. Medical staff should pay particular attention to symptoms of numbness or tingling, because although these symptoms were not initially severe, they gradually increased and were prominent 1 year after diagnosis. This symptom is attributed to chemotherapy-induced peripheral neuropathy (CIPN) (26). For example, bortezomib is used to treat MM, and these agents often lead to painful CIPN. There is a lack of established management strategies for CIPN, so early recognition is importance to prevent irreversible neurological damage (27).
HRQOL was significantly lower than the age- and sex-matched population norms. This result is consistent with a previous study which reported that patient with MM reported significantly worse scores on QOL scores compared with normative population (28).
Pain and depression were negatively associated with HRQOL assessed using the VAS. As already mentioned, several cross-sectional studies have investigated the association between quality of life and symptoms (5,6); one longitudinal observational study included patients with different illness trajectories (7). The novel findings of the present study include clarification of the relative effect of each symptom on HRQOL, determined using longitudinal data after adjusting for covariates.
Although we found positive correlation between gastrointestinal symptoms and HRQOL in main analysis, this might be false positive because additional analysis indicated the negative association. One possible reason of this finding may be that there were positive correlations between gastrointestinal symptoms and other symptoms which entered in the linear mixed-effects model.
Several study design issues may limit our confidence in these findings. First, patients who did not participate in this study were significantly older and had worse performance status and clinical staging scores than participants. This suggests that we may have underestimated the severity or prevalence of symptoms or overestimated quality of life levels. Participant attrition in both cohorts may also have caused underestimation, although we considered the attrition rate to be minimal. Second, the time gap between assessments of the two cohorts may have meant that there were differences in chemotherapy regimens because of developments in anticancer treatment. Third, assessments were only made at three time points.
Despite these limitations, this study had several strengths. This was a multicenter study of patients from both university and municipal hospitals, so selection bias was minimal. Patients were consecutively recruited, and the rejection rate was low. Patient-reported outcomes were assessed with widely used international measures validated for Japanese samples.
This longitudinal observational study of patients newly diagnosed with MM showed that patients experienced a wide range of symptoms within a year after starting initial chemotherapy and identified factors associated with HRQOL. The findings suggest that appropriate early management strategies for these symptoms could improve HRQOL. In future studies, we plan to develop randomized controlled trials of interventions for MM patients from the time of diagnosis.
Acknowledgements
We gratefully acknowledge Toshi A. Furukawa, MD, PhD, Department of Health Promotion and Human Behavior, Kyoto University Graduate School of Medicine/School of Public Health, Kyoto, Japan, and Satoshi Osaga, MSc, Clinical Research Management Center, Nagoya City University Hospital, Nagoya, Japan, and Takeshi Nishiyama, MD, PhD, Department of Public Health, Nagoya City University Graduate School of Medical Sciences, Nagoya, Japan, for their help in conducting statistical analysis and in the preparation of the manuscript. We thank Diane Williams, PhD, from Edanz (https://jp.edanz.com/ac) for editing a draft of this manuscript.
Funding
This work was supported in part by Grants-in-Aid for Cancer Research from the Ministry of Health, Labour and Welfare (grant number 201221008 to T.A., 201221057 to T.A. and 201311007 to T.A.) and Grants-in-Aid for Scientific Research from the Japanese Society for the Promotion of Science (grant number 24616008 to T.O.), Japan.
Conflict of interest statement
None declared.
