


Abstract
Breast cancer is the most prevalent cancer in women in Japan and the fifth in mortality. This systematic review summarized the evidence for prognostic factors for patients with HR+/HER2− advanced and metastatic breast cancer in Japan.
MEDLINE and EMBASE were searched with keywords ‘breast neoplasms’ AND ‘Japan’ AND ‘advanced’ or equivalent, and Japan Medical Abstract Society database with ‘breast cancer’ AND ‘advanced/metastatic’ for publications from January 2010 to October 2019. ASCO, ESMO, ABC4 abstracts and WHO website were hand searched. The endpoints of interest were overall survival, progression-free survival, tumour response and post-progression survival. Factors were evaluated based on the consistency in direction and the strength (hazard ratios) of association.
Searches identified 4530 publications, of which 27 were eligible. All were observational studies. Among the endpoints, overall survival was the most commonly assessed (n = 22) and evaluated further. Ki-67 expression, progesterone receptor expression status, tumour grade and lymph node metastases were consistently associated with poor overall survival in univariate analysis but not in multivariate analysis. Short disease-free interval, the number of metastatic organs and liver metastasis were consistently associated with poor overall survival in both of univariate and multivariate analysis. The association was strong for liver metastasis (hazard ratio ≥2.8 in the majority of studies) and moderate for disease-free interval and the number of metastatic organs (hazard ratio 1.3–2.8 in the majority of studies).
Disease-free interval, the number of metastatic organs and liver metastasis were identified as independent prognostic factors for overall survival. These findings may help clinical decision-making to improve outcomes in patients with HR+/HER2− advanced and metastatic breast cancer.
Introduction
Breast cancer (BC) is the most diagnosed cancer in women globally, with 2 088 849 new cases in 2018. It is also the most prevalent cancer, affecting 6 875 099 women in the world and having caused the death of 626 679 women in 2018, therewith being the cancer with the highest mortality (15% of all cancer death) in women. In Japan, BC is also the most diagnosed and most prevalent cancer, although its age-adjusted mortality is lower than globally (8.9% of all cancer death) (1).
Development of new agents such as CDK4/6 inhibitors, m-TOR inhibitors and PIK3CA inhibitors have prolonged survival time after recurrence for patients with HR+/HER2− BC. Therefore, it is important to plan the treatment strategy for advanced and metastatic BC (A/MBC) considering the remaining life expectancy. HR+/HER2− A/MBC is a highly heterogeneous disease, and there is still a lack of criteria for personalized treatment choices. Reported prognostic factors in A/MBC include patient-related factors, such as age or menopausal status; disease-related factors, such as tumour stage at initial diagnosis, tumour grade, hormone receptor status (oestrogen and progesterone) or site of the metastasis; and treatment-related factors, such as prior sensitivity to endocrine therapy or prior chemotherapy in the metastatic setting (2). However, a comprehensive summary of such prognostic factors is lacking, and it is currently unknown to what extent these factors can guide clinical decision-making for patients with HR+/HER2− A/MBC.
This systematic review aimed to summarize the evidence in the literature for prognostic factors in patients with HR+/HER2− A/MBC in Japan.
Patients and methods
This systematic literature review (SLR) was conducted based on the preferred reporting items for systematic reviews and meta-analyses guidelines (3) and the AMSTAR quality criteria for methodologically assessing the quality of systematic reviews (4).
Search strategy
The database search was performed in MEDLINE, EMBASE and Japanese Medical Abstract Society (JAMAS) electronic databases for publications encompassed between January 2010 and October 2019. We filtered for language (only English or Japanese) and species (only human-based studies). Our search strategy included keywords such as ‘breast cancer’ ‘metastatic’ and ‘Japan’. The search strategy in MEDLINE was (‘Breast Neoplasms’[Mesh] AND ‘Japan’[Mesh]); in EMBASE was (‘breast cancer’ OR ‘breast carcinoma’ OR ‘cancer and (breast$ or mammar$)’ OR ‘neoplasm and (breast$ or mammar$)’ OR ‘carcinoma and (breast$ or mammar$)’) AND (advanced OR metasta$ OR unresectable) AND japan AND [2010–19]/py; and in the JAMAS was (乳房腫瘍/TH or 乳癌/AL) and ((進行/AL) or (腫瘍転移/TH or 転移/AL)), which in English is: (breast tumour/TH or breast cancer/AL) and ((advanced/AL) or (tumour metastasis/TH or metastasis/AL)). The ASCO BC Symposium, ESMO/ECC, ABC4 and WHO websites were hand searched.
Eligibility criteria
Duplicates were eliminated. Titles and abstracts were assessed for eligibility by two independent reviewers, and publications that met the criteria below were further evaluated as full text.
Patient: Studies including female patients with A/MBC (stages III/IV) and the HR + HER2− subtype. Studies with mixed populations were included only if they analysed specifically patients with A/MBC, and if the HR + HER2− subtype was the most prevalent among the four BC subtypes.
Intervention and comparators: No limitation was set.
Outcomes: Potential prognostic factors evaluated for association with overall survival (OS), progression-free survival (PFS), tumour response and post-progression survival (PPS).
Study design: Observational or interventional studies with sample size ≥25 patients. Letters, commentaries, editorials and reviews were excluded.
Only English/Japanese-written studies published between 1 January 2010 and 31 October 2019 were included.
Quality of evidence assessment
The quality of evidence for potential prognostic factors was assessed based on: (i) number of studies that evaluated the factor; (ii) number of studies that found an association between the factor and outcome, (iii) the consistency of association and (iv) the effect size of association. An association was considered consistent if >50% of the studies that assessed association obtained significant results in the same direction (positive vs negative). The effect size was decided based on the point estimates of hazard ratios (HRs) of the majority of the studies reporting HRs, using the following criteria (5):
Strong: HR ≥2.8
Moderate: HR = 1.3–2.8
Weak: HR < 1.3
Because of the heterogeneity among the included studies, it was not possible to derive a single HR estimate representing the relationship between the factors and outcomes with meta-analysis.
A factor was identified as an independent prognostic factor if it was associated with survival in both univariate (UV) and multivariate (MV) analysis.
Risk of bias
The quality in prognosis studies tool (6) was used to assess the risk of bias (RoB), which uses six domains to evaluate the validity and bias in studies of prognostic factors: (i) study participation, (ii) study attrition, (iii) prognostic factor measurement, (iv) outcome measurement, (v) study confounding and (vi) statistical analyses and reporting. The assessment of the RoB of each domain was based on multiple yes/no questions: If most of the answers for the domain were yes, this domain was considered to have a low RoB; when the proportion of yes and no was equivalent (50–50% or 40–60%), a moderate RoB; and when most of the answers were no, a high RoB.
The overall RoB of each article was concluded based on the results of the six domains:
A low overall RoB if four to six domains were classified as low RoB and the rest as moderate RoB.
A moderate overall RoB if one domain was classified as high RoB and the rest as moderate or low RoB.
A moderate overall RoB if two domains were classified as high RoB and the rest as Low RoB.
A high overall RoB in the rest of the cases.
Results
Study selection
A total of 4530 publications were identified from database search (PubMed: n = 416, EMBASE: n = 1913, JAMAS: n = 2201). No publications were added from the hand-search. After discarding the duplicates, 4419 citations were screened in title and abstract, 50 of which were selected for a full-text review. In total, 22 articles and 5 conference abstracts were included. The consensus of eligibility was reached between the two reviewers for all 27 studies (Fig. 1).
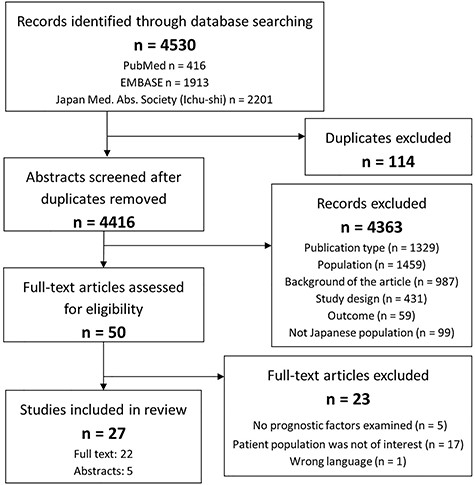
PRISMA diagram illustrating the study selection process. PRISMA, preferred reporting items for systematic reviews and meta-analyses.
Study characteristics
The characteristics of the 27 studies are presented in Table 1. All were observational studies: 17 studies worked on cohorts of <100 patients, and 23 studies were from a single institution. The RoB was high in 13, moderate in 10 and low in 4 studies. The percentage of patients with a HR + HER2− status varied across the studies, being a 40% the minimum. The most commonly assessed endpoint was OS (22 studies) and only a small number of studies evaluated other endpoints (8 studies for PFS, 1 for PPS, 1 for tumour response as clinical benefit rate). Evidence for endpoints other than OS was limited, and therefore, only OS has been evaluated further in this paper.
Characteristics of the 22 articles and the 5 conference abstracts included in the systematic review
| Author and year | Data sources | Study design | n | Study population [stage, HR + HER2− (%)] | Time period | FU (months) | Outcomes analysed | Risk of biasa |
|---|---|---|---|---|---|---|---|---|
| Egawa, 2015 (43) | Hospital database, single institution | R | 69 | III-IV 72% HR + HER2− | 2011–14 | NR | PFS | High |
| Fujihara, 2015 (44) | Hospital database, single institution | R | 43 | IV HR + HER2− | 2011–14 | NR | PFS | High |
| Gonda, 2014 (45)b | Hospital database, single institution | P | 27 | IV NR | NR | NR | OS | High |
| Gonda, 2017 (8) | Hospital database, single institution | P | 36 | IV NR | 2011–16 | NR | OS | High |
| Hashimoto, 2012 (28) | Hospital database, multicenter | R | 92 | IV 82% HR + HER2− | 1999–2008 | 26 | OS, PFS | Moderate |
| Hikichi, 2013 (10)b | Hospital database, single institution | R | 122 | III-IV NR | 2000–12 | 18 | OS | High |
| Inari, 2017 (9) | Hospital database, single institution | R | 96 | IV 55% HR + HER2− | 1970–2014 | 96/40 | OS | Low |
| Kashiwagi, 2018 (13) | Hospital database, single institution | P | 40 | III-IV 40% HR + HER2− | 2000–13 | 14 | OS, PFS | Low |
| Kawaguchi, 2017 (46) | Hospital database, multicenter | R | 824 | III-IV 79% HR + HER2− | 2011–14 | 18 | PFS | Low |
| Kawano, 2013 (18) | Hospital database, single institution | R | 69 | IV 87% HR + HER2− | 1999–2009 | 30 | OS | Moderate |
| Kobayashi, 2011 (27)b | Hospital database, single institution | R | 140 | III NR | 1992–2010 | NR | OS | High |
| Kobayashi, 2016 (17) | Hospital database, single institution | R | 527 | IV 56% HR + HER2− | 2000–08 | 29 | OS | Moderate |
| Koike, 2018 (15) | Hospital database, single institution | R | 97 | III-IV 41% HR + HER2− | 2011–17 | 45 | OS | High |
| Kontani, 2014 (16) | Hospital database, single institution | R | 51 | IV 55% HR + HER2− | 2006–11 | 30 | OS | Moderate |
| Kuba, 2014 (11) | Hospital database, single institution | R | 26 | III-IV HR + HER2− | 2001–10 | 30 | OS | Moderate |
| Miyoshi, 2016 (23) | Hospital data base, multicenter | R | 639 | III-IV HR + HER2− | 2000–04 | NR | OS | Moderate |
| Motomura, 2010 (47) | Hospital database, single institution | R | 41 | IV 93% HR + HER2− | 2001–07 | NR | PFS, CBR | Moderate |
| Ogiya, 2017 (14) | Hospital database, multicenter | R | 339 | IV HR + HER2− | 2000–04 | 76/133 | OS | Moderate |
| Ota, 2018 (20) | Hospital database, single institution | R | 51 | IV 71% HR + HER2− | 2012–16 | 18 | OS, PFS | High |
| Shiino, 2016 (12) | Hospital database, single institution | R | 153 | III-IV 67% HR + HER2− | 1985–2013 | NR | OS | Low |
| Shiomi-Mouri, 2016 (7) | Hospital database, single institution | R | 98 | III/IV 55% HR + HER2− | 2007–13 | NR | OS | Moderate |
| Soshi, 2018 (48) | Hospital database, single institution | R | 41 | IV HR + HER2− | 2012–16 | NR | PFS | High |
| Sunagawa, 2018 (22) | Hospital database, single institution | R | 21 | III-IV 52% HR + HER2− | 2011–16 | NR | OS | High |
| Tanaka, 2017 (21) | Hospital database, single institution | R | 32 | III-IV 53% HR + HER2− | 2011–16 | NR | OS, PPS | High |
| Watanabe, 2016 (25)b | Hospital database, single institution | R | 286 | III/IV HR + HER2− | 2002–16 | NR | OS | High |
| Yamamura, 2018 (24) | Hospital database, single institution | R | 172 | IV HR + HER2− | 2000–03 | NR | OS | Moderate |
| Yoshitsugu, 2017 (26)b | Hospital database, single institution | R | 311 | III-IV HR + HER2− | 2002–17 | NR | OS | High |
R, retrospective; P, prospective; NR, not reported; FU, follow-up; OS, overall survival; PFS, progression-free survival; CBR, clinical benefit rate; PPS, post-progression survival.
aRisk of bias was assessed using the quality in prognosis studies tool (6).
bAbstract congresses.
Prognostic factors for OS
A total of 33 factors were investigated across the 22 studies for association with OS, and 10 factors were investigated only in one study: circulating tumour cells count (7), myeloid-derived stem cells levels (8), enhancer of zeste homologue 2 expression (9), presence of brain metastases (10), number of brain metastases (11), presence of distant metastases (12), combination of progression pattern and tumour infiltrating lymphocytes (13), discordance in hormone receptor status (12), percentage of progesterone receptor expression (PgR) (14) and performance status (15). Because only a single study investigated these factors, the consistency of association could not be assessed and therefore they were excluded from further evaluation. Several studies investigated five factors specific to anti-tumour treatment. Clinical benefit rate (10,15–18) and objective response rate (13,16) were excluded from our evaluation because these are the outcomes of anti-tumour treatment provided after diagnosis of A/MBC so are not regarded as prognostic factors. Treatment history variables, presence of prior chemotherapy (ChT) or hormonotherapy (7,12,14,19,20), and the number of prior ChT (21,22), were also excluded due to the inconsistency in their definition. Although age was evaluated in multiple studies (7,11,13,15,16,18,22–24), none of them reported a significant association with OS, so age was also excluded from our further evaluation.
Among the remaining 16 factors listed in Table 2, 7 factors were found to be consistently associated with OS in UV analysis: Ki-67 expression, disease-free interval (DFI), number of metastatic organs (MORGs), liver metastases, lymph node metastases, tumour grade and PgR status (Figs 2 and 4). Within these seven factors, consistent association with OS was found also in MV analysis for DFI, number of MORG and liver metastases (Fig. 3), whereas association was not consistent for Ki-67 expression, lymph node metastases, tumour grade and PgR status in MV analysis (Fig. 5). Association with OS for the rest of the factors in Table 2 (9 out of 16), aldehyde deshydrogenase 1 (ALDH1) expression, lung metastases, lymphovascular invasion, type of A/MBC, progression pattern, oestrogen receptor (ER) status, tumour size, visceral metastases and bone metastases, was inconsistent in UV analyses, and either inconsistent or not evaluable in MV analyses. Details of the findings for each of the 16 factors are described in Table 2 and in the following sections.
Quality of evidence assessment for the potential prognostic factors for overall survival
| Prognostic factor | Measure | Univariate analysis (UV) | Multivariate analysis (MV) | Association | ||||||
|---|---|---|---|---|---|---|---|---|---|---|
| Number of studies with UV | Association | No association | Consistency of findings | Number of studies with MV | Association | No association | Consistency of findings | |||
| ALDH1 expression | − vs + | 2 | (23) | (28) | I—50% | 1 | - | (23) | NE | No |
| Ki-67 expression | Low vs high | 5 | (9,14,27) | (13,23) | C—60% | 3 | (27) | (14,23) | I—33% | UV only |
| DFI | >2 yrs vs <2 yrs or >3 yrs vs <3 yrs | 6 | (9,10,14,16, 17,24) | - | C—100% | 7 | (14,17,25,26) | (9,10,20) | C—57% | UV and MV |
| Number of MORG | Single vs multiple | 5 | (7,14,17,24) | (16) | C—80% | 5 | (14,17,26) | (7,24) | C—60% | UV and MV |
| Visceral metastases | Absence vs presence | 3 | - | (16,21,24) | I—0% | 1 | (21) | - | NE | No |
| Liver metastases | Absence vs presence | 5 | (10,17,20,24) | (18) | C—80% | 4 | (10,17,20,24) | - | C—100% | UV and MV |
| Lung metastases | Absence vs presence | 3 | (10) | (18,24) | I—33% | 1 | - | (10) | NE | No |
| Lymph node metastases | − vs + ≤3 vs >4 | 5 | (12,14,23,27) | (9) | C—80% | 4 | (23) | (12,14,27) | I—25% | UV only |
| Lymphovascular invasion | No vs yes | 2 | (12) | (9) | I—50% | 2 | - | (9,12) | I—0% | No |
| Bone metastases | Absence vs presence | 2 | - | (18,24) | I—0% | 1 | (25) | - | NE | No |
| Type of A/MBC | De novo vs recurrent | 2 | (24) | (13) | I—50% | 1 | - | (24) | NE | No |
| Progression pattern | PNM vs PLL | 2 | (13) | (21) | I—50% | 1 | - | (21) | NE | No |
| PgR status | PgR+ vs PgR− | 5 | (9,18,27) | (14,23) | C—60% | 4 | (18) | (9,23,27) | I—25% | UV only |
| ER status | ER+ vs ER− | 4 | (9) | (13,18,21) | I—25% | 2 | (21) | (9) | I—50% | No |
| Tumour grade | Grade 1/2 vs grade 3 | 6 | (10,14,23,27) | (12,16) | C—66% | 4 | (23) | (10,14,27) | I—25% | UV only |
| Tumour size | T1/T2 vs T3 T1 vs T2/T3 | 3 | (12) | (9,23) | I—33% | 1 | (12) | - | NE | No |
Only the 16 factors assessed for quality of evidences are represented in the table. Please see section 3.3 for details of factor selection. DFI, disease-free interval; MORG, metastatic organs; A/MBC, advanced and metastatic breast cancer; PgR, progesterone receptor; PNM, progression due to new metastases; PPL, progression due to pre-existing lesions; C, consistent, I, inconsistent; NE, Not evaluable for consistency.
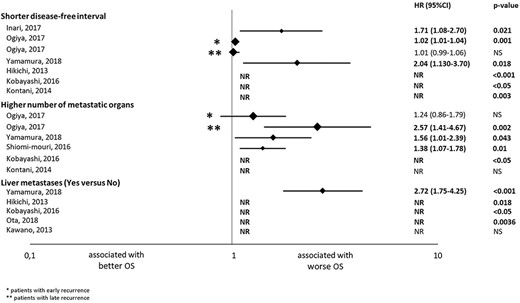
Results of the univariate analysis of the studies evaluating the association with overall survival (OS) of disease-free interval, number of metastatic organs and liver metastases. The hazard ratios (HRs) are represented with a diamond, the size of which correlates with the sample size. The size of the lines represents the 95% confidence intervals (CIs). The numerical values of the HRs are presented in the right of the graph together with the P values. *Results in patients with early recurrent breast cancer; **Results in patients with late recurrent breast cancer. NR, not reported; NS, not significant.

Results of the multivariate analysis of the studies evaluating the association with overall survival (OS) of disease-free interval, number of metastatic organs and liver metastases. The hazard ratios (HRs) are represented with a diamond, the size of which correlates with the sample size. The size of the lines represents the 95% confidence intervals (CIs). The numerical values of the HRs are presented in the right of the graph together with the P values. *Results in patients with early recurrent breast cancer; **Results in patients with late recurrent breast cancer. NR, not reported; NS, not significant.
As we observed variability in the OS definition among the studies, a sensitivity subgroup analysis was performed including only the studies assessing OS from diagnosis of A/MBC (Supplementary Table 1) to evaluate the impact of variability. Finding from this subgroup analysis was consistent with that of our main analysis (Table 2), and DFI, number of MORG, liver metastasis remained to be consistently associated with OS both in UV and MV analyses.
Factors with consistent OS association in both UV and MV analyses
The HR reported from each study for the factors below are summarized in Fig. 2 (UV analysis) and Fig. 3 (MV analysis).
Disease-free interval
DFI was assessed in nine studies, eight of which obtained a significant association between shorter DFI and worse OS in either UV or MV analyses. All of the six studies with UV analysis (9,10,14,16,17,24) found an association; HR [95% confidence interval (CI)] was 1.71 [1.08–2.70] (P = 0.021), 1.02 [1.01–1.04] (P = 0.001), 2.04 [1.13–3.70] (P = 0.018) and HR not reported (NR) in three studies (P < 0.001, P < 0.05 and P = 0.003). In seven studies with MV analysis, four studies (14,17,25,26) obtained significant results; HR [95% CI] was 1.02 [1.01–1.04] (P = 0.002), 2.22 [1.56–3.12] (P < 0.00001), 1.50 [1.01–2.23] (P = NR) and 1.49 [NR] (P < 0.05). These results show that a shorter DFI is independently associated with worse OS, and its effect size was considered to be moderate as the majority (4 out of 5) of the HR reported from MV analysis were within the range of 1.3 and 2.8.
Number of MORGs
The number of MORG was evaluated in five studies. Four (7,14,17,24) studies with UV analysis found that patients with multiple MORGs had poorer OS than those with a single MORG; HR [95% CI] was 1.38 [1.07–1.78] (P = 0.01), 2.57 [1.41–4.67] (P = 0.002), 1.56 [1.01–2.39] (P = 0.043) and HR NR (P < 0.05). Three studies with MV analysis (14,17,26) reported an association; HR [95% CI] was 2.18 [1.07–4.43] (P = 0.03), 1.77 [1.14–2.74] (P = 0.01), 1.61 [NR]) (P < 0.05). Therefore, the number of MORG was an independent prognostic factor for poorer OS, and its effect size was moderate as the majority (3 out of 4) of the HR reported from studies with MV analysis were between 1.3 and 2.8.
Liver metastases
Five studies assessed the presence of liver metastases in UV analysis and four (10,17,20,24) studies found an association with worse OS; HR 2.72 (95% CI 1.75–4.25, P < 0.001) and HR NR in three studies (P = 0.018, P < 0.05, P = 0.0036). Liver metastasis was an independent prognostic factor of poor OS; HR [95% CI] was 1.98 [1.32–2.96] (P = 0.0008); 2.84 [1.74–4.65] (P < 0.001), 3.75 [1.10–12.7] (P = 0.035) and HR NR (P < 0.05) in MV analysis (10,17,20,24). Its effect size was considered to be strong as the majority (2 out of 3) of the HR reported from MV analysis were >2.8.
Factors with consistent OS association only in UV analysis
The HR reported from each study for the factors below are summarized in Fig. 4 (UV analysis) and Fig. 5 (MV analysis).
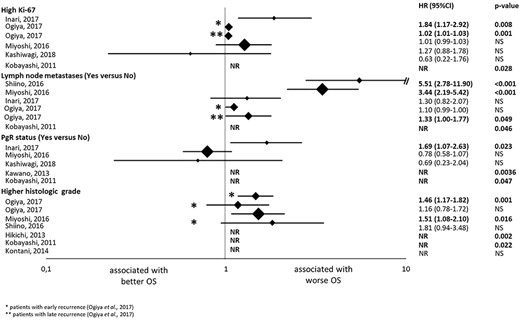
Results of the univariate analysis of the studies evaluating the association with overall survival (OS) of ki-67 expression, lymph node metastases, progesterone receptor expression (PgR) status and tumour grade. The hazard ratios (HRs) are represented with a diamond, the size of which correlates with the sample size. The size of the lines represents the 95% confidence intervals (CTs). The numerical values of the HRs are presented in the right of the graph together with the P values. *Results in patients with early recurrent breast cancer; ** Results in patients with late recurrent breast cancer. NR, not reported; NS, not significant.
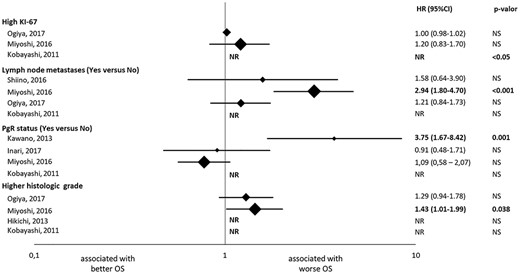
Results of the multivariate analysis of the studies evaluating the association with overall survival (OS) of ki-67 expression, lymph node metastases, progesterone receptor expression (PgR) status and tumour grade. The hazard ratios (HRs) are represented with a diamond, the size of which correlates with the sample size. The size of the lines represents the 95% confidence intervals (CTs). The numerical values of the HRs are presented in the right of the graph together with the P values. *Results in patients with early recurrent breast cancer; ** Results in patients with late recurrent breast cancer. NR, Not reported; NS, Not significant.
Ki-67 expression
Five studies assessed the Ki-67 expression. Three studies (9,14,27) reported an association between higher Ki-67 expression and worse OS in UV analysis; HR [95% CI] was 1.84 [1.17–2.91] (P = 0.008), 1.02 [1.01–1.03] (P = 0.001) and HR NR (P = 0.028). In MV analysis, only one (27) out of the three studies reported an association; HR NR (P < 0.05).
Lymph node metastases
Five studies assessed the number of metastatic lymph nodes. Four (12,14,23,27) studies reported an association between larger number of lymph node metastasis and worse OS in UV analysis; HR [95% CI] was 5.51 [2.78–11.9] (P < 0.001), 1.33 [1.00–1.77] (P = 0.049), 3.44 [2.19–5.42] (P < 0.001) and HR NR (P = 0.046). However, only one (23) of the four studies with MV analysis found an association; HR 2.94 (95% CI 1.80–4.70, P < 0.0019).
PgR status
Five studies assessed PgR status. Two studies used 1% as a cut-off for PgR positivity (9,18). One study used 20% (23), whereas two studies did not report the cut-off (14,27). Three studies (9,18,27) found that patients with PgR+ had longer OS than patients with PgR- in UV analysis; HR 1.69 (95% CI 1.07–2.63, P = 0.023), HR NR in two studies (P = 0.0036, P = 0.047). Only one (18) of the four studies with MV analysis reported an association; HR 3.75 (95% CI 1.67–8.42, P = 0.001).
Tumour grade
Six studies assessed the tumour grade. Four (10,14,23,27) obtained an association between a grade 3 tumour and poorer OS; HR [95% CI] was 1.46 [1.17–1.82] (P = 0.001), 1.51 [1.08–2.10] (P = 0.016), HR NR in two studies (P = 0.002, P = 0.022). Only one of them (23) obtained significant results in MV analysis; HR 1.43 (95% CI 1.01–1.99, P = 0.038).
Factors without consistent OS association
The HR reported from each study for the factors below are summarized in Fig. 4 (UV analysis) and Fig. 5 (MV analysis).
ALDH1 expression
Two studies evaluated the ALDH1 expression. In one study (23), the authors found an association between the expression of ALDH1 and worse survival, but only in UV analysis (UV: HR 1.552, 95% CI 1.057–2.218, P = 0.025; MV: 1.451, 95% CI 0.985–2.085, P = 0.059). The other study (28) failed to obtain significant results between the ALDH1 expression and survival, leading to an inconclusive association.
Visceral metastases
Three studies (16,21,24) evaluated the presence of visceral metastases. No association between the presence of visceral metastases and OS was found in UV analysis. One of these studies (21) found a weak association in MV analysis, HR 0.20 (95% CI 0.04–0.82, P = 0.025). However, this study had a high RoB and a low sample size (n = 32).
Lung metastases
Three studies evaluated lung metastases. Only one study (10) found an association in UV analysis between presence of lung metastases and a poorer survival (HR NR, P = 0.014), but not in MV (HR NR, P = NR). The remaining two studies did not find an association (18,24), resulting in an inconclusive association.
Lymphovascular invasion
Two studies evaluated the lymphovascular invasion. One study (12) found that lymphovascular invasion was associated with poorer survival, HR 4.03 (95% CI 1.83–8.88, P = 0.001) in UV analysis, although this was not an independent prognostic factor for OS in MV analysis. The other study (9) did not find an association.
Bone metastases
Two studies (18,24) evaluated bone metastases in UV analysis and failed to find an association, whereas another study (25) reported that presence of bone metastases was associated with poorer OS in MV analysis; HR 1.57 (95% CI 1.02–2.40, P = NR).
Type of A/MBC
Two studies evaluated the type of A/MBC (de novo vs recurrent). One study (24) found that patients with the novo A/MBC had better OS than patients with recurrent A/MBC in UV analysis; HR 0.63 (95% CI 0.40–0.99, P = 0.047), although failed to find this association in MV analysis. The other study (13) did not detect an association.
Progression pattern
Two studies evaluated the progression pattern. One study (13) found that patients with progression due to new metastases had better OS than those with progression due to pre-existing lesions in UV analysis; HR NR (P = 0.017), whereas the other study (21) failed to find an association.
ER status
Four studies evaluated the ER status. Only one study (9) obtained an association between ER+ and improved survival in UV analysis; HR 0.54 (95% CI 0.34–0.85, P = 0.008), but not in MV analysis. However, one study (21) with non-significant results in UV analysis did report a significant association in MV analysis; HR 0.13 (95% CI 0.03–0.53, P = 0.004).
Tumour size
Three studies evaluated the tumour size. One study (12) found an association between a T3 tumour size and worse OS in both UV and MV analysis (UV: HR 7.16, 95% CI 3.33–15.4, P < 0.001; MV: HR 3.05, 95% CI 1.21–7.69, P = 0.02), whereas the other two studies (9,23) did not find associations.
Discussion
This systematic review aimed to provide an overview of prognostic factors for patients with HR + HER2− A/MBC in Japan that can potentially guide clinical decision-making. As a result, 33 factors were observed to be evaluated in the 27 studies for association with OS, 7 of which were consistently associated with survival in UV analysis. DFI, liver metastases and the number of MORG were consistently associated with survival in both UV and MV analyses and so identified as independent prognostic factors. A preceding systematic review for global population based on English literature also identified these three factors as poor prognostic factors (29). In this SLR in Japan, all of the collected studies were observational studies. This was consistent with the preceding global SLR, in which 90% of the collected studies were observational (29). This may mean that most of the studies on the prognostic factors in this field are of observational nature.
The DFI is one of the most frequently reported prognostic factors in A/MBC. Previous studies have demonstrated that patients who experience a relapse in shorter time after treatment for localized BC have a more aggressive metastatic disease (30), with a DFI shorter than 2 years as an independent factor of worse survival (2,31). This agrees with our results, with all but one of the included studies using a cut-off point of 2 years.
The metastasis of BC has a propensity for specific organs, being bone, lung, liver and brain the most frequent (32). The site of metastases and the number of organs involved are also widely studied for association with survival in A/MBC, and reported to be prognostic factors. For instance, bone metastases is the site with the best prognosis, whereas those with brain metastases have the worst outcome (31,33). Our data show that multiple MORGs and presence of liver metastases are independently associated with worse survival. Liver metastasis has been reported to be associated with high aggressiveness and treatment resistance of BC among the different metastatic sites (34,35), which may explain the high consistency and large effect size (HR ≥2.8 in majority of the studies) of its association with OS in this literature review.
The Safari study is a recent large multicentre retrospective study in Japan with postmenopausal ER+ A/MBC patients who received fulvestrant at any line of therapy. The OS analysis of the Safari study was published after our search period and therefore was not included in our analysis (36). In contrast to our results, they did not report DFI as an independent prognostic factor. This discrepancy might be partly due to the difference in definition of the DFI, as they used a cut-off of 5 years, whereas the cut-off of most of the studies included in our review was 2 years. Another potential reason is differences in the patient population. Many patients with poor prognosis such as those with short DFI might shift to ChT without having chances to receive fulvestrant and are thus excluded from the Safari study. Comparisons cannot be made regarding the number of MORG and the presence of liver metastases as these were not evaluated in the Safari study.
The other factors found in this review for association with survival in UV analysis only are ki-67 expression, PgR status, tumour grade and lymph node metastases. These are widely known prognostic factors that are important to decide the perioperative treatment strategy for patients with EBC, together with the BC subtypes and TNM stage (37,38). The histological grade was also found to be independently correlated with OS in the Safari study (36). Our review found that these are not independent prognostic factors in patients with A/MBC, which may be due to confounding with other prognostic factors including DFI, differences in the evaluation and in the cut-offs of factors, or found heterogeneity in the treatment patterns in the different studies.
Finally, age has been extensively studied for association with survival in patients with A/MBC. An older age at diagnosis of BC is known to be associated with poorer survival, although younger patients have significantly more aggressive disease presentations in advanced stage than older patients (39–41). An association between younger age at diagnosis and longer OS was also found in the Safari study (36). Although we have not evaluated the consistency of the association between age and OS because no study included in this review reported this association; multiple studies reported a trend of association between higher age and poorer OS, that has not reached statistical significance potentially because of the relatively small sample size (7,11,13,15,16,18,22–24). In addition, previous publications reported a potential prognostic role of gender (42). In our literature review, we did not include the studies with only male patients. Within the 27 studies collected, only one male patient was included in one study (7) and the gender was not evaluated as a prognostic factor in any of the studies. Hence, we could not evaluate the prognostic role of gender in this review.
Several limitations exist in this review. Most of the studies included had high or moderate RoB for prognostic evaluation. The main driver of RoB was the poor description of study population attrition. The year of publication was diverse (2010–19), so standard/available treatment options were not uniform among studies. As a literature review, the factors included in this study were limited only to those that were evaluated in original studies. Heterogeneity was observed across the studies in the composition of population, definition of some factors and timing of baseline characteristics evaluation. Also, different definitions of OS were used across studies, although the sensitivity analysis revealed that this heterogeneity did not affect our main findings. Because of the heterogeneity across studies, we could not derive a single HR estimate for each factor. In addition to such heterogeneity, the small sample size in most of the studies might have hampered the identification of association between some of the evaluated factors and OS.
In conclusion, this study for the Japanese population identified DFI, the number of MORGs and liver metastasis as independent prognostic factors for OS in patients with HR + HER2− A/MBC in Japan. Other factors associated with OS in UV analysis only were ki-67 expression, lymph node metastases, PgR status and tumour grade. Further research is needed to clarify the association with OS and the factors with limited evidence. Our results may help planning further research and clinical decision-making in daily practice for tailored medicine, to improve outcomes in patients with HR+/HER2− A/MBC.
Conflict of interest statement
Eli Lilly employees (Diego Novick, Kana Takaura, Yoshinori Tanizawa, and Tsutomu Kawaguchi) were involved in the study design, and in the preparation and revision of the manuscript. Josep Maria Haro has received honoraria for participating in Eli Lilly and Co., Roche and Lundbeck advisory boards. Anna Monistrol-Mula conducted the literature search under a contract of Fundació Sant Joan de Déu with Eli Lilly and Co.
