


Abstract
We examined the feasibility of externally marking insects with the liquid fluorescent forensic theft deterrent, SmartWater (SmartWater CSI, LLC.). We sprayed captive Lygus hesperus (Knight) (Hemiptera: Miridae), Bemisia tabaci (Gennadius) (Hemiptera: Aleyrodidae), and Hippodamia convergens Guérin-Méneville (Coleoptera: Coccinellidae) with SmartWater fluorophore, and then qualitatively examined them for fluorescence by visual inspection under ultraviolet (UV) light and quantitatively measured them with a multiwavelength microplate fluorometer. The results indicate that this product has enormous potential as a taggant for L. hesperus and B. tabaci. However, the marking efficiency for H. convergens was only adequate. The advantages and limitations of using SmartWater as a biological marker for arthropod mark-release-recapture research are discussed.
Understanding the dispersal characteristics of pests, natural enemies, and pollinators is essential to understanding their host ranges and population dynamics. Often dispersal studies require that the arthropod of interest is marked so it can be tracked in nature. The type of taggant employed is dependent on whether the study is a mark-release-recapture or mark-capture type experiment. In either case, an effective mark should be durable, easy to identify, and benign to the arthropod of interest.
SmartWater (SmartWater CSI, LLC, Fort Lauderdale, FL) is a forensic theft deterrent marketed as a long-lasting, traceable liquid taggant used to label valuable property or monitor criminal activity. The product is invisible under visible spectrum light and fluoresces under UV light. It can optionally be used in concert with eutectic nanoparticles (thermal bar codes) or DNA tags that can be identified by differential scanning calorimetry or PCR, respectively (Duong et al. 2014). This feature would be useful as a double marking technique if specific cohorts of uniquely marked arthropods are needed for release at different locations within a study site. Of particular interest to entomologists is the product’s intended use in outdoor conditions and its resistance to degradation during handling. The use of SmartWater as a marker on arthropods has been validated by Faiman et al. (2021), who demonstrated its utility for mosquitoes.
Here we report on the findings from a series of experiments that examined various aspects of the acquisition, lethality, and temporal steadfastness of SmartWater on three insect species common to the agroecosystems. A vital feature of this novel marking technique explored herein is that the mark can be detected visually or measured with a fluorometer. This option can allow for greater flexibility in research design. The effectiveness of using SmartWater as a taggant for several types of insects and its advantages, limitations, and possible future applications are discussed.
Materials and Methods
Test Insects
Adult and immature Lygus hesperus Knight (Hemiptera: Miridae) were obtained from a laboratory-reared colony that was reared on green beans. They were collected just before the marking of the specimens. Adult Hippodamia convergens Guérin-Méneville (Coleoptera: Coccinelidae) were purchased en masse from a commercial insectary (Arbico Organics, Oro Valley, AZ). The beetles were preserved by storing at 4°C upon their arrival. Then, the specimens were removed from the refrigerator and placed at room temperature (27°C) for ca. 1 h before marking. Adult Bemisia tabaci (Gennadius) (Hemiptera: Aleyrodidae) were collected from infested cotton and squash plants grown in greenhouses located at our facility. The whiteflies were collected just before their marking.
First Experiment
Insect Marking Protocol
The first experiment was a pilot study conducted to determine if SmartWater could be used as a taggant for two insect species commonly found in agroecosystems. The product’s acquisition, temporal steadfastness, and potential lethality were examined on L. hesperus (lygus bugs) and H. convergens (lady beetles). The study contained a SmartWater and a water-only (control) mark treatment.
SmartWater is available in several colors (Faiman et al. 2021). It contains two proprietary components, a liquid fluorescent dye, and a liquid polymer emulsion. The SmartWater product used in this study was labeled Cartax. Cartax yields a vivid fluorescent green color when viewed under ultraviolet (UV) light. For this experiment and those described below, 2.5 ml of the mixture consisted of 2,185 µl dH2O, 312.5 µl Cartax, and 2.5 µl polymer. Adults of each species (approximately 300) were placed in separate 2.8-liter plastic containers (Rubbermaid, Atlanta, GA) and immobilized by cooling at 4°C for 10 min. Then each arthropod species per mark treatment was topically sprayed with 2.5 ml of SmartWater or water using an airbrush sprayer (Model VL, Paasche Airbrush Company, Harwood Heights, IL). All marking took place within a laboratory fume hood. The volume of the mark applied with the airbrush was arbitrarily chosen for the pilot study.
After marking, the insects were air-dried at 27°C for ≥1 h. Thirty specimens were taken straight from the marking containers and frozen (Day 0 marking treatment). The remaining specimens were then divided into cohorts of 10 individuals. A cohort of cartax-marked and water-marked H. convergens and L. hesperus were then released into separate screen cages, each containing a 40–60 cm tall cotton plant, where they could roam freely for 24 hrs. The caged plants were maintained in a 30°C greenhouse. The greenhouse cotton was infested with B. tabaci (whiteflies), which provided an ad libitum food source for the carnivorous lady beetles and a potential supplement for the omnivorous lygus bugs.
Three caged plants were randomly collected from the greenhouse every other day after the marking event and placed into a walk-in refrigerator (4°C) to reduce the insects’ mobility. The insects were collected by hand and recorded as dead or alive. The dead insects were discarded, and each living specimen was placed into a 1.5-ml microcentrifuge tube and preserved for later analysis by freezing at −60°C. Data were collected for 7 and 13 d after marking for L. hesperus and H. convergens, respectively. The shorter duration of the experiment for L. hesperus was due to an unexpected high mortality rate of both the SmartWater and water-marked specimens.
Qualitative Evaluation
Insects were visually scored for the presence of the fluorophore by removing each insect from the microcentrifuge tube and examining it under UV light with a 10× dissecting microscope. Each specimen was scored positive or negative for the fluorophore by a single observer. The percentage of L. hesperus and H. convergens scoring positive for the fluorophore were calculated for both mark treatments.
Quantitative Evaluation
Each insect was placed dorsal side up into a well of a clear 96-well microplate (Falcon Pro-Bind 3915, Corning Incorporated, Kennebunk, ME). Each specimen was then evaluated for fluorescence intensity, as measured by Relative Fluorescence Units (RFU) using a Synergy 2 multidetection microplate reader (BioTek Instruments, Inc. Winooski, VT). The microplate fluorometer was programmed to project an excitement beam of light at a wavelength of 370 nm and read emissions at a wavelength of 540 nm, as recommended by the manufacturer of SmartWater. The reader was programmed to take five dorsal and five ventral readings within each well of the microplate, at the center of each well, and several millimeters from the center at the 3, 6, 9, and 12 o’clock positions.
The maximum RFU value of the 10 readings recorded for each insect specimen was used for data analysis. Eight unmarked insects, serving as negative controls, were included on each microplate. These specimens served to determine the baseline level of autofluorescence by each species. From these eight unmarked insects, a critical threshold value (CTV), designated as the mean ± 3 SD of the maximum readings of the eight control insects, was calculated for each plate. Each sample on a given plate was scored as positive for the presence of the fluorophore mark if its maximum RFU value exceeded the CTV.
Second Experiment
The second study examined different marking and handling methods to reduce the mortality of L. hesperus. The new protocol consisted of using a different marking container, a different spray apparatus, and applying less marking solution onto the insects. Two cohorts (n = 160) of 2-d-old adults were collected from the laboratory colony. Each cohort was further divided into four smaller cohorts of 40 individuals and placed in separate marking containers. The containers were seven-dram plastic snap vials (Berlin Packaging, Chicago, IL) with the bottom cut out and replaced with fine mesh organdy fabric. The L. hesperus cohorts were placed into the marking containers, the vials were capped, and the insects were immobilized by placing them in a 4°C refrigerator for 10 min.
After immobilization, each smaller cohort was marked with either SmartWater or water using a standard medical nebulizer (Hudson RCI Micro Mist Nebulizer 1882, Teleflex Inc., Morrisville, NC). The nebulizer reservoir was filled with 2.5 ml of liquid as described above. Air was supplied from a fume hood air nozzle, adjusted to dispense a slow and steady flow of mist through the nebulizer, which was held directly against the organdy bottom of the container for 45 seconds. Approximately 0.75 ml of the mark was dispensed during each of the 45 sec marking events. After marking, the lygus bugs were dried at 27°C for 1 h.
Postmarking handling was modified from the first experiment by placing five marked lygus bugs in 0.47 L round plastic deli containers (Fabri-Kal, Kalamazoo, MI) containing fresh green beans for food and crumbled paper for a substrate. Fresh green beans were added to the holding containers as needed throughout the study. The lids of the containers included a large hole covered with mesh fabric to facilitate airflow. The lygus bugs in each holding container were kept in the laboratory at 27°C, 12:12 L:D, and 30% RH. Four containers were randomly selected every other day for 13 d after marking. The five insects enclosed in each container were recorded as dead or alive. The dead insects were discarded, and the living specimens were killed by freezing at −60°C and then placed individually into 1.6 ml microtubes. The specimens were preserved in the freezer until the analysis for the presence of the mark.
Qualitative Evaluation
Each L. hesperus specimen was removed from its microcentrifuge tube and placed into a well of a black clear-bottom 96-well microplate (Costar No. 3603, Corning Inc., Kennebunk, ME). The whole plate was then placed onto a UV transilluminator table (Spectronics Corporation, Spectroline Ultraviolet Transilluminator, Model TS-312R, Melville, NY) and photographed with a smartphone camera. Each of the 96 specimens was then scored as either positive or negative for the mark’s presence by one of the authors.
Quantitative Evaluation
After the qualitative evaluation, each specimen was measured for the presence of the fluorophore with the microplate fluorometer as described above.
Third Experiment
The third experiment assessed the risk of a SmartWater-marked insect transferring the mark to an unmarked insect. The first portion of this study was designed as a worst-case scenario. That is, we purposefully overcrowded holding arenas with marked and unmarked specimens, ensuring a high level of direct contact between lygus bugs over a 24 h postmarking holding period.
Adult L. hesperus were marked with SmartWater using the same protocol used in the second experiment. After drying, the marked adults (n = 32) were placed into a holding arena (0.47 L deli container) that contained 48 unmarked fourth instar lygus bug nymphs. Each holding arena contained fresh green beans for a food source. After 24 h, the specimens in each container were killed by freezing. This portion of the study was repeated with sample sizes consisting of 32 marked adults and 46 unmarked nymphs. The RFU values yielded by the SmartWater and water-marked specimens between the two trials were homogeneous. Therefore, the data were pooled to simplify the presentation of the data. The crowded-arena scenario was then repeated, with fourth instar nymphs serving as the marked group and adults serving as the unmarked group. This experiment had two trials with sample sizes of 32 and 31 marked nymphs and 48 and 47 unmarked adults, respectively. Again, the data from both trials were similar so these data were pooled for data presentation.
We repeated this experiment with uncrowded arenas. Five marked adults and five unmarked nymphs were contained in each holding arena for 24 hrs. This study was repeated 12 times, and data obtained from each trial were pooled for data presentation.
Qualitative Evaluation
Each lygus bug was placed into an individual well of a black 96-well microplate, then photographed under UV light using a smartphone camera. The lygus bugs were independently scored by direct observation by each author of the study. The observers did not have prior knowledge of whether the specimens were from the marked or unmarked treatment. Each observer ranked the specimens on a relative scale of 0, 1, 2, or 3, indicating no, slight (probable autofluorescence), abundant, and substantial fluorescence, with scores of 2 and 3 designated as positive for the presence of the fluorophore.
Quantitative Evaluation
After the qualitative evaluation, each L. hesperus sample was measured for the presence of the fluorophore using the microplate fluorometer as described above.
Fourth Experiment
The fourth study evaluated SmartWater as a taggant for marking B. tabaci (whiteflies), a tiny and delicate insect. Adult whiteflies of various ages were collected en masse from infested cotton and squash plants grown at our facility greenhouses. The whiteflies were divided into six cohorts of ca. 2,000 individuals each. Each cohort was placed in a clean seven-dram snap vial marking vessel, as described above. The whiteflies were immobilized by cooling at 4°C for 10 min.
Three cohorts of whiteflies per treatment were marked with 2.5 ml of SmartWater or water, using the nebulizer described above. After marking, the whitefly specimens in each marking vial were dried at 27°C for 1 h, then released into mesh cages measuring 0.5 × 0.5 × 0.5 m, placed in a greenhouse set at 30°C and 30% RH. The cages contained a single live eggplant (Solanum melongena) that was devoid of whitefly eggs, nymphs, and adults. Adult whiteflies were collected from each cage by placing the bottom of a clean 60 mm diameter plastic Petri dish under a leaf of the eggplant and tapping the leaf. The whiteflies that fell into the dish were captured by capping the dish. The captured whiteflies were immediately frozen at −60°C to preserve for analysis. Whitefly collections were made every other day for 16 days after marking. Our goal was to collect approximately 10 whiteflies per cage (n = 30 per mark treatment) on each sampling date. However, the recapture rates declined as the postmarking intervals increased.
Qualitative Evaluation
Whiteflies were removed from the freezer, and each specimen was placed into a well of a black 96-well microplate. The microplates were photographed under UV light using a smartphone. Each photographed whitefly was independently scored for the presence of the fluorophore by all four authors of the study as described above.
Quantitative Evaluation
At the time of this experiment, we obtained a new microplate fluorometer (SpectraMax iD3, Molecular Devices, LLC, San Jose, CA), which was used to measure the RFU emitted by each whitefly specimen. As above, the fluorescence was measured at an excitation wavelength of 370 nm and an emission wavelength of 540 nm. For scanning, individual whitefly was placed roughly in the center of a well of a 96-well microplate.
Due to the small size of whitefly with respect to the well of a microplate, the microplate reader was programmed to take 21 dorsal and 21 ventral point readings (well scan set to ‘Fill’ setting, with 21 points per well at a point spacing of 0.84 mm and density of 5). Preliminary testing demonstrated that this was sufficient coverage to consistently identify marked whitefly while minimizing overall reading time. To compensate for issues with high autofluorescence, the average of the three highest of the 42 readings yielded for each specimen (referred to hereafter as top-three mean, TTM) was used for data analysis (see Discussion for detailed explanation). Eight unmarked whiteflies per microplate served as negative controls. Whitefly specimens were scored positive for the fluorophore if their TTM value exceeded a threshold value of three standard deviations above the average TTM value generated by the unmarked whitefly controls.
Fifth Experiment
The fifth study examined the volume of SmartWater necessary to effectively mark whiteflies, minimize mortality, and conserve material while retaining a clear, durable mark. The volume of the mark applied as a function of the time that the whiteflies were exposed to the nebulizer. Whiteflies were collected directly into the seven-dram marking vessels described above. The open end of the vial was placed under an infested cotton leaf and the leaf was tapped to knock the whiteflies under the leaves into the vial. We attempted to collect at least 20 whiteflies in each of eight vials. The vials were immediately capped and placed in the refrigerator for 10 min to immobilize the whiteflies.
After immobilization, each vial was removed from the refrigerator, and its plastic cap was quickly replaced with mesh fabric held in place with a rubber band. The whiteflies contained in each vial were then marked using the nebulizer method described above. Cohorts of whiteflies were marked with SmartWater or water for 10, 20, 30, or 60 s. For reference, in the previous experiment, it took approximately 120 s to dispense the 2.5 ml of marking solution. The whiteflies were air-dried at room temperature for 1 h.
The whiteflies in each marking vessel were emptied into separate 2.5-liter (16.5 dia. × 14.5-cm tall) plastic containers (hi-plas, Highland Plastic, Inc., Mira Loma, CA), which were each immediately covered with a heavy sheet of glass. To sustain the whiteflies, all tubs contained a cotton leaf that had its stem inserted into a plastic floral water tube containing a plant nutrient solution. The tubs were held in the laboratory at 27°C, 12:12 L:D, and 30% RH for 24 h. After 24 h, whitefly mortality was assessed for the various SmartWater and water-marked treatments. The dead whiteflies were separated from the living whiteflies, and then the living specimens were killed by snap freezing in a −60°C freezer.
Differences in the proportional survival rate for the whiteflies exposed to the various SmartWater and water-mark time treatments were determined by the z-statistic proportions test (SigmaStat, Ver. 2.03, SPSS Inc., Chicago, IL). Yate’s correction for continuity was applied to each z-statistic calculation (Glantz 1997).
Qualitative Evaluation
Four observers examined whiteflies for the presence of the fluorophore by visual inspection of the photograph taken of each microplate, as described above. This trial was repeated twice, and the homogeneous data yielded within the two marking treatments were pooled for analysis.
Quantitative Evaluation
The fluorophore was measured on the whitefly specimens using the method described in experiment 4. Again, each microplate included eight unmarked whiteflies. Each whitefly was scored positive for the fluorophore if its calculated TTM value exceeded the CTV generated by the unmarked specimens, as in experiment 4. This trial was repeated twice, and the data yielded between the replications were not significantly different. Therefore, these data were pooled for analysis. A linear regression analysis was conducted to assess whether the volume of SmartWater, as a function of the time the whiteflies were exposed to the marking treatment, predicted the TTM value.
Results
First Experiment
Insect Survivorship
The L. hesperus, regardless of mark treatment, had a steep decline in survivorship by the third day of the study (Table 1). Consequently, the retention study ended after only seven days due to the lack of living specimens. On the other hand, the survivorship of H. convergens was at or nearly 100% for both mark treatments throughout the study (Table 1).
Percent survival and detection of the fluorophore on Lygus hesperus and Hippodamia convergens marked with SmartWater or water
| Insect | Days after marking | SmartWater | Water | ||||||
|---|---|---|---|---|---|---|---|---|---|
| No. recovered | No. alive | % survival | % marked | No. recovered | No. alive | % survival | % marked | ||
| Lygus hesperus | 0 | 30 | 30 | 100.0 | 100.0 | 30 | 30 | 100.0 | 0.0 |
| 1 | 30 | 29 | 96.7 | 100.0 | 28 | 26 | 92.9 | 0.0 | |
| 3 | 29 | 20 | 69.0 | 100.0 | 24 | 15 | 62.5 | 0.0 | |
| 5 | 30 | 13 | 43.3 | 100.0 | 24 | 9 | 37.5 | 0.0 | |
| 7 | 17 | 1 | 5.9 | 100.0 | 28 | 9 | 32.1 | 0.0 | |
| Total | 136 | 93 | 68.4 | 100.0 | 134 | 89 | 66.4 | 0.0 | |
| Hippodamia convergens | 0 | 30 | 30 | 100.0 | 80.0 | 30 | 30 | 100.0 | 10.0 |
| 1 | 30 | 30 | 100.0 | 93.3 | 30 | 30 | 100.0 | 0.0 | |
| 3 | 30 | 30 | 100.0 | 80.0 | 30 | 30 | 100.0 | 3.3 | |
| 5 | 26 | 26 | 100.0 | 73.1 | 30 | 29 | 96.7 | 3.5 | |
| 7 | 30 | 30 | 100.0 | 86.7 | 30 | 30 | 100.0 | 0.0 | |
| 9 | 30 | 29 | 96.7 | 82.8 | 30 | 30 | 100.0 | 0.0 | |
| 11 | 23 | 23 | 100.0 | 78.3 | 22 | 21 | 95.5 | 4.8 | |
| 13 | 30 | 27 | 90.0 | 66.7 | 30 | 28 | 93.3 | 0.0 | |
| Total | 229 | 225 | 98.3 | 80.4 | 232 | 228 | 98.3 | 2.6 |
Qualitative Evaluation
The SmartWater fluorophore was easily detected by visual observation on the lygus bugs over the seven-day duration of the study (Table 1). Notably, the fluorophore was apparent at first glimpse under UV light (Fig. 1). Conversely, no fluorescence was observed on the water-marked lygus bugs (Table 1). In short, there were no false-negative or false-positive classifications for lygus bugs. Overall, the fluorophore was detected on 80.4% of the SmartWater-marked H. convergens (Table 1). However, the mark was not readily apparent at first glimpse under UV light (Fig. 1C and 1D) on many of the specimens. As such, those specimens had to be thoroughly inspected for the presence of minute traces of the mark. Detectable fluorescence (autofluorescence) was detected on <3% of the water-marked beetles.
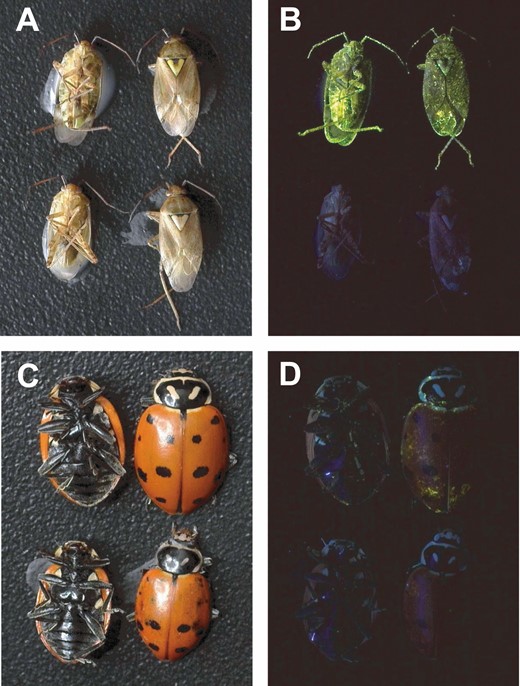
Lygus hesperus (A and B) and Hippodamia convergens (C and D) specimens marked with either SmartWater (top two specimens in each picture) or water (bottom two specimens in each picture) photographed under white light (A and C) or 365 nm ultraviolet light (B and D).
Quantitative Evaluation
The microplate fluorometer recorded a high RFU value on every L. hesperus specimen (Fig. 2A). Moreover, the fluorometer did not detect fluorescence on any of the water-marked lygus bugs. The fluorescence on the SmartWater-marked H. convergens was less remarkable (Fig. 2B). Specifically, 93% of these specimens scored positive for the presence of the fluorophore immediately after marking, but there was a sharp decline in detectability by the next day. Beyond three days, the mark was recorded on only about 25% of the lady beetle specimens. Overall, fluorescence was recorded on 2.2% of the water-marked beetles.
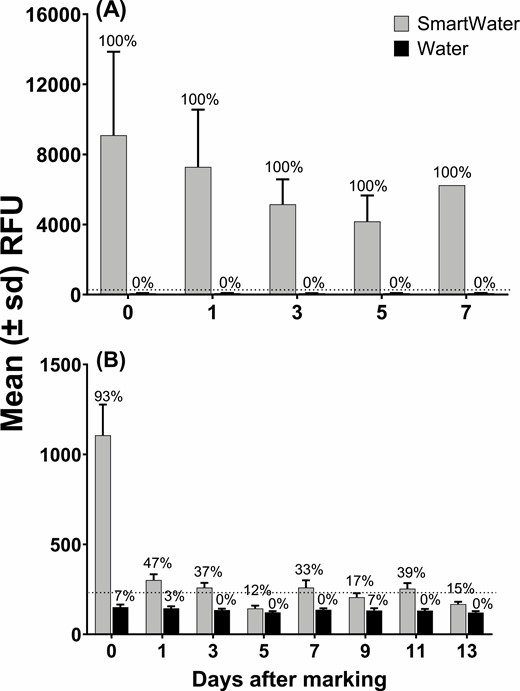
Mean (±SD) relative fluorescence units (RFU) emitted by L. hesperus (A) and H. convergens (B) marked with SmartWater or water. The dotted horizontal line depicts the calculated critical threshold value of 278 and 236 yielded by the unmarked L. hesperus and H. convergens specimens. The value above each bar is the percentage of individuals scoring positive for the presence of the fluorophore. The sample sizes are given in the number alive column in Table 1.
Second Experiment
Insect Survivorship
Lygus bug survival was much higher than in the first experiment (Table 2). Overall, the survivorship was 91.8 and 86.1% for SmartWater and water-marked specimens, respectively.
Percent survival and detection of the fluorophore on Lygus hesperus marked with SmartWater or water
| Days after marking | SmartWater | Water | ||||||
|---|---|---|---|---|---|---|---|---|
| No. recovered | No. alive | % survival | % marked | No. recovered | No. alive | % survival | % marked | |
| 0 | 24 | 24 | 100.0 | 100.0 | 22 | 22 | 100.0 | 0.0 |
| 1 | 20 | 20 | 100.0 | 100.0 | 20 | 20 | 100.0 | 0.0 |
| 3 | 20 | 19 | 95.0 | 100.0 | 20 | 20 | 100.0 | 0.0 |
| 5 | 25 | 23 | 92.0 | 100.0 | 25 | 20 | 80.0 | 0.0 |
| 7 | 20 | 18 | 90.0 | 100.0 | 20 | 17 | 85.0 | 0.0 |
| 9 | 20 | 20 | 100.0 | 100.0 | 20 | 17 | 85.0 | 0.0 |
| 11 | 19 | 17 | 89.5 | 100.0 | 19 | 14 | 73.7 | 0.0 |
| 13 | 35 | 27 | 77.1 | 100.0 | 27 | 19 | 70.4 | 0.0 |
| Totals | 183 | 168 | 91.8 | 100.0 | 173 | 149 | 86.1 | 0.0 |
Qualitative Evaluation
The visual inspection of the L. hesperus samples yielded similar results as the first experiment. Specifically, the fluorophore was easily detected on every SmartWater-marked bug and not on any water-marked specimens (Table 2).
Quantitative Evaluation
As previously observed, the SmartWater-marked L. hesperus produced remarkably high RFU values (Fig. 3). The vast majority (96%, n = 168) of the SmartWater-marked individuals contained detectable amounts of the fluorophore throughout the study. Conversely, fluorescence was only detected on three (2.0%; n = 149) of the water-marked specimens.

Mean (±SD) relative fluorescence units (RFU) emitted by L. hesperus marked with either SmartWater or water. The dotted horizontal line depicts the calculated critical threshold value of 170 RFUs yielded by the unmarked specimens. The value above each bar is the percentage of specimens scoring positive for the presence of the fluorophore. The sample sizes are given in the number alive column in Table 2.
Third Experiment
Qualitative Evaluation
The four observers detected the fluorophore on every adult lygus bug marked with SmartWater that was contained in the crowded arenas (Table 3). However, when looking for evidence of contact transfer, there were differences among the observers when subjectively scoring the unmarked nymphs in the crowded arenas. The false-positive error rates ranged from 2 to 46% among the observers (Table 3). There were false-negative rates ranging from 5 to 19% recorded among observers scoring the SmartWater-marked lygus bug nymphs enclosed in the crowded arenas (Table 3). The false-positive rates recorded for the unmarked adults in the crowded arenas ranged from 1 to 5%.
The visual detection efficiency of the SmartWater fluorophore on Lygus hesperus adults and nymphs subjected to three different research scenarios
| Research scenario | Arena population | Insect treatment | No. collected | % expected to score positive | % scoring positive | |||
|---|---|---|---|---|---|---|---|---|
| Observer 1 | Observer 2 | Observer 3 | Observer 4 | |||||
| 1 | Crowded | Marked adult | 63 | 100 | 100 | 100 | 100 | 100 |
| Unmarked nymph | 95 | 0 | 2 | 43 | 46 | 12 | ||
| 2 | Crowded | Marked nymph | 62 | 100 | 81 | 84 | 95 | 84 |
| Unmarked adult | 98 | 0 | 2 | 1 | 2 | 5 | ||
| 3 | Uncrowded | Marked adult | 60 | 100 | 100 | 100 | 100 | 100 |
| Unmarked nymph | 60 | 0 | 0 | 8 | 36 | 5 |
The insects were scored independently by four different observers for the presence of the mark.
In uncrowded arenas, all four observers detected the fluorophore on all the SmartWater-marked adults (Table 3). Again, there was inconsistency among observers on the scoring of the unmarked nymphs. The false-positive error rate ranged from 0 to 36% among observers (Table 3).
Quantitative Evaluation
The L. hesperus specimens marked with SmartWater, regardless of which type of holding arena they were exposed to (i.e., crowded or uncrowded), yielded RFUs 5–12 times higher than their unmarked counterparts (Fig. 4). The false-negative rates ranged from 0 (marked adults in crowded and uncrowded arenas) to 16% (marked nymphs in crowded arenas). The false-positive rates ranged from 0 (unmarked nymphs in uncrowded arenas) to 9.5% (unmarked nymphs in crowded arenas).
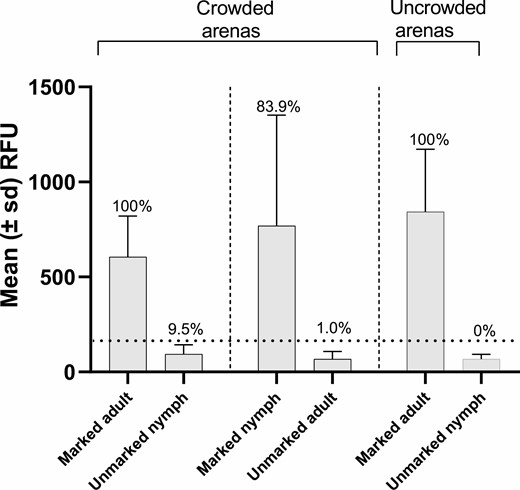
Mean (±SD) relative fluorescence units (RFU) emitted by marked and unmarked L. hesperus contained in crowded or uncrowded arenas. The dotted horizontal line depicts the calculated critical threshold value of 173 RFUs yielded by the unmarked specimens. The value above each bar is the percentage of specimens scoring positive for the presence of the fluorophore. The sample sizes are given in the number collected column in Table 3.
Fourth Experiment
Qualitative Evaluation
The fluorophore was detectable at a first glimpse under UV light on most of the SmartWater-marked whiteflies over the entire duration of the study (Table 4; Fig. 5A and 5B), although false-negative rates tended to increase over time. The rate of false-positives on water-marked whiteflies was typically <5%.
The visual detection efficiency of the fluorophore on Bemisia tabaci adults marked with SmartWater or water
| Mark treatment | Days after marking | No. collected | % expected to score positive | % scoring positive | |||
|---|---|---|---|---|---|---|---|
| Observer 1 | Observer 2 | Observer 3 | Observer 4 | ||||
| SmartWater | 0 | 48 | 100 | 100 | 100 | 100 | 100 |
| 2 | 42 | 100 | 93 | 90 | 93 | 98 | |
| 4 | 23 | 100 | 100 | 100 | 100 | 100 | |
| 6 | 20 | 100 | 70 | 65 | 90 | 90 | |
| 8 | 16 | 100 | 100 | 100 | 94 | 100 | |
| 10 | 26 | 100 | 92 | 88 | 88 | 88 | |
| 12 | 20 | 100 | 75 | 70 | 80 | 80 | |
| 14 | 15 | 100 | 67 | 67 | 67 | 67 | |
| 16 | 16 | 100 | 88 | 88 | 88 | 88 | |
| Water | 0 | 48 | 0 | 0 | 2 | 15 | 2 |
| 2 | 66 | 0 | 0 | 5 | 5 | 2 | |
| 4 | 63 | 0 | 2 | 0 | 3 | 0 | |
| 6 | 44 | 0 | 0 | 0 | 5 | 0 | |
| 8 | 37 | 0 | 0 | 0 | 0 | 0 | |
| 10 | 29 | 0 | 0 | 0 | 0 | 0 | |
| 12 | 33 | 0 | 0 | 0 | 3 | 0 | |
| 14 | 25 | 0 | 4 | 0 | 0 | 0 | |
| 16 | 29 | 0 | 0 | 0 | 0 | 0 |
The insects were scored independently by four different observers for the presence of the mark.
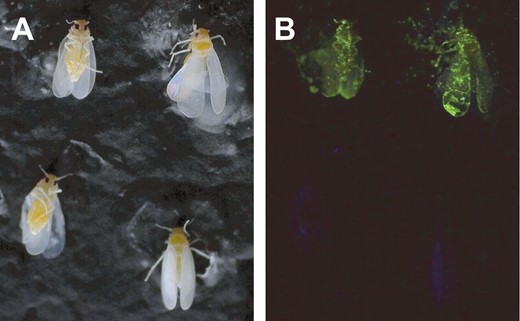
Bemisia tabaci specimens marked with either SmartWater (top two specimens in each picture) or water (bottom two specimens in each picture) and photographed under normal (A) and 365 nm ultraviolet light (B).
Quantitative Evaluation
On average, the RFU values yielded by the SmartWater-marked B. tabaci were 62 (at day 0) to 20 (at day 12) times greater than their water-marked counterparts (Fig. 6). However, there was a relatively high frequency (i.e., 15–20%) of false negatives, especially in the second week. Microplate fluorometer readings scored positive for only five of the 374 water-marked whitefly specimens (0.8% positive rate).
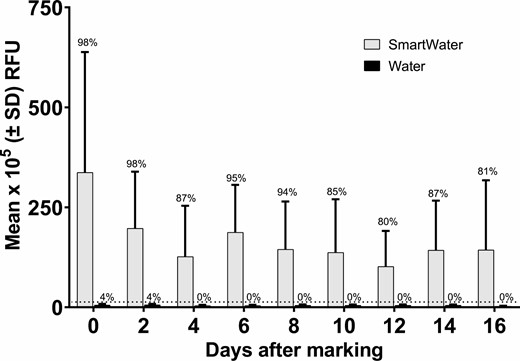
Mean (±SD) relative fluorescence units (RFU) emitted by B. tabaci marked with SmartWater or water. The dotted horizontal line depicts the calculated critical threshold value of 12.0 × 10⁵ RFUs yielded by the unmarked specimens. The number above each bar is the percentage of individuals containing the fluorophore. The sample sizes are given in the number collected column in Table 4.
Fifth Experiment
Survivorship
There were no significant differences in whitefly survival between the SmartWater and water mark treatments with the 10, 20, and 60 s mark duration treatments (Fig. 7). However, there was significantly less survivorship for the whiteflies exposed to the 30-s mark duration treatment (z test = 2.1; p = 0.04).
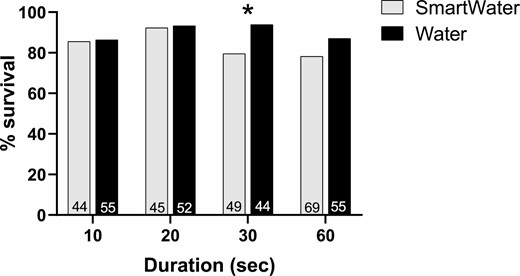
Percent survival for Bemisia tabaci adults marked continuously with either SmartWater or water for 10, 20, 30, or 60 s. The sample sizes are given above the x-axis for each treatment.
Qualitative Evaluation
The fluorophore was detected at the first glimpse on most of the whiteflies marked with SmartWater. However, the rate of false negatives recorded often exceeded 10%. Moreover, the false-negative and false-positive error rates widely varied among the four observers. In general, the frequencies of false-negative scoring errors decreased as the mark duration increased (Table 5). There were also numerous false positive errors (up to 17%) recorded by the observers for the whiteflies marked with water. Again, these error rates varied among the observers.
The visual detection efficiency of the fluorophore on Bemisia tabaci adults marked with SmartWater or water
| Mark treatment | Mark duration (s) | No. collected | No. expected to be marked | % scoring positive | |||
|---|---|---|---|---|---|---|---|
| Observer 1 | Observer 2 | Observer 3 | Observer 4 | ||||
| SmartWater | 10 | 47 | 100 | 81 | 87 | 96 | 96 |
| 20 | 46 | 100 | 85 | 89 | 96 | 96 | |
| 30 | 32 | 100 | 97 | 94 | 100 | 97 | |
| 60 | 38 | 100 | 92 | 92 | 95 | 95 | |
| Water | 10 | 36 | 0 | 6 | 6 | 17 | 8 |
| 20 | 41 | 0 | 10 | 10 | 15 | 12 | |
| 30 | 46 | 0 | 0 | 0 | 7 | 9 | |
| 60 | 60 | 0 | 0 | 0 | 12 | 7 |
The insects were scored independently by four different observers for the presence of the mark.
Quantitative Evaluation
The RFU values yielded by the SmartWater-marked whiteflies were five (at 10 s) to 30 (at 60 s) times greater than those yielded by their water-marked counterparts (Fig. 8). The linear regression analyses yielded for the average RFU values obtained for SmartWater marked specimens were poorly correlated with the length of time spent marking the specimens (RFU value = 2.12 + 1.22 (time); R2 = 0.15).
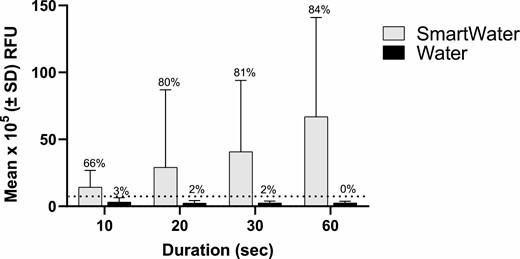
Mean (±SD) relative fluorescence units (RFU) emitted by B. tabaci marked with SmartWater or water. The dotted horizontal line depicts the calculated critical threshold value of 7.1 × 10⁵ RFUs yielded by the unmarked specimens. The number above each bar is the percentage of individuals positive for the fluorophore. The sample sizes are given in the number collected column in Table 5.
Discussion
As applied to the insects in our study, SmartWater was confirmed as displaying many of the key attributes of proven markers (e.g., fluorescent dusts, dyes, and paints). Specifically, it is inexpensive, easy to apply, and easy to detect by direct observation (i.e., qualitatively evaluated). In addition, this fluorophore was detectable at the first glimpse on two of the three insect species examined, which does not always hold true for the proven markers, where the marked specimens must sometimes be thoroughly examined for tiny traces of the marker (personal observation). In addition, the presence of the SmartWater fluorophore can be readily measured with a microplate fluorometer (i.e., quantitatively evaluate).
We conducted our investigation in a stepwise, iterative manner, with each step built on findings from those previous studies. The first study was a pilot test to determine the feasibility of marking lygus bugs and lady beetles with SmartWater. The fluorophore readily adhered to lygus, but did not adhere as well to the lady beetle cuticle. This was surprising since H. convergens have proven easy to mark with other previously used methods (Davidson 1924, Nakamura and Ohgushi 1979). We are currently conducting follow-up studies to determine the marking efficiency of SmartWater on dozens of other arthropod species and changes to the marking technique to increase the marking efficiency of SmartWater on H. convergens. As ever, preliminary pilot tests remain important in marking research to confirm the viability of a given mark for the desired target. There were a small number of false positives (for H. convergens only) in this study and all our subsequent experiments. This was most likely because many arthropod species are likely to emit a small level of autofluorescence when exposed to UV light. We presume that autofluorescence is the cause of the false positives in those experiments where water-marked insects had no contact with SmartWater-contaminated insects or equipment (i.e., all studies except experiment 3). In some cases, this autofluorescence is bright enough to interfere with the precise identification of the fluorophore mark. Evaluation via fluorometer mitigated some, but not all, of this problem, as discussed below.
The second study consisted of modifying the marking protocol to reduce lygus bug mortality. In the pilot test, both the SmartWater and water mark affected lygus survivorship. We attributed the high mortality rates to either the poor vigor of the laboratory-reared specimens or the methods we used to administer the mark treatments. To account for the latter possibility, we tested a new procedure using a different spray apparatus (nebulizer) that provided a finer, less forceful mist, in conjunction with a different marking container allowing for pass-through spray flow instead of the accumulation of the mark in the container. The nebulizer also required about 66% less marking solution than the airbrush sprayer to achieve the same marking efficiency. The nebulizer protocol maintained the 100% initial mark efficiency shown with the airbrush method while yielding an overall survivorship rate of over 95% for 11 days after the lygus bugs were marked. This dramatic improvement led us to use the nebulizer method exclusively in all subsequent studies.
The third study examined the chances for the fluorophore transferring from a marked to an unmarked lygus bug. High incidences of mark transfer from marked to unmarked specimens (false positives) would result in erroneous estimates of the dispersal capability of the target arthropod. The most likely source for a mark contamination error during a mark-release-capture experiment would be during the collection and handling of the captured specimens (Harwood 2008, Greenstone et al. 2011, Hagler et al. 2015). That is, the chance for contact exposure between marked and unmarked individuals would be greatest in sweep nets, vacuum nets, pitfall traps, etc.
Quantitative results showed a relatively high rate of lateral transfer of the fluorophore from SmartWater marked adults to unmarked nymphs (9.5%) in the crowded arenas. However, mark contamination errors were ≤1% for all the other research scenarios examined. The direct observations by the four observers for the presence of the mark yielded variable results. Observer accuracy was high for adult lygus; all four observers had perfect proficiency in correctly identifying marked adults in both the crowded and uncrowded research scenarios. Likewise, the false-positive rate was low for the water-marked adults. However, there were high false negative and false positive rates recorded among the observers for the SmartWater and water-marked treatments in the case of nymphs, respectively. We attributed these differences to a combination of the lateral transfer of the fluorophore from marked to unmarked individuals (i.e., cross-contamination) and human error that is often associated with subjective analyses. We conclude that the chance of obtaining false negative and false positive scoring errors for the presence of the fluorophore under field conditions would be minimal using the quantitative method of assessment.
The fourth experiment was designed to determine the feasibility of using SmartWater to mark B. tabaci, a relatively small and delicate insect. The mark adhered extremely well to the whiteflies, being easy to discern visually and using the fluorometer. However, false-negative rates for both observer scores and fluorometer readings tended to increase as the time after marking increased, suggesting a decrease in the temporal stability of the mark. Nonetheless, the mark was detected on most of the whiteflies over the 13-d duration of the study; we expect refinements in technique could increase the long-term reliability of the mark.
The adult whiteflies occasionally had bright spots that were interpreted as high RFU areas, such that, using our initial scoring system, the microplate reader generated higher rates of false positives than human evaluators. Whitefly autofluorescence is not evenly distributed across the body of the insect, as opposed to the nebulizer-applied mark, which is typically presented as a uniform glow. We accounted for this fact by changing our evaluation metric from a maximum point reading, which is biased toward a single high-intensity point and, therefore, prone to autofluorescence-related error. Instead, we used the average value of the top three readings for each specimen (top three mean or TTM), which is biased toward widespread fluorescence and had much-reduced levels of false-positive error. TTM was used instead of the maximum reading to mitigate against arbitrary differences in whitefly surface area influencing the results. When using TTM, water-marked whiteflies yielded very few (<1%) false-positive responses. Future studies could also attempt to choose a color of SmartWater whose reading wavelengths overlap less with the target insect’s natural autofluorescence.
The other major challenge presented in marking whiteflies with SmartWater is reliably detecting the mark on the tiny insect. Qualitative evaluations suffered from high rates of false negatives, which we attribute in part to the fact that the human evaluators scored a static photograph of each plate, a suboptimal workaround necessitated by social distancing requirements set forth due to the COVID-19 pandemic. The microplate reader was programmed to take 21 dorsal and 21 ventral scans of each well, which was satisfactory on intact whiteflies, but which was still liable to ‘miss’ if the whiteflies were damaged during transfer to the microplate. A dedicated whitefly marking study should consider an increased number of scans to cover even more surface area of the well of the microplate. Alternatively, a different handling protocol (e.g., an insect aspirator) could be used to ensure all specimens remain fully intact. Despite the error rates reported here, we conclude that SmartWater would be an effective mark for a whitefly mark-release-recapture type experiment.
The fifth study was designed to assess the efficacy of marking whiteflies with various volumes of SmartWater, as determined by the length of time being marked. The goal was to find the minimal amount of marking solution needed to effectively mark the specimens while reducing the mortality associated with administering the mark. The data revealed a weak correlation in marking efficiency with the time used to mark the specimens. Ultimately, the 60-s application treatment of SmartWater yielded the highest RFUs without causing a significant increase in whitefly mortality.
An important takeaway from our research is that fluorescence microplate readers are viable tools for measuring this fluorophore. Quantitative methods for mark detection are invaluable, as they can provide an avenue for a nonbiased assessment of the presence of the mark, ultimately reducing the chances for human errors associated with the subjective scoring of samples by direct observation. Unlike other common quantitative mark evaluations (i.e., the detection of protein marks), the detection of a fluorophore by spectrofluorometry does not require an assay and is nondestructive. Therefore, the automated reader can measure 96 sorted specimens for the presence of the fluorophore in less than 10 min without further preparation or materials, and the insect specimens themselves are conserved.
Fluorometers report the intensity of fluorescence in RFUs, which is a unitless measurement in reference to baseline readings taken by the machine (rather than an objective measure such as the lumen). Because of differences in the design and construction of each reader and differences in software that calculate the results, the RFU measurement of a sample should be expected to differ between machines. By chance, we had the opportunity to compare two microplate readers’ performance. While both were equally suitable for comparing marked and unmarked specimens, the average raw RFU numbers given between the two instruments were different. The relative nature of the measurement also means it is safest to make direct comparisons in RFU value only between samples on the same microplate during the same reading. Thus, it is essential to include controls on each individual microplate. Again, due to chance, supply-chain issues led to us testing both clear microplates and black-walled, clear-bottom microplates. Both are suitable for this type of study, so long as the plate type remains consistent for a given group.
One of the key advertised features of SmartWater, not investigated here, is that thousands of unique formulas are available, accomplished by coding each SmartWater fluorescent mixture with a unique molecular signature that the company’s forensic team can identify. In theory, individual specimens or groups of specimens could be labeled with a distinct mark. Then, any recaptured specimen containing the fluorophore could be sent to the company for them to identify the specific nano-mark using their proprietary methodology. This feature could be useful for studies requiring several distinctive marks. A recent proof-of-concept laboratory study reported using DNA tags incorporated into the SmartWater marking mixture for marking mosquitoes (Faiman et al. 2021). The investigators of that study proposed that the method could be used to mass screen field-collected mosquitoes for the fluorophore, followed by analyzing positive specimens via PCR to detect the unique DNA tag. This is an area that deserves further investigation.
The SmartWater marking technique, as described here, shows that the method is well suited for mark-release-recapture type research. The marking method also has the potential for use for self-marking type studies, particularly studies involving social insects. Specifically, a marking device could be strategically placed at the entrance of a nest or at a bait station. Such methods have been used successfully for self-marking studies using protein marks (Buczkowski et al. 2007, Buczkowski and Bennett 2009, Song et al. 2015). Another area for future research would be to determine the feasibility of using SmartWater as a nonlethal mark-release-recapture marking technique. Faiman et al. (2021) verified that field-collected mosquitoes could be captured and evaluated in the field (i.e., under handheld UV light by a human observer) without killing the mosquito; it seems plausible that other arthropods could be handled similarly. A nonlethal marking protocol would benefit dispersal studies involving rare or valuable arthropod species, such as non-Apis bee species (Boyle et al. 2018) or other pollinators.
In summary, our study shows that SmartWater has potential as an additional method in the arthropod-marking toolbox. The product can serve as an external mark for several arthropods targeted for mark-release-recapture type research, with the caveat that, as with any marker, it will not be optimal in all circumstances. We found that SmartWater may be a viable solution to mark B. tabaci, a fragile insect that is difficult to mark with other techniques. The marking procedure is simple, inexpensive, rapid, and environmentally safe. Moreover, the detection for the presence of the mark on an arthropod does not require sample preparation or an assay. The fluorophore can be detected by direct observation or measured with a fluorometer. For the insects examined in this study, we recommend using a microplate fluorometer, if possible, to eliminate the subjective nature of visually detecting the fluorophore. Unfortunately, a multiple wavelength microplate fluorometer is expensive. However, fluorescence spectrometry is commonly used in various cellular and molecular techniques, so many laboratories may already have access to this equipment or be affiliated with one which does. It should be noted, however, that in follow-up studies on a wide variety of other arthropod species, that the fluorometer was not as effective at detecting the mark as by visual observation (In Preparation). Future studies are needed to test SmartWater on other arthropod species and test the steadfastness of the mark under open field conditions.
Acknowledgments
A special thank you goes to Amelia Palechek for her excellent technical assistance. We thank SmartWater CSI, LLC, for providing the materials used in this study. This article reports the results of the research only. Mention of a proprietary product does not imply endorsement or recommendation for its use by USDA.
Author Contributions
J.R.H.: conceptualization; experimental design, data curation; data analysis; resources; supervision; visualization; writing original draft. A.M.H.: data curation; investigation; methodology; data acquisition; editing original draft. M.T.C.: data curation; investigation; methodology; data acquisition; editing original draft. SAM: data curation; investigation; methodology; data acquisition; editing original draft.
