


Abstract
The mitochondrial genome sequences of Denierella emmerichi, Epicauta curvispina, and Meloe poggii were determined. Their mitochondrial genomes were found to contain 37 genes (13 protein-coding genes [PCGs], 22 tRNA genes, and 2 rRNAs), of which 4 PCGs, 8 tRNA genes, and 2 rRNAs are encoded by the N-strand, and the remaining genes are encoded by the J-strand. The mitochondrial genomes of D. emmerichi, E. curvispina, and M. poggii are 15,702 bp, 15,813 bp, and 15,626 bp in length, respectively, and their guanine–cytosine contents are 28%, 33%, and 36%, respectively. The 13 PCGs of D. emmerichi, E. curvispina, and M. poggii use ATN as the standard start codon and TAA, TAG, and T as the stop codons. The Bayesian inference and maximum likelihood phylogenetic analysis results based on the 13 PCGs and 13 PCGs + 2rRNAs datasets of the mitochondrial genomes of the Meloidae support Epicauta (Coleoptera: Meloidae) ([D. emmerichi, E. curvispina, E. ruficeps, E. aptera] + [E. chinensis, E. impressicornis, E. gorhami, E. tibialis]). We believe that this research enriches the literature on the mitochondrial genomics of Meloidae and serves as a foundation for the further study of the phylogenetic relationships and characterization of Meloidae and Coleoptera.
Meloidae (Coleoptera: Tenebrionoidea) is a medium-sized family that contains approximately 125 genera comprising more than 3,000 species (Du et al. 2016; Bologna et al. 2008). Blister beetles, which belong to this family, secrete cantharidin, which is a sesquiterpene substance with important medicinal value that has been used in traditional Chinese medicine (Liu et al. 2018, 2020). Studies on blister beetles have primarily focused on their morphological taxonomy (Bologna et al. 2008; Bologna and Pinto 2002; Yang and Ren 2007; Batelka and Hájek 2015; Pan and Ren 2018; Li et al. 2020) and ecology (Liu et al. 2018; Shintani et al. 2010; Terao et al. 2012; Terao et al. 2015; Okano et al. 2015; Shintani et al. 2017). However, some blister beetles have very similar morphologies, and it is difficult to distinguish them using traditional methods.
In recent years, mitochondrial genomics has been applied to study blister beetles (Du et al. 2016, 2017; Liu et al. 2020). The animal mitochondrial genome has become an important molecular marker in population and evolutionary biology because of many features that can be used to distinguish similarities or dissimilarities among species, including stable gene composition, relatively conservative gene arrangement, general maternal inheritance, and, rarely, recombination (Wolstenholme 1992). The mitochondrial genome has been widely used in studies of mitochondrial genome evolution, phylogenetic inference, species origin identification, gene drift, biogeography, population structure, dynamic analysis, molecular evolution, etc. (Avise 1994; Zhang and Hewitt 1997; Du et al. 2016; Liu et al. 2020). The mitochondrial genome of insects is a double-stranded closed-loop molecule containing 37 genes (13 protein-coding genes [PCGs], 22 transfer RNA [tRNA] genes, and 2 ribosomal RNA [rRNA] genes, [rrnS and rrnL]) and a noncoding control region (Boore 1999). Therefore, mitochondrial genomics can be employed to explore the phylogenetic relationships between some populations of Meloidae and provide reference materials for the taxonomic study of blister beetles.
In this study, we sequenced, assembled, and annotated the mitochondrial genomes of three blister beetles and analyzed the basic structural characteristics of their genomes. Our findings supplement the literature on the mitochondrial genomics of Meloidae, contribute to the classification and identification of blister beetles, and are of great value in the study of the genetic and evolutionary biology of Meloidae.
Materials and Methods
Species Collection and Taxonomic Identification
Adult specimens of D. emmerichi and E. curvispina were collected from Taoyuan County (110.51°E, 28.24°N), Hunan Province, China, in June 2020; adult specimens of M. poggii were collected from Dȇgȇ County (99.29°E, 31.88°N), Sichuan Province, China, in September 2020. The specimens were soaked in anhydrous ethanol and stored at −80°C at the Institute of Entomology, Guizhou University, Guiyang, China. The specimens were identified based on morphological analysis (Yang and Ren 2007; Liu et al. 2016; Pan and Bologna 2021).
DNA Extraction and Sequencing
The abdomen of the specimens was removed; DNA was extracted using a Blood Genome DNA Extraction Kit (TaKaRa, Japan), and 1% agarose gel electrophoresis was performed. The integrity and purity of the DNA samples were determined using a Nanodrop spectrophotometer. Qualified DNA samples were sent to Berry Genomics (China) for sequencing. A single sample was independently built, and resequencing was performed using the Illumina NovaSeq 6000 sequencing platform with a 300-bp insert, sequencing mode set to 150 PE, data volume output of each sample ≥6 Gb, and average data quality of Q30 ≥85%.
Genome Assembly, Annotation, and Analysis
The assembly, preliminary annotation, and visualization of the mitochondrial genome were completed using MitoZ version 2.4 (Meng et al. 2019). The relative codon usage (RSCU) frequency and nucleotide composition of the mitochondrial genome were analyzed using PhyloSuite version 1.2.2 (Zhang et al. 2020). The graph of the RSCU frequency was constructed using the fmsb package in R 3.6.1. The locations and secondary structures of tRNA genes were predicted using the tRNAscan-SE search server (http://lowelab.ucsc.edu/tRNAscan-SE) and the MITOS web server (http://mitos.bioinf.uni-leipzig.de/index.py), with an invertebrate codon predictor (Lowe and Eddy 1997). The heat map of the guanine–cytosine (GC) content of different gene fragments among different species was constructed using TBtools (Chen et al. 2020).
Phylogenetic Analysis
Based on the complete mitochondrial genome sequence, the combined use of MEGA version 7.0.26 (Kumar et al. 2016) and SequenceMatrix version 1.7 (Vaidya et al. 2011) was employed to obtain the nucleotide sequences of the datasets 13 PCGs and 13 PCGs + 2 rRNAs. The best partition schemes and substitution models for the maximum likelihood (ML) and Bayesian inference (BI) analyses of the datasets were estimated using PartitionFinder version 2.1.1 (Lanfear et al. 2017) with the greedy algorithm. ML analyses were performed using IQ-Tree version 1.6.3 (Nguyen et al. 2015), with 1,000 replicates of ultrafast likelihood bootstrapping (Minh et al. 2013) to obtain node support values. BI analysis was performed using MrBayes version 3.2.6 (Huelsenbeck and Ronquist 2001) with the following conditions: independent substitution model for each partition; four Markov chains; two independent runs each for 1,000,000 generations; and sampling every 1,000th generation, with the first 25% discarded as burn-in. The resulting phylogenetic trees were viewed and edited using FigTree version 1.4.2 (Mousavi et al. 2014).
Results
Genome Organization and Composition
The mitochondrial genome of D. emmerichi (GenBank no. MW476521; length: 15,702 bp), E. curvispina (GenBank no. MW476523; length: 15,813 bp), and M. poggii (GenBank no. MW476520; length: 15,626 bp) is a double-stranded closed-loop molecule. The GC contents of the mitochondrial genome of D. emmerichi, E. curvispina, and M. poggii are 28, 33, and 36%, respectively (Fig. 1).
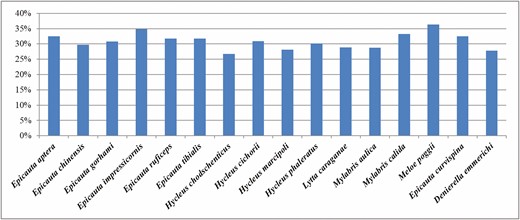
Guanine–cytosine contents of the mitochondrial genomes of different species.
There are 12 gene overlaps in the mitochondrial genome of D. emmerichi, ranging in size from 1 to 10 bp. The longest gene overlap is between ATP6 and ATP8, with a length of 10 bp; the shortest four-gene overlaps are between tRNA-Gln and tRNA-Met, between tRNA-Trp and tRNA-Cys, between ATP6 and COX3, and between ND6 and CYTB, each with a length of 1 bp. There are five gene intervals, the longest being 17 bp between tRNA-Ser (UCN) and ND1 and the shortest being 2 bp between ND4L and tRNA-Thr and between tRNA-Pro and ND6 (Table 2). The gene spacing and gene overlap between adjacent genes in the mitochondrial genome of E. curvispina are consistent with those of D. emmerichi, whereas those of M. poggii differ from those of E. curvispina (Table 2). There are 13 gene overlaps in the mitochondrial genome of M. poggii; the longest gene overlap is 10 bp between ATP6 and ATP8, and the shortest four-gene overlap is 1 bp, located between tRNA-Gln and tRNA-Met and between tRNA-Trp and tRNA-Trp (Table 2). There are six gene intervals between tRNA-Cys, ATP6, and COX3 and between ND6 and CYTB; the longest is 18 bp between tRNA-Met and ND2; the shortest is between tRNA-Cys and tRNA-Tyr and between ND4L and tRNA-Thr. The length between tRNA-Pro and ND6 is 2 bp (Table 2).
The mitochondrial genomes of D. emmerichi, E. curvispina, M. poggii, and other species of Meloidae (Du et al. 2016, 2017; Liu et al. 2020) contain 37 genes (13 PCGs, 22 tRNAs, and 2 rRNAs), of which 4 PCGs, 8 tRNA genes, and 2 rRNAs (12S rRNA and 16S rRNA) are encoded by the minor strand (N-strand), and the remaining are encoded by the major strand (J-strand; Fig. 2). On the basis of a comparison of the GC content between different gene segments of the known mitochondrial genome of the genus, it was concluded that the GC content of tRNA-Glu is the lowest among all segments, and the relatively highest content is COX1 (Fig. 3).
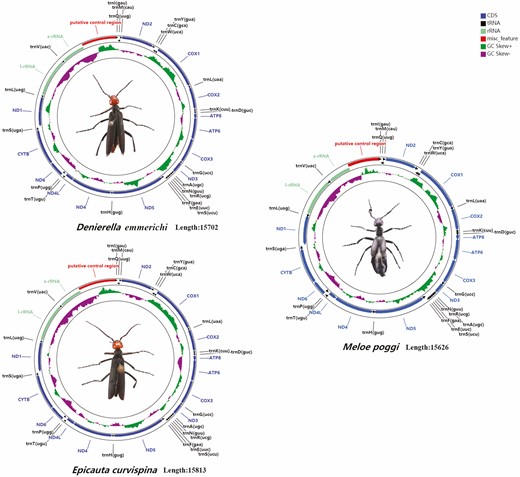
Gene map of the mitochondrial genomes of D. emmerichi, E. curvispina, and M. poggii. Gene abbreviations are as follows: COX1–3, cytochrome c oxidase subunits 1–3; ATP6 and ATP8, ATP synthase subunits 6 and 8; CYTB, cytochrome B; ND1–6 and ND4L, NADH dehydrogenase subunits 1–6 and 4 L.
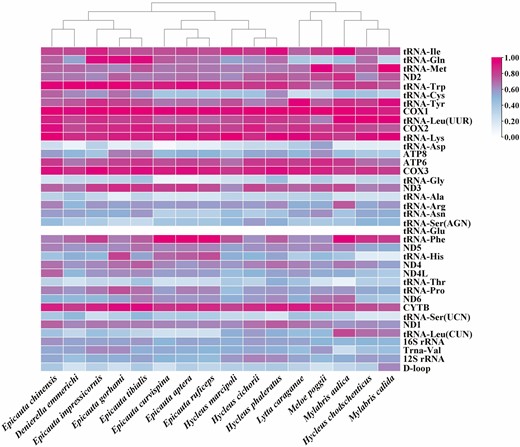
Guanine–cytosine contents of each gene fragment in different populations.
Protein-Coding Genes
Among the 13 PCGs of the mitochondrial genomes of D. emmerichi, E. curvispina, and M. poggii, 4 (ND1, ND4, ND4L, and ND5) are encoded on the J-strand and 9 (COX1, COX2, COX3, ATP6, ATP8, ND2, ND3, ND6, and CYTB) are encoded on the N-strand. The PCGs of D. emmerichi and E. curvispina are 11,121 bp in length, whereas those of M. poggii are 11,118 bp in length. The 13 PCGs of D. emmerichi, E. curvispina, and M. poggii all used ATN as the standard start codon and TAA, TAG, and T as the stop codons (Tables 1 and 2).
Direction, position, and length of each gene segment of the three mitochondrial genomes
| Gene | Strand | Location | Size (bp) | ||||||
|---|---|---|---|---|---|---|---|---|---|
| DS | EC | MG | DS | EC | MG | DS | EC | MG | |
| tRNA-Ile | + | + | + | 1–66 | 1–66 | 1–66 | 66 | 66 | 66 |
| tRNA-Gln | − | − | − | 64–132 | 64–132 | 64–132 | 69 | 69 | 69 |
| tRNA−Met | + | + | + | 132–200 | 132–200 | 132–200 | 69 | 69 | 69 |
| ND2 | + | + | + | 201–1214 | 201–1,214 | 219–1,214 | 1,014 | 1,014 | 996 |
| tRNA-Trp | + | + | + | 1,213–1,278 | 1,213–1,279 | 1,213–1,278 | 66 | 67 | 66 |
| tRNA-Cys | − | − | − | 1,278–1,341 | 1,279–1,342 | 1,278–1,340 | 64 | 64 | 63 |
| tRNA-Tyr | − | − | − | 1,346–1,409 | 1,347–1,410 | 1,343–1,407 | 64 | 64 | 65 |
| COX1 | + | + | + | 1,402–2,944 | 1,403–2,945 | 1,400–2,947 | 1,543 | 1,543 | 1,548 |
| tRNA-Leu(UUR) | + | + | + | 2,945–3,009 | 2,946–3,010 | 2,943–3,006 | 65 | 65 | 64 |
| COX2 | + | + | + | 3,010–3,697 | 3,011–3,698 | 3,007–3,694 | 688 | 688 | 688 |
| tRNA-Lys | + | + | + | 3,698–3,767 | 3,699–3,768 | 3,695–3,765 | 70 | 70 | 71 |
| tRNA-Asp | + | + | + | 3,768–3,832 | 3,769–3,833 | 3,766–3,830 | 65 | 65 | 65 |
| ATP8 | + | + | + | 3,842–3,994 | 3,843–3,995 | 3,831–3,992 | 153 | 153 | 162 |
| ATP6 | + | + | + | 3,985–4,656 | 3,986–4,657 | 3,983–4,654 | 672 | 672 | 672 |
| COX3 | + | + | + | 4,656–5,436 | 4,657–5,437 | 4,654–5,436 | 781 | 781 | 783 |
| tRNA-Gly | + | + | + | 5,437–5,499 | 5,438–5,500 | 5,440–5,502 | 63 | 63 | 63 |
| ND3 | + | + | + | 5,497–5,851 | 5,498–5,852 | 5,503–5,856 | 355 | 355 | 354 |
| tRNA-Ala | + | + | + | 5,852–5,916 | 5,853–5,917 | 5,855–5,917 | 65 | 65 | 63 |
| tRNA-Arg | + | + | + | 5,917–5,979 | 5,918–5,980 | 5,918–5,981 | 63 | 63 | 64 |
| tRNA-Asn | + | + | + | 5,980–6,044 | 5,981–6,045 | 5,982–6,048 | 65 | 65 | 67 |
| tRNA-Ser(AGN) | + | + | + | 6,045–6,101 | 6,046–6,102 | 6,049–6,106 | 57 | 57 | 58 |
| tRNA-Glu | + | + | + | 6,102–6,163 | 6,103–6,164 | 6,107–6,167 | 62 | 62 | 61 |
| tRNA-Phe | − | − | − | 6,162–6,224 | 6,163–6,225 | 6,166–6,229 | 63 | 63 | 64 |
| ND5 | − | − | − | 6,225–7,935 | 6,226–7,936 | 6,230–7,940 | 1,711 | 1,711 | 1,711 |
| tRNA-His | − | − | − | 7,936–7,999 | 7,937–8,000 | 7,941–8,004 | 64 | 64 | 64 |
| ND4 | − | − | − | 8,000–9,332 | 8,001–9,333 | 8,005–9,337 | 1,333 | 1,333 | 1,333 |
| ND4L | − | − | − | 9,326–9,613 | 9,327–9,614 | 9,331–9,618 | 288 | 288 | 288 |
| tRNA-Thr | + | + | + | 9,616–9,679 | 9,617–9,680 | 9,621–9,683 | 64 | 64 | 63 |
| tRNA-Pro | − | − | − | 9,680–9,741 | 9,681–9,743 | 9,684–9,746 | 62 | 63 | 63 |
| ND6 | + | + | + | 9,744–10,235 | 9,746–102,37 | 9,749–10,240 | 492 | 492 | 492 |
| CYTB | + | + | + | 10,235–11,374 | 10,237–11,376 | 10,240–11,379 | 1,140 | 1,140 | 1,140 |
| tRNA-Ser(UCN) | + | + | + | 11,373–11,439 | 11,375–11,441 | 11,378–11,445 | 67 | 67 | 68 |
| ND1 | − | − | − | 11,457–12,407 | 11,459–12,409 | 11,463–12,413 | 951 | 951 | 951 |
| tRNA-Leu(CUN) | − | − | − | 12,408–12,471 | 12,410–12,473 | 12,414–12,477 | 64 | 64 | 64 |
| 16S rRNA | − | − | − | 12,472–13,746 | 12,474–13,755 | 12,478–13,754 | 1,275 | 1,282 | 1,277 |
| tRNA-Val | − | − | − | 13,747–13,815 | 13,756–13,824 | 13,755–13,823 | 69 | 69 | 69 |
| 12S rRNA | − | − | − | 13,816–14,604 | 13,825–14,613 | 13,824–14,614 | 789 | 789 | 791 |
| D-loop | 14,605–15,702 | 14,614–15,813 | 14,615–15,626 | 1,098 | 1,200 | 1,012 |
In the column for intergenic length, a positive sign indicates the interval in base pairs between genes, whereas the negative sign indicates overlapping base pairs between genes.
Anticodons of tRNAs, start/stop codons of protein-coding genes, and intergenic nucleotides of the three mitochondrial genomes
| Gene | Anticodon | Start codon | Stop codon | Intergenic nucleotides | ||||||||
|---|---|---|---|---|---|---|---|---|---|---|---|---|
| DS | EC | MG | DS | EC | MG | DS | EC | MG | DS | EC | MG | |
| tRNA-Ile | GAT | GAT | GAT | |||||||||
| tRNA-Gln | TTG | TTG | TTG | −3 | −3 | −3 | ||||||
| tRNA-Met | CAT | CAT | CAT | −1 | −1 | −1 | ||||||
| ND2 | ATA | ATA | ATT | TAA | TAA | TAA | 18 | |||||
| tRNA-Trp | TCA | TCA | TCA | −2 | −2 | −2 | ||||||
| tRNA-Cys | GCA | GCA | GCA | −1 | −1 | −1 | ||||||
| tRNA-Tyr | GTA | GTA | GTA | 4 | 4 | 2 | ||||||
| COX1 | ATT | ATT | ATT | T | T | TAA | −8 | −8 | −8 | |||
| tRNA-Leu(UUR) | TAA | TAA | TAA | −5 | ||||||||
| COX2 | ATA | ATA | ATA | T | T | T | ||||||
| tRNA-Lys | CTT | CTT | CTT | |||||||||
| tRNA-Asp | GTC | GTC | GTC | |||||||||
| ATP8 | ATA | ATA | ATT | TAA | TAA | TAA | 9 | 9 | ||||
| ATP6 | ATG | ATG | ATG | TAA | TAA | TAA | −10 | −10 | −10 | |||
| COX3 | ATG | ATG | ATG | T | T | TAG | −1 | −1 | −1 | |||
| tRNA-Gly | TCC | TCC | TCC | 3 | ||||||||
| ND3 | ATA | ATA | ATG | T | T | TAG | −3 | −3 | ||||
| tRNA-Ala | TGC | TGC | TGC | −2 | ||||||||
| tRNA-Arg | TCG | TCG | TCG | |||||||||
| tRNA-Asn | GTT | GTT | GTT | |||||||||
| tRNA-Ser(AGN) | TCT | TCT | TCT | |||||||||
| tRNA-Glu | TTC | TTC | TTC | |||||||||
| tRNA-Phe | GAA | GAA | GAA | −2 | −2 | −2 | ||||||
| ND5 | ATA | ATT | ATT | T | T | T | ||||||
| tRNA-His | GTG | GTG | GTG | |||||||||
| ND4 | ATG | ATG | ATG | T | T | T | ||||||
| ND4L | ATG | ATG | ATG | TAA | TAA | TAA | −7 | −7 | −7 | |||
| tRNA-Thr | TGT | TGT | TGT | 2 | 2 | 2 | ||||||
| tRNA-Pro | TGG | TGG | TGG | |||||||||
| ND6 | ATT | ATT | ATT | TAA | TAA | TAA | 2 | 2 | 2 | |||
| CYTB | ATG | ATG | ATG | TAA | TAA | TAA | −1 | −1 | −1 | |||
| tRNA-Ser(UCN) | TGA | TGA | TGA | −2 | −2 | −2 | ||||||
| ND1 | ATT | ATT | ATT | TAG | TAG | TAG | 17 | 17 | 17 | |||
| tRNA-Leu(CUN) | TAG | TAG | TAG | |||||||||
| 16S rRNA | ||||||||||||
| tRNA-Val | TAC | TAC | TAC | |||||||||
| 12S rRNA | ||||||||||||
| D-loop |
In the column for intergenic length, a positive sign indicates the interval between base pairs of genes, whereas the negative sign indicates overlapping base pairs between genes.
The amino acid usage and relative codon usage rate of the mitochondrial genomic PCGs were determined using RSCU analysis, which showed that among the 13 PCGs of D. emmerichi, E. curvispina, and M. poggii, the most common amino acid was Ile and the relatively least common amino acid was Cys (Fig. 4). In D. emmerichi, the most frequently used amino acid codon was UUA, and the least used was CGC; in both E. curvispina and M. poggii, the most frequently used amino acid codon was UCU, and the least used was ACG (Fig. 5).
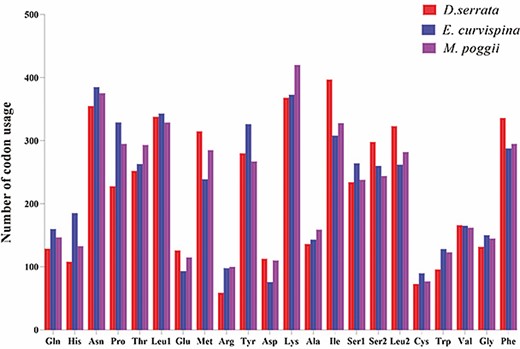
Number of codon usages in the protein-coding genes of the mitochondrial genomes of D. emmerichi, E. curvispina, and M. poggii. Each amino acid is denoted as a three-letter symbol according to the three-letter amino acid codes established by the International Union of Pure and Applied Chemistry and the International Union of Biochemistry and Molecular Biology joint commission.
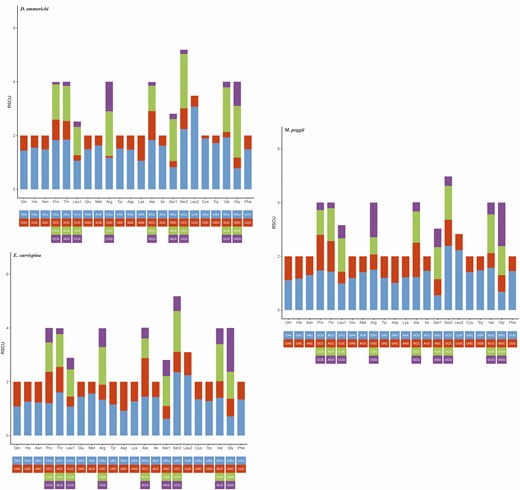
Relative synonymous codon usage in the protein-coding genes of the mitochondrial genomes of D. emmerichi, E. curvispina, and M. poggii.
Ribosomal RNA and Transfer RNA Genes
The mitochondrial genomes of D. emmerichi, E. curvispina, and M. poggii contain 22 typical tRNA genes, of which 14 are located on the J-strand and 8 are located on the N-strand (Table 1). The lengths of the tRNA genes of D. emmerichi and E. curvispina are between 57 (tRNA-Ser(AGN)) and 70 (tRNA-Lys) bp, whereas the lengths of the tRNA genes of M. poggii are between 58 (tRNA-Ser(AGN)) and 71 (tRNA-Lys) bp. The tRNA secondary structures of D. emmerichi, E. curvispina, and M. poggii were relatively conserved. Except for trnS1 (AGN), which loses the dihydrouridine arm, the other tRNAs can be folded into the classic clover secondary structure (Fig. 6).
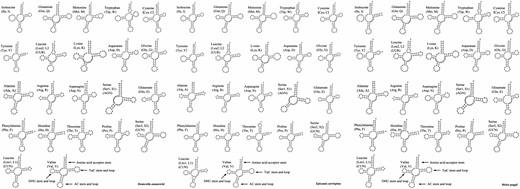
Secondary structure of the tRNAs of D. emmerichi, E. curvispina, and M. poggii mitochondrial genomes.
In D. emmerichi, the length of the 16S rRNA is 1,275 bp and its GC content is 26%, and the length of the 12S rRNA is 789 bp and its GC content is 23% (Table 1). In E. curvispina, the length of the 16S rRNA is 1,282 bp and its GC content is 28%, and the length of the 12S rRNA is 789 bp and its GC content is 28% (Table 1). In M. poggii, the length of the 16S rRNA is 1,277 bp and its GC content is 26%, and the length of the 12S rRNA is 791 bp and its GC content is 25% (Table 1).
Phylogenetic Analysis
Based on the 13 PCGs and 13 PCGs + 2 rRNAs datasets of the mitochondrial genomes of 16 species belonging to 5 genera of Meloidae, a molecular phylogenetic tree was constructed using BI and ML (Figs. 7 and 8). The results of the BI and ML trees constructed using the two datasets are not very different, and both support the intergeneric phylogenetic relationship of ([Epicauta (Denierella) + (Lytta + Meloe)] + Mylabris); in particular, the support rate of (Epicauta [Denierella]) is the highest (Bayesian posterior probability [BPP] = 1, bootstrap percentage [BP] = 100).
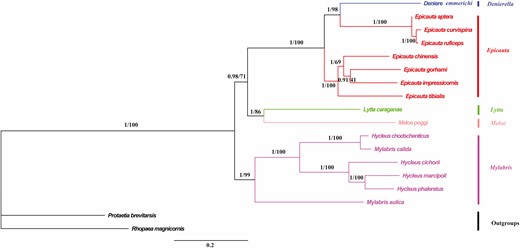
Phylogenetic trees of Meloidae inferred using MrBayes (Bayesian inference) and maximum likelihood analyses based on the nucleotide sequences of the 13 protein-coding genes. Bayesian posterior probabilities and bootstrap percentages are indicated on branches.
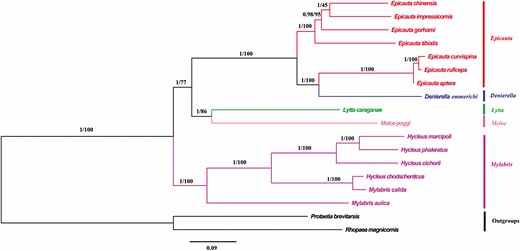
Phylogenetic trees of Meloidae inferred using MrBayes (Bayesian inference) and maximum likelihood analyses based on the nucleotide sequences of the 13 protein-coding genes + 2 rRNAs. Bayesian posterior probabilities and bootstrap percentages are indicated on branches.
Discussion
In this study, we determined the mitochondrial genome sequences of D. emmerichi, E. curvispina, and M. poggii and analyzed the structural characteristics of the mitochondrial genomes. We found that the GC content of the mitochondrial genome of M. poggii is the highest among the known mitochondrial genomes in Meloidae, which was 36% (Du et al. 2016, 2017; Liu et al. 2020; Fig. 4). The GC content of the mitochondrial genomes of D. emmerichi, E. curvispina, and M. poggii is lower than the AT content, which may be related to the frequency of amino acid codon usage in the mitochondrial genome. Among the known mitochondrial genomes of insects of Meloidae, the GC content differs among different gene segments is, although there is one common feature among different populations: the GC content of tRNA-Glu is the lowest, whereas the GC content of COX1 is relatively high. This finding will enrich further research on Meloidae mitochondrial genomics.
Denierella and Epicauta have very similar morphologies. The two genera only differ by the serration of the pretarsal claws in both sexes of Denierella (Batelka and Hájek 2015). However, a similar intrageneric variation in the claw structure exists in other large meloine genera (Lytta, Lydomorphus, Mylabris, etc.; Bologna and Pinto 2002). In the present study, the BI and ML trees that were constructed based on the 13 PCGs and 13 PCGs + 2 rRNAs datasets of the mitochondrial genomes of the Meloidae support Epicauta ([D. emmerichi, E. curvispina, E. ruficeps, E. aptera] + [E chinensis, E. impressicornis, E. gorhami, E. tibialis]), and the support rate is high (BPP = 1, BP = 100). Therefore, it is speculated that D. emmerichi belongs to the genus Epicauta, whereas E. curvispina, E. ruficeps, and E. aptera are closely related. As for the relationship between Denierella and Epicauta, further research and discussion are needed. Some researchers believe that Denierella is a subgenus of Epicauta (Bologna and Pinto 2002; Batelka and Hájek 2015; Pan and Ren 2020); the phylogenetic results in this study support this conclusion.
Acknowledgments
We sincerely appreciate the specimen collectors for their hard work in the field collections. Thanks to Dr. Pan Zhao from Hebei University for identifying the scientific name of blister beetles. This research was supported by National Natural Science Foundation of China (81460576), the Program of Science and Technology Innovation Talents Team, Guizhou Province, China (20144001), and the Program of Excellent Innovation Talents, Guizhou Province, China (20154021).
