


Abstract
Microbially produced lipids have attracted attention for their environmental benefits and commercial value. We have combined lipid pathway engineering in Saccharomyces cerevisiae yeast with bioprocess design to improve productivity and explore barriers to enhanced lipid production. Initially, individual gene expression was tested for impact on yeast growth and lipid production. Then, two base strains were prepared for enhanced lipid accumulation and stabilization steps by combining DGAT1, ΔTgl3 with or without Atclo1, which increased lipid content ~ 1.8-fold but reduced cell viability. Next, fatty acid (FA) biosynthesis genes Ald6-SEACSL641P alone or with ACC1** were co-expressed in base strains, which significantly improved lipid content (8.0% DCW, 2.6-fold than control), but severely reduced yeast growth and cell viability. Finally, a designed two-stage process convincingly ameliorated the negative effects, resulting in normal cell growth, very high lipid productivity (307 mg/L, 4.6-fold above control) and improved cell viability.
Electronic supplementary material
The online version of this article (10.1007/s10295-018-2046-0) contains supplementary material, which is available to authorized users.
Introduction
Lipids are produced within single-celled microorganisms such as yeasts and algae both for energy storage and to provide a source of fatty acids (FAs) for the production of metabolic intermediates and cellular precursors of membranes [10]. The neutral lipid triacylglycerol (TAG), composed of three fatty acids attached to a backbone glycerol molecule via ester linkages, is one of the most plentiful forms found within cells. Depending on the microorganism source and any genetic engineering strategies applied to them, lipid can be useful for industrial applications such as biofuels, surfactants and lubricants [18, 21]. In contrast to plant-derived oils and animal fats, production of microbial lipids can avoid competition with the food supplies especially where they are cultivated using non-food carbon feedstocks such as lignocellulosic biomass [14].
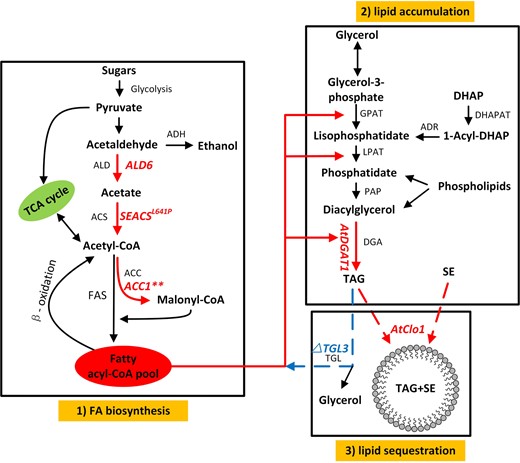
Lipid production pathway in yeast. The three major steps in yeast lipid production involve 1 FA biosynthesis, 2 lipid accumulation and 3 lipid stabilization. The six genes manipulated in this study are: overexpression of native aldehyde dehydrogenase isoform 6, Ald6; heterologous expression of S. enterica acetyl-CoA synthetase with L641P mutation, SEACSL641P; acetyl-CoA carboxylase carrying two mutations ser659ala and ser1157ala, ACC1**; diacylglycerol acyltransferase and LD-associated protein caleosin, both from A. thaliana, AtDGAT1 and AtClo1, respectively, are shown in red text. Gene knockout triglyceride lipase isoform 3, Tgl3, is shown in blue typeface. TCA tricarboxylic acid cycle, ADH alcohol dehydrogenase, ALD aldehyde dehydrogenase, ACS acetyl-CoA synthetase, FAS fatty acid synthase, ACC acetyl-CoA carboxylase, GAPT glycerol-3-phosphate acyltransferase, LPAT lysophosphatidic acid acyltransferase, PAP phosphatidate phosphatase, DGA diacylglycerol acyltransferase, DHAP dihydroxyacetone phosphate, DHAPAT DHAP acyltransferase, ADR 1-acyl-DHAP reductase, DAG diacylglycerol, TAG triacylglycerol, SE sterol ester, TGL triglyceride lipase
Increasing FA biosynthesis requires an increase in the pool of acetyl-CoA and this can be achieved through increasing acetaldehyde flux derived from pyruvate, catalyzed by cytosolic aldehyde dehydrogenase (Ald6) and acetyl-CoA synthetase (ACS) (Fig. 1, step 1 fatty acid biosynthesis). Recombinant expression of a combination of ACSL641P derived from Salmonella enterica and overexpression of native Ald6 in S. cerevisiae directed carbon flux into end products when combined with six other genes for improved production of α-santalene [4] and amorphadiene [24] by improving the acetyl-CoA level. In the subsequent reaction in the pathway, acetyl-CoA carboxylase (ACC1) catalyzes the extension of acetyl-CoA to form malonyl-CoA, which is the first reaction in building a nascent FA chain. Overexpression of ACC1 increased yeast lipid content by 58% [22], and heterologous expression of an ACC1** (ACC1 carrying ser658ala, ser1157ala mutations) to remove regulatory control on the enzyme via posttranslational phosphorylation was also found to increase lipid content by 67% when combined with wax synthase in S. cerevisiae [23].
Within the yeast cell, FA is accumulated as TAG formed via CoA-independent and -dependent pathways (Fig. 1, step 2 lipid accumulation). For the latter route, the terminal step of the reaction for the formation of TAG is catalyzed by diacylglycerol acyltransferase (DGA). Heterologous expression of an analogous enzyme, DGAT1 derived from Arabidopsis thaliana, improved TAG levels more than threefold in yeast [3] and increased lipid accumulation in our prior study [20]. Stabilization of lipid stores within cells can be achieved through several mechanisms such as expression of lipid droplet (LD)-associated proteins that stabilize the LDs or prevention of lipolysis of stored lipid (Fig. 1, step 3 lipid stabilization). Heterologous expression of LD-associated proteins, caleosin (AtClo1) from A. thaliana, in yeast led to an increase in total FAs by 46–74% [9, 12], while deletion of one of the main triglyceride lipase genes of yeast, Tgl3, was demonstrated to release FA from LDs, and increased TAG by 2.38-fold [1, 2].
Most metabolic engineering research in microbial lipids in yeast has targeted FA synthesis and to a lesser extent lipid accumulation pathways. Few studies in yeast have included genes to enhance lipid stabilization in lipid droplets, although this is key to building stable lipid pools. Here, we have investigated a distinctive and comprehensive metabolic engineering approach that increases FA synthesis and enhances accumulation and stabilization of TAG. Further, in recognizing that TAG provides both energy and a source of FA for membrane and other essential components, we have assessed the potential impacts of metabolic engineering on cell growth and membrane integrity. The effect of introduction of five genes and one deleted gene to enhance FA synthesis through stabilization was investigated systematically. The yeast with all six gene interventions had the highest individual lipid content, but also the lowest growth rate and cell viability. A two-stage bioprocess successfully ameliorated the negative impacts of metabolic engineering in the highly engineered strain.
Materials and methods
Yeast strains, media and transformation
The wild-type yeast strain BY4741 [ATCC 4040002] (Genotype: MATa his3Δ1 leu2Δ0 met15Δ0 ura3Δ0) and its Tgl3 knockout (Δ) strain were kindly provided by Prof. Hongyuan Yang, University of New South Wales [8]. The wild-type BY4741 was maintained with yeast extract peptone dextrose (YPD) medium (10 g/L yeast extract, 20 g/L Bacto Peptone and 20 g/L glucose), and the BY4741 ΔTgl3 strain was maintained with YPD plus 200 mg/mL Geneticin. Yeast transformation was conducted using the Sigma Transformation Kit as per the manufacturer’s instructions. Selection of yeast transformants was carried out and maintained based on their auxotrophy using yeast synthetic complete (SC) minimal medium, which contains 6.7 g/L of yeast nitrogen base, 20 g/L glucose plus a mixture containing appropriate nucleotide bases and amino acids for the various dropout options (SC-His, SC-Ura, SC-Leu, SC-His-Ura, SC-His-Leu, SC-Ura-Leu, SC-His-Leu-Ura).
Plasmid construction
All plasmids, inserts and promoters used in this study are listed in Table 1. The genes caleosin Atclo1 (At4g26740) and AtDGAT1 (At2g19450), originally from the plant A. thaliana, were synthesized as codon optimized for S. cerevisiae expression by GenScript and inserted into pESC vectors (Agilent, USA). AtDGAT1 and AtClo1 genes, each with the Kozak sequence AAACA inserted to the 5’ end of the start codon to enhance expression, were ligated into BamHI-XhoI, SpeI-BglII, and BamHI-XhoI, SpeI-BglII, respectively, to generate expression plasmids pESC-Leu-AtDGAT1, pESC-Leu-AtClo1 and pESC-Leu-AtDGAT1-AtClo. The remaining plasmids: pAD (ACC1**, ACC1 with ser659ala, ser1157ala mutations) and empty backbone pSP-GM2; pIYC05 (Ald6-SEACSL641P) and empty backbone pIYC04 and empty backbone pESC-leu2d were shared by Addgene. The specific gene sequences can be obtained via the NCBI or Addgene website.
Details of genes, promoters and plasmids used in this study
| Plasmid name | Description | References |
|---|---|---|
| pIYC05 | P PGK1 - ALD6/P TEF1 - SEACSL641P, Addgene plasmid # 64742 | Chen et al. [4] and Shi et al. [23] |
| pIYC04 | Vector backbone, derived from pESC-HIS, Addgene plasmid # 64741 | Chen et al. [4] |
| pAD | P PGK1 - ACC1 (ser659ala, ser1157ala), Addgene plasmid # 64747 | Chen et al. [4] and Shi et al. [23] |
| p-SP-GM2 | Vector backbone, derived from pESC-URA, Addgene plasmid # 64740 | Chen et al. [4] |
| pESC-Leu-AtDGAT1 | pESC - leu - P GAL1 - AtDGAT1 | This study |
| pESC-Leu-AtClo1 | pESC - leu - P GAL10 - AtClo1 | This study |
| pESC-Leu-AtDGAT1-AtClo1 | pESC - leu - P GAL1 - AtDGAT1/P GAL10 - AtClo1 | This study |
| pESC-leu2d | Vector backbone, Addgene plasmid # 20120. |
Lipid production by one-stage and two-stage processes
For standard one-stage bioprocess, seed culture was prepared by inoculating a single transformed colony into 50 mL Falcon tube containing 5 mL yeast SC minimal medium and incubating at 30 °C, 250 rpm, overnight. The culture was diluted into 50 mL SC induction medium containing 2% (w/v) galactose and 1% (w/v) raffinose in 250 mL flasks, with a final OD600 nm value of approximately 0.4. The flasks were covered with two layers of aluminum foil and incubated at 30 °C and 250 rpm until harvesting at 72 h. For the two-stage bioprocess, the same procedure was followed to generate the seed culture, but an additional step was included prior to the induction step with galactose. Seed culture was diluted at OD600 nm of 0.4 into 50 mL SC minimal medium in 250 mL flask and incubated at 30 °C and 250 rpm for 12 h. Yeast cells were collected by centrifugation (3000 rpm, 5 min), the medium was removed and the cell pellets were suspended in fresh 50 mL SC induction medium containing 2% (w/v) galactose and 1% (w/v) raffinose and cultured at 30 °C and 250 rpm for 60 h before harvesting. The lipid yield in cells produced by one-stage and two-stage processes was further analyzed as below.
Measurement of cell growth and cell viability
The cell growth was measured by optical density (OD) at 600 nm using DR 5000™ UV–Vis spectrophotometer and cell viability was determined by flow cytometry after yeasts were stained with propidium iodide (PI) (ThermoFisher, USA) and individual cell fluorescence measured using the violet laser 488 nm on a CytoFlex (Beckman Coulter, USA). More than 10,000 cells were measured for each sample and the data acquired was analyzed further by the software CytExpert Ver.2.0.
Total fatty acid analysis of yeast cells
After 72 h post-induction, cells were harvested and pelleted by centrifugation at 3000 rpm for 5 min, frozen at − 80 °C for ~ 1 h, then freeze dried overnight using a FreeZone® 4.5 Liter Freeze Dry Systems (Labconco Corporation, USA) to obtain the dry cell weight (DCW) of each culture. Dry cells (~ 20 mg) were treated with 2 mL methanol/hydrochloric acid/chloroform (10:1:1, v/v/v) and heated at 90 °C for 1 h in sealed test tubes to convert lipids to fatty acid methyl ester (FAME). FAME was washed with 0.9% NaCl solution (1 mL) and extracted with hexane after mixing. FAME samples (1 µL) were analyzed by Agilent 7890A gas chromatography with flame ionization detection (GC–FID) as described previously [20].
Quantification of gene expression levels by RNA-Seq analysis
Yeast cells were cultured as described earlier and harvested at 24 h in one-/two-stage bioprocess after induction for RNA-Seq analysis. Culture samples (20 mL) were collected using pre-chilled 50 mL Falcon tubes and centrifuged at 5000 rpm, 5 min at 4 °C to obtain cell pellets. The cell pellets were washed quickly with autoclaved PBS buffer once and then centrifuged again under the same conditions. Cells were flash frozen in liquid nitrogen, stored at − 80 °C before shipping for RNA-Seq analysis and stored on dry ice. The RNA extraction, library preparation (250–300 bp insert cDNA library), RNA sequence analysis and assembly were conducted by Novogene, Hong Kong.
Results and discussion
Effect of expression of individual gene on lipid yield and cell physiology
![Effect of expression or deletion of a single gene on yeast growth and lipid production after 72 h culture period. a Biomass production measured using OD600 nm at 12 h time points during the culturing, b lipid content (measured as total fatty acids) as a percentage of dry cell weight (DCW), c lipid yield based on the total culture volume and d fatty acid profile in each sample. [*Control1 is the wild-type BY4741 containing the empty pESC-Leu2d vector. SCFAs, short chain fatty acids, include C10:0, C12:0 and C14:0. Asterisks (***) indicate significant difference (one-way analysis of variance, ANOVA, test) at P < 0.001, α = 0.05 post hoc Holm–Sidak test for engineered strains compared to Control1.]](https://oup.silverchair-cdn.com/oup/backfile/Content_public/Journal/jimb/45/8/10.1007_s10295-018-2046-0/3/m_10295_2018_2046_fig2_html.jpeg?Expires=1750292608&Signature=1lEBq~4khW7APYQYFm0lPsgEWX-N~xzx7pXs~zc9TF9zhCJdqYLQhLQVOeQzSvqY0IbG-6YR8g~A4YQRHjo-ro7DKYbVe1pFzw3OI8HX3MWcc-g4kHvt6aEPk1XAwBD5HQbAbnf~ll-1FMh4NgvCsRK13devlaRKHkudV8~S3PoJ3CQTVMN9g609-zI8VdZ2eKDX~c~fmEG7Vkz4V9gi7myaGqFZDReS3WohUYXVf0xd~943DXK1Ddmnnjhw9-H653t3nIO2sXJGtYfXyc-F4gaqwCl5czEMWFosduI8gpPcYPxpfQAjoSaPZT79PJy7lUgCeA7dsiztSuCpX7Pa9Q__&Key-Pair-Id=APKAIE5G5CRDK6RD3PGA)
Effect of expression or deletion of a single gene on yeast growth and lipid production after 72 h culture period. a Biomass production measured using OD600 nm at 12 h time points during the culturing, b lipid content (measured as total fatty acids) as a percentage of dry cell weight (DCW), c lipid yield based on the total culture volume and d fatty acid profile in each sample. [*Control1 is the wild-type BY4741 containing the empty pESC-Leu2d vector. SCFAs, short chain fatty acids, include C10:0, C12:0 and C14:0. Asterisks (***) indicate significant difference (one-way analysis of variance, ANOVA, test) at P < 0.001, α = 0.05 post hoc Holm–Sidak test for engineered strains compared to Control1.]
With regard to lipid content, yeast cells with a key lipase knocked out (ΔTgl3) or expressing AtDGAT1 had increased lipid content from 3.0 to 4.5% and 4.0%, corresponding to a relative increase of 40 and 25% (Fig. 2b), respectively, performances that matched previous reports [2, 3, 20]. The same strains also had improved lipid production based on the whole culture compared with Control 1 (Fig. 2c). However, no significant improvement in lipid content was observed for cells expressing Ald6-SEACSL641p or ACC1** or Atclo1 on either a dry cell weight (DCW) or whole culture basis (Fig. 2b, c), which was not fully consistent with earlier reports [4, 9, 12, 22]. A higher Km (Michaelis constant) of SEACSL641P for its substrates than the yeast Acs1p and unbalanced enzyme activities [24] could help to explain the unimproved lipid content of these strains. Furthermore, host strains and medium compositions used here differed from earlier reports, which could contribute to lower than expected lipid values. In terms of substantial changes to FA profiles, Ald6-SEACSL641P expression slightly increased C18 and reduced C16 FAs, whereas AtDGAT1 expression reduced C16:1 but increased C16:0 and C18:0 as shown in Fig. 2d. Tgl3 knockout led to a reduction in C16:1 and increases in short chain FAs (SCFAs).
While the six genes under examination showed promise for enhancing lipid production when expressed individually in previous reports [2–4, 12, 20, 23], it was clear from our study that altering a single gene either did not increase lipid, or, if it did, it also reduced cell growth. Therefore, it was necessary to examine the impact of the expression of additional genes in a stepwise manner. We have thus constructed two base strains for this purpose. The first base strain (B1) combines two genes with clear positive effects on lipid production in our initial analysis, AtDGAT1 expression and ΔTgl3 to explore the effect of addition of further genes coding for enzymes for FA biosynthesis. In parallel, a second base strain, B2, was prepared that included all genes that enhanced lipid accumulation (AtDGAT1) and supported lipid stabilization (Atclo1 and ΔTgl3).
Construction of base strains engineered for enhanced lipid accumulation and stabilization
![Effect of expression or deletion of a single gene and multiple gene combinations on yeast growth, cell viability and lipid production over a 72 h culture period. a Biomass production measured using OD600 nm, b percentage of viable cells in the culture measured in PI-stained cells by flow cytometry, c lipid content (measured as total fatty acids) as a percentage of dry cell weight (DCW), d lipid yield based on the total culture volume. [*Control is the wild-type BY4741 containing appropriate empty vectors. Base strain 1 = B1 expressing AtDGAT1 in the Tgl3 knockout. Base strain 2 = B2 expressing AtClo1 and AtDGAT1 in the Tgl3 knockout. Asterisks (***) indicate significant difference (one-way analysis of variance, ANOVA, test) at P < 0.001, α = 0.05 post hoc Holm–Sidak test for engineered strains compared to the control.]](https://oup.silverchair-cdn.com/oup/backfile/Content_public/Journal/jimb/45/8/10.1007_s10295-018-2046-0/3/m_10295_2018_2046_fig3_html.jpeg?Expires=1750292608&Signature=NIEexVR2obWkWGFldp~rHO8jteSeeuXkKYZmk7nNY8r9uivakOu5e~z99dPLdEPBRVY1QEHWoHUzwyXSNS7bilRlAf-LF7iPoEDRx1SCbHe6bTYSvXiudVGaPhJF0jIbQxmaay76IgqFtuA4Fh8nk~lD2l09meMEI0lH4l2cw9MDFOJakoDGcSuvh0DKmEopkQpbdW86A9T2HCUe6MhHFTMhdwZ5rDZmirYcaF-BOz93XANIP-j9sO-LN9tqv7T4jppUP1GtXGoEMuO~Mos68K7Y6xvQ4g4XLZysp~mhLsaaWscfplc8lkQIupKB4iQmQQHUnbapVIzY3d2bWUAz1g__&Key-Pair-Id=APKAIE5G5CRDK6RD3PGA)
Effect of expression or deletion of a single gene and multiple gene combinations on yeast growth, cell viability and lipid production over a 72 h culture period. a Biomass production measured using OD600 nm, b percentage of viable cells in the culture measured in PI-stained cells by flow cytometry, c lipid content (measured as total fatty acids) as a percentage of dry cell weight (DCW), d lipid yield based on the total culture volume. [*Control is the wild-type BY4741 containing appropriate empty vectors. Base strain 1 = B1 expressing AtDGAT1 in the Tgl3 knockout. Base strain 2 = B2 expressing AtClo1 and AtDGAT1 in the Tgl3 knockout. Asterisks (***) indicate significant difference (one-way analysis of variance, ANOVA, test) at P < 0.001, α = 0.05 post hoc Holm–Sidak test for engineered strains compared to the control.]
Strain B1 having its major TAG lipase gene (Tgl3) knocked out and expressing AtDGAT1 showed improved lipid content from 3.1 to 5.9% (corresponding to a relative increase by 92%) on a DCW basis above control (Fig. 3c), while no additional increase was found for B2 which also expressed AtClo1. Similar increases were obtained for total lipid yield in B1 and B2 above controls, as comparable growth and biomass were achieved for these strains (Fig. 3d). Overall, B1 increased total lipid by 1.9-fold higher than that of control (66.6 mg/L), followed by B2 with 1.8-fold improvement above the control.
Lipid accumulation and stabilization genes AtDGAT1, Tgl3 deletion and Atclo1 were combined in one strain for the first time in this study. AtDGAT1 and Tgl3 knockout combination (B1 strain) improved total lipid yield by 88% above the control, without impact on growth or cell viability for most of the culture period. A similar strategy of combining fatty acid synthesis (WRI1) and lipid accumulation (DGAT1) genes has shown significantly increased lipid content in leaves of Nicotiana benthamiana under transient expression [28].
The proposed structure of the lipid droplet-stabilizing protein caleosin supports membrane formation [13] and thus enhances lipid stabilization. The combined expression of a modified oleosin, stabilized through the incorporation of a cysteine–cysteine bond and AtDGAT1, increased fatty acids in yeast by 1% DCW compared with AtDGAT1 expression alone [29], and a combination of yeast DGAT (ScDGA1) and A. thaliana oleosin (AtOLEO3) was found to enhance TAG accumulation in a marine diatom [30]. In our study, Atclo1 was added to a base strain which already had the Tgl3 deleted and thus the requirement for an LD-stabilizing protein was reduced.
Physiological effects of expression of enhanced fatty acid biosynthesis genes in base strains
![Comparison of the effects of enhanced fatty acid biosynthesis steps on yeast growth, cell viability and lipid production over 72 h culture period between two base strains. a, e Biomass production measured using OD600 nm, b, f percentage of viable cells in the culture measured in PI-stained cells by flow cytometry, c, g lipid content (measured as total fatty acids) as a percentage of dry cell weight (DCW), d, h lipid yield based on the total culture volume. [Asterisks (***) indicate significant difference (one-way analysis of variance, ANOVA, test) at P < 0.001, α = 0.05 post hoc Holm–Sidak test for engineered strains compared to B1 and B2.]](https://oup.silverchair-cdn.com/oup/backfile/Content_public/Journal/jimb/45/8/10.1007_s10295-018-2046-0/3/m_10295_2018_2046_fig4_html.jpeg?Expires=1750292608&Signature=ygbsxtBjXvi3iNOlafeRx4kBx9Jbb5TCxbfjvvA1izN3Fcmsh-ddrFRRK9g~cEfSVrp0kFi9CBsCg3p4Y06k-aQqvH3FfGr8aUf2b~QT6fDPym~Mttcr0oXplGZ9MOI1hVYq-JvOovF-m3pZWCXrTB7zu2FCpcJnWb8ZKtWd6Lku5YI66IpQRT5P6Ad2gHkabiyjvVGvXCHVQhADmHJOlB1QKrEvtpBw9W1FjuB-2UTfXBBjDfPWmh5RbVb3FR1CAnWAgyZ6vwCNnIXTpBFZh1OU1MEddSzx8Wd7xUwTf1AHaHwluvzG-n89XNzBakx7ddIUrKIFs-7U6btUBIb9Mg__&Key-Pair-Id=APKAIE5G5CRDK6RD3PGA)
Comparison of the effects of enhanced fatty acid biosynthesis steps on yeast growth, cell viability and lipid production over 72 h culture period between two base strains. a, e Biomass production measured using OD600 nm, b, f percentage of viable cells in the culture measured in PI-stained cells by flow cytometry, c, g lipid content (measured as total fatty acids) as a percentage of dry cell weight (DCW), d, h lipid yield based on the total culture volume. [Asterisks (***) indicate significant difference (one-way analysis of variance, ANOVA, test) at P < 0.001, α = 0.05 post hoc Holm–Sidak test for engineered strains compared to B1 and B2.]
In prior research, the inclusion of the genes Ald6-SEACSL641P into metabolically engineered yeast has resulted in either improved productivity [4, 5, 15, 24] or negative effects such as on resveratrol production [19]. In our case, inclusion of Ald6-SEACSL641p impaired yeast growth and cell viability. The cause may be abnormally high levels of cytosolic acetate and acetyl-CoA, due to higher expression of acetaldehyde dehydrogenase (Ald6) and acetyl-CoA synthetase (ACS) or possible disparity between their products [24].
To alleviate the potential buildup of acetate and acetyl-CoA intermediates in the base strains as a consequence of expressing Ald6-SEACSL641p, an additional gene ACC1** was brought into the highly engineered strains. Firstly, ACC1** was introduced into base strains B1 and B2 resulting in mixed effects on cell growth and lipid production. Specifically, ACC1** expression in B1 and B2 severely reduced cell growth but improved lipid content by 24% in B1 strain, while causing no change to lipid content of the B2 strain (Fig. S4. A&B). This result is similar to earlier studies where ACC1** expression in yeast CEN.PK 113-5D increased total fatty acids by 65% (11.7% DCW), but with a lower growth rate and a reduced final biomass [23].
To further understand the effect of gene ACC1** on our engineered strains, ACC1** was introduced into strains B1AS and B2AS (forming B1ASA and B2ASA, respectively) and its impact on cell physiology and lipid production was determined. The growth rate of B1ASA was improved above B1AS and comparable to B1 (Fig. 4a), while the growth of B2ASA was very similar to B2AS and both were considerably lower than B2 (Fig. 4e). Concomitantly, cell viability was improved for B1ASA compared with B1AS, whereas the viability of B2ASA dropped further than B2AS to reach a mean of 55% by 72 h (Fig. 4b, f). There were also mixed results in lipid production in the strains due to ACC1** addition: neither lipid content nor yield improved significantly in B1ASA over B1 and B1AS (Fig. 4c, d), but the lipid content of B2ASA increased over both B2 and B2AS to 8.0% DCW (a relative increase of 64 and 15%, respectively), while its lipid yield was below that of B2 (Fig. 4d, h).
The difference in cell physiology response and lipid production in the engineered strains following introduction of ACC1** can be explained, at least in part, by the expression levels of the introduced genes. The B1ASA strain showed high relative expression of Ald6, SEACSL641p and, more importantly, very high ACC1 levels, compared with the B1AS strain at 24 h; the latter strain displayed negative growth and cell viability and displayed only modest ACC1 expression (Fig. S1. C). The primary effect of enhanced ACC1 expression may be to balance metabolic intermediates and alleviate toxicity from the increased levels of acetate and acetyl-CoA, leading to recovery of cell growth and viability observed in B1ASA. Despite more precursors being available for fatty acid synthesis due to higher pathway gene expression in the B1ASA strain, there was slightly reduced lipid content in this strain compared with B1AS.
AtDGAT1 expression was similar between B1AS and B1ASA, suggesting that the lipid accumulation step may be saturated. Higher lipid content can only be achieved with higher DGAT activity to draw fatty acid into TAG. Indeed, B2ASA showed 4.1-fold higher AtDGAT1 and 4.8-fold higher AtClo1 expression levels above those of B2AS and this strain also had the highest lipid level (8%) of any of the engineered strains tested. This observation supports the notion that higher expression of genes for lipid accumulation leads to higher cellular lipid content.
Inclusion of the gene coding for the lipid droplet stabilizing protein, Atclo1, differentiated the B2 engineered strains from the B1 series. Taken as a whole, the B2 series of engineered cells performed slightly worse than their B1 counterparts in terms of growth, cell viability and lipid yield, but these cells had the highest lipid content (DCW).
Upregulated glycerol production pathway in cells engineered for lipid production
The base strains B1 and B2 had slightly reduced growth rate (µ) than the control, but the addition of Ald6-SEACSL641p expression clearly reduced the growth rate of B1AS and B2AS to around half that of B1 and B2, respectively (Table 2). Addition of ACC1** to the B1AS and B2AS strains recovered the growth rate of B1ASA, but not of B2ASA.
Physiological parameters of engineered yeast strains during exponential phase in flasks
| Strain name | Growth rate μ (h−1) | Galactose uptake rate (h−1) | Raffinose uptake rate (h−1) | Ethanol production rate (h−1) | Glycerol production rate (h−1) | |||||
|---|---|---|---|---|---|---|---|---|---|---|
| AVG | SD | AVG | SD | AVG | SD | AVG | SD | AVG | SD | |
| Control | 0.082 | 0.007 | − 0.278 | 0.016 | − 0.155 | 0.077 | 0.179 | 0.091 | 0.005 | 0.003 |
| AtDGAT1 | 0.084 | 0.001 | − 0.394 | 0.031 | − 0.100 | 0.010 | 0.164 | 0.094 | 0.021 | 0.004 |
| B1 | 0.072 | 0.001 | − 0.375 | 0.009 | − 0.076 | 0.002 | 0.159 | 0.003 | 0.025 | 0.001 |
| B1AS | 0.041 | 0.004 | − 0.345 | 0.079 | − 0.069 | 0.016 | 0.157 | 0.035 | 0.026 | 0.005 |
| B1ASA | 0.068 | 0.007 | − 0.322 | 0.070 | − 0.083 | 0.003 | 0.134 | 0.040 | 0.026 | 0.010 |
| B2 | 0.071 | 0.008 | − 0.343 | 0.005 | − 0.097 | 0.038 | 0.145 | 0.011 | 0.020 | 0.003 |
| B2AS | 0.041 | 0.001 | − 0.321 | 0.031 | − 0.102 | 0.058 | 0.147 | 0.055 | 0.030 | 0.010 |
| B2ASA | 0.034 | 0.001 | − 0.220 | 0.063 | − 0.168 | 0.002 | 0.083 | 0.056 | 0.018 | 0.003 |
AVG average, SD standard deviation
The production of two by-products, ethanol and glycerol, was also compared among the engineered strains. The ethanol biosynthesis pathway was not significantly affected in most engineered strains where ethanol production rate was slightly lower than control (0.179 h−1), except B2ASA which was reduced to 0.083 h−1 (Table S1). The final ethanol concentration of most of the engineered strains at 72 h post-induction was maintained around 7–8 mg/mL, slightly lower than that of the control, 8.5 mg/mL (Table S1). Interestingly, glycerol production rate was 4-6 fold higher in the engineered strains compared with the control, including the strain expressing AtDGAT1 only (Table 2), suggesting that the glycerol biosynthesis pathway was upregulated with the introduction of this gene. A similar phenomenon was observed in strains engineered for improved production of fatty acid ethyl esters (FAEE) [6]. There could be several causes for the upregulated glycerol biosynthesis pathway, including the availability of more precursors for glycerol biosynthesis such as glycerol-3-phosphate (G3P) from the heavily modified lipid production pathway or due to a generalized stress response of the cells to genetic engineering.
Two-stage bioprocess recovers cell growth and improves lipid yield
![Comparison of the performances of engineered strain B2ASA and control over a 72 h culture period between one-stage and two-stage bioprocesses. a Galactose consumption in one-stage bioprocess, b sugar consumption in two-stage bioprocess, c biomass production measured using OD600 nm, d percentage of viable cells in the culture measured in PI-stained cells by flow cytometry, e lipid content (measured as total fatty acids) as a percentage of dry cell weight (DCW), f lipid yield based on the total culture volume. [Asterisks (***) indicate significant difference (one-way analysis of variance, ANOVA, test) at P < 0.001, α = 0.05 post hoc Holm–Sidak test for engineered strains compared to control and Control2, respectively.]](https://oup.silverchair-cdn.com/oup/backfile/Content_public/Journal/jimb/45/8/10.1007_s10295-018-2046-0/3/m_10295_2018_2046_fig5_html.jpeg?Expires=1750292608&Signature=2pk3fCaB7Y5hJN9gqiwFsMXSq-gS2UYLMdhj5FYVo7Qon13YRr82CRlLiyz-xD~Sa4b3pXEGRjf5DPWaAaAbbYC6gBRK39Bz1GK7AHmtR7lIoRR5JluUpbFJ~rSA9wRz4wdjr2HE4vsEF5l30LRjt9c0LnhR3AiOhYB4Ay5U9YdLXZg1OneWLWhixOvIU-ZklM6MLIle2NyVLSQkIqn280wmeUA1YYmgIWumTcjw~tfw0h-omqQbEECEn9zQa8CrPA7ujI7y4sfLHGJu0ppqYDyjoB96Lu-b38HpkxRQrN4P6WV8ofrAKi4muyR7pDRFb-5tq9mvckWRUUuxQ43wDA__&Key-Pair-Id=APKAIE5G5CRDK6RD3PGA)
Comparison of the performances of engineered strain B2ASA and control over a 72 h culture period between one-stage and two-stage bioprocesses. a Galactose consumption in one-stage bioprocess, b sugar consumption in two-stage bioprocess, c biomass production measured using OD600 nm, d percentage of viable cells in the culture measured in PI-stained cells by flow cytometry, e lipid content (measured as total fatty acids) as a percentage of dry cell weight (DCW), f lipid yield based on the total culture volume. [Asterisks (***) indicate significant difference (one-way analysis of variance, ANOVA, test) at P < 0.001, α = 0.05 post hoc Holm–Sidak test for engineered strains compared to control and Control2, respectively.]
In terms of cell viability, B2ASA had significantly reduced cell viability levels at both stages (Fig. 5d), with a faster rate of decline for cells in the two-stage process when fed with galactose (where all recombinant genes are turned on) than when fed with glucose. Conversely, the growth of B2ASA as measured by OD600 nm in the two-stage process was the same as the control. Stressed cells may have delayed growth and be unable to divide [7], but membrane-damaged cells with poor cell viability could also contribute to growth measures by OD600 nm. While cell viability and cell growth are not always positively correlated, viability should be considered as an important index to assess the fitness of engineered cells.
In comparison with B2ASA in one-stage bioprocess, the two-stage bioprocess achieved significantly higher lipid content (8.36% DCW), 2.7-fold over the control (Fig. 5e), and more striking was the improvement in lipid yield to > 300 mg/L (Fig. 5f). Two-stage bioprocesses are known for increasing product yields in metabolic engineered organisms, such as the altered C:N ratio for yeast production of lipids [25]. Here, we demonstrated that the combination of yeast lipid pathway engineering and bioprocess strategy can simultaneously achieve high lipid content and lipid yield.
Conclusions
Metabolic engineering for increased production of lipid in yeast was achieved through the combined expression of genes for fatty acid biosynthesis (Ald6-SEACSL641P , ACC1**), lipid accumulation (AtDGAT1) and stabilization (ΔTgl3, Atclo1). Lipid content and yield and cell viability were shown to be important indicators of productivity of the engineered strains. The final engineered strain had the highest cellular lipid content but lowest growth, a hurdle which was overcome by separating the growth and lipid accumulation stages of the bioprocess. Thus, a combination of metabolic engineering and bioprocess strategies was shown to be a powerful approach to achieve high end-product yield; this can also be extended to high lipid production microorganisms such as Y. lipolytica.
Acknowledgements
We acknowledge the financial support from the ARC linkage project (LE160100185) and Monash University for the graduate and international postgraduate research scholarships awarded to HP. We thank the undergraduates Mr. Alastair Katrivessis and Mr. Mitchell Drowley for assistance with experiments and useful discussion on the results. We are grateful to Ms. Yanqin Xu and Prof. Hongyuan Yang for the strains BY4741 and BY4741 ΔTgl3.
Compliance with ethical standards
Conflict of interest
The authors declare no financial or commercial conflict of interest.
References
- Ald6
Native aldehyde dehydrogenase isoform 6
- AtDGAT1
Diacylglycerol acyltransferase from Arabidopsis thaliana
- Atclo1
Caleosin, lipid droplet stabilization protein from Arabidopsis thaliana
- ACC1
Acetyl-CoA carboxylase
- ACC1**
Acetyl-CoA carboxylase carrying two mutations ser659ala, and ser1157ala
- ACS
Acetyl-CoA synthetase
- ADH
Alcohol dehydrogenase
- ALD
Aldehyde dehydrogenase
- ADR
1-acyl-DHAP reductase
- B1
BY4741-AtDGAT1-ΔTgl3
- B1AS
B1-Ald6-SEACSL641P
- B1ASA
B1-Ald6-SEACSL641P-ACC1**
- B2
BY4741-AtDGAT1-ΔTgl3-Atclo1
- B2AS
B2-Ald6-SEACSL641P
- B2ASA
B2-Ald6-SEACSL641P-ACC1**
- DAG
Diacylglycerol
- DGA(T1)
Diacylglycerol acyltransferase
- DHAP
Dihydroxyacetone phosphate
- DHAPAT
DHAP acyltransferase
- DCW
Dry cell weight
- FA
Fatty acid
- FAS
Fatty acid synthase
- FAEE
Fatty acid ethyl esters
- GAPT
Glycerol-3-phosphate acyltransferase
- GC–FID
Gas chromatography with flame ionization detection
- HPLC
High-performance liquid chromatography
- LD
Lipid droplet
- LPAT
Lysophosphatidic acid acyltransferase
- OD
Optical density
- PI
Propidium iodine
- PAP
Phosphatidate phosphatase
- RID
Refractive index detector
- RNA-seq
Ribonucleic acid sequencing
- SCFAs
Short chain fatty acids
- SE
Sterol ester
- SEACSL641P
Acetyl-CoA synthetase with L641P mutation, derived from Salmonella enterica
- TAG
Triacylglycerol
- TGL
Triglyceride lipase
- TCA
Tricarboxylic acid cycle
- ΔTgl3
Triglyceride lipase 3 knockout
