


 https://orcid.org/0009-0009-0596-4996

Abstract
Background
The epidemic Clostridioides difficile ribotype 027 (RT 027) strain is associated with bacterial virulence traits, including faster germination time and resistance to moxifloxacin, a second-generation fluoroquinolone. Although fluoroquinolones are linked to the RT 027 epidemic, studies to understand moxifloxacin as a high-risk antibiotic for C difficile infection (CDI) are limited. This study assessed the microbial taxonomic profile and metabolomic changes in healthy volunteers given moxifloxacin or oral vancomycin, an antibiotic known to increase CDI risk via gut perturbation.
Methods
This phase 1, nonblinded, randomized clinical trial comprised healthy volunteers aged 18 to 40 years who received moxifloxacin or vancomycin for 10 days. Stool samples were collected at baseline and 12 follow-up visits. Metataxonomics was completed by 16S rRNA sequencing and bile acid metabolites by liquid chromatography–tandem mass spectrometry.
Results
Moxifloxacin therapy caused minimal microbial disruption, although changes were observed in bacterial species from the Clostridiales order during therapy. Secondary bile acid concentrations decreased from day 0 to day 7 with moxifloxacin therapy. Vancomycin caused more significant changes in the microbiome, including increased Proteobacteria, decreased Clostridiales abundance, and a longer duration of decreased secondary bile acids.
Conclusions
Moxifloxacin use was associated with specific microbiome and metabolomic changes, increasing CDI risk albeit for a shorter period than vancomycin. This window of vulnerability may help to explain the risk of fluoroquinolones with the faster germination time for RT 027 strains.
Clinical Trials Registration. ClinicalTrials.gov NCT06030219.
Clostridioides difficile is a gram-positive, spore-forming, and toxin-producing organism causing C difficile infection (CDI) in susceptible hosts [1]. The pathophysiology of CDI involves disruption of the healthy gut microbiome, usually with high-risk antibiotics, allowing spores to germinate, produce toxins, and cause disease. High-risk antibiotics are highly excreted in the feces and have anaerobic activity against commensal gut bacteria that confer colonization resistance against C difficile [2]. Loss of colonization resistance is associated with decreased secondary bile acids, which inhibit C difficile spore germination; this in turn increases primary bile acids, which facilitate spore germination [3]. Specific anaerobic bacteria residing in the gastrointestinal tract are largely responsible for converting primary bile acids to secondary bile acids via 7-α-dehydroxylation. Only a relatively small group of commensal bacteria can perform 7-α-dehydroxylation, including Lachnospiraceae and Ruminococcaceae family members belonging to the Clostridiales order [4]. Thus, antibiotics that kill bacteria from the Clostridiales order are considered particularly high risk.
The global increase in CDI incidence and severity over the last 2 decades has been linked to the emergence of certain C difficile strains, including the epidemic ribotype 027 (RT 027) strain [5, 6]. RT 027 has been the most predominant ribotype in the United States, Canada, and Europe and continues to be an endemic strain in hospitalized and community-dwelling patients, with a 15%–20% prevalence of isolated strains [7–9]. RT 027 strains possess many hypervirulent properties, including higher rates of antimicrobial resistance, sporulation, and increased fitness and toxin production [6, 10]. Germination of RT 027 is faster than other ribotypes, potentially resulting in a shorter time from initial C difficile colonization to infection [11, 12]. RT 027 strains have 2 distinct fluoroquinolone-resistant lineages that confer resistance to second-generation fluoroquinolones, including moxifloxacin [13, 14]. The majority of C difficile RT 027 strains (98%) are resistant to moxifloxacin, with resistance caused by nonsynonymous mutations to DNA gyrase or topoisomerase IV [15]. Although fluoroquinolone resistance is a key component of risk for CDI [16], a major disruption to the commensal microbiota is also generally required for CDI to occur. There are limited studies evaluating the effect of moxifloxacin on the gut microbiome. Culture-based studies have shown decreases in Clostridia and bifidobacteria but not peptostreptococci, lactobacilli, Veillonella, Bacteroides, or fusobacteria after exposure to moxifloxacin [17]. In a triple-stage chemostat human CDI gut model, RT 027 and RT 001 strains treated with moxifloxacin daily over 10 days caused minimal disruption to Bacteroides, bifidobacteria, lactobacilli, enterococci, and total anaerobes [18]. However, germination of C difficile occurred within 4 to 7 days of initiating moxifloxacin therapy. In a hamster model, 5-day treatment with moxifloxacin increased susceptibility to an RT 027 strain regardless of moxifloxacin susceptibility [19]. These findings suggest that the minimal disruption observed in vitro may translate to animal models. A human case report also showed moxifloxacin-associated CDI following 5 days of moxifloxacin therapy [20]. Despite these preliminary data, a mechanistic understanding of moxifloxacin-induced gut microbiome disruption in humans remains insufficient. Our study sought to characterize the effects of moxifloxacin on the gut microenvironment as compared with vancomycin, which is a known gut microbiome disruptor and is associated with high recurrence rates in cases of CDI treatment [21]. The purpose of this study was to better understand the mechanisms contributing to the increased risk of CDI with moxifloxacin, as compared with a known antibiotic with major microbiome disruption activity, in a healthy population to provide insights for at-risk populations.
METHODS
Study Design, Population, and Medications
This study was part of a phase 1, randomized, nonblinded clinical trial enrolling volunteers aged 18 to 40 years at the University of Houston from 2020 to 2021 to investigate the effects of specific antibiotics on the microbiome of healthy volunteers (ClinicalTrials.gov NCT06030219). This study was approved by the University of Houston Committee for the Protection of Research Subjects (IRB00002009) and followed the good clinical practice guidelines of the International Council for Harmonization and the ethical principles of the Declaration of Helsinki. Written informed consent was collected from each volunteer during the screening visit and before initiation of study procedures. Eligible volunteers were between the ages of 18 and 40 years; had no history of cardiovascular disease, gastrointestinal disease, hepatic disease, renal disease, diabetes, depression, vertigo, tinnitus, or diminished hearing; and were not currently tobacco users. Eligible volunteers were excluded if they received antibiotics within 90 days of enrollment, were pregnant, or were currently prescribed and taking anticoagulants or probiotics. Participants were given a unique study identifier to ensure confidentiality and were randomized by simple randomization to omadacycline, moxifloxacin, or vancomycin. Data generated from participants treated with vancomycin were compared with omadacycline in a prior publication [22]. This study focuses on the comparison of gut microbiome changes between moxifloxacin and vancomycin, a glycopeptide antibiotic and major disruptor of the microbiome when administered orally [23]. Volunteers were prescribed a 10-day course of moxifloxacin (400 mg, once daily) or vancomycin (125 mg, 4 times daily). Moxifloxacin doses were administered under supervision, while compliance for vancomycin was confirmed through observation of 1 dose and daily self-reports for subsequent doses.
Safety Assessment
Adverse events were assessed by study investigators at each visit from the time of enrollment for duration, severity (mild, moderate, severe), and possible relation to study medications (not suspected, not related, unlikely related, suspected, possibly related, or definitively related).
Stool Collection, DNA Extraction, Sequencing, and Data Processing
Fecal samples were collected before antibiotic initiation (day 0 [D0]), daily during therapy (D1–D10), and at 2 time points following cessation of therapy (end of therapy; D13 and D30) for a total of 13 sample collection time points. Collected fecal samples were immediately transferred to the central laboratory at the University of Houston, College of Pharmacy, for storage at −80 °C until further processing. DNA extraction was conducted with the DNeasy Powersoil DNA Extraction Kit (Qiagen), following the manufacturer's protocol and included controls both positive (microbial community standard; Zymo Research) and negative (molecular grade water). Polymerase chain reaction was conducted to amplify the 16S rRNA V1–V3 gene region with custom oligonucleotides containing 27F and 534R bacterial rRNA 16S primers, distinct dual barcodes, and Illumina sequencing adapters [24]. Each polymerase chain reaction plate included a positive control (genomic DNA of known concentration) and a negative control (molecular grade water) to avoid nucleic acid contamination. Subsequently we performed 16S sequencing of the V1–V3 region using the MiSeq with the 2 × 300 version 3 sequencing kit (Illumina), and sequencing data processing was completed as previously described [24]. Briefly, operational taxonomic units (OTUs) were generated according to 97% sequence similarity via usearch version 11.0.667 and given taxonomic classifications per the RDP classifier [25, 26]. A minimum of 12 000 amplicons per sample were generated (minimum, 12 196; maximum, 421 831; median, 50 356; Supplementary Figure 1).
Metabolomics for Bile Acid Metabolite Evaluation
Stool samples were weighed, aliquoted, and solubilized with a 10-μL volume of methanol per 1 mg of stool. The mixture was incubated overnight at 4 °C, underwent ultrasonification for 5 minutes, and was centrifuged at 10 000 g for 3 minutes. The supernatant from each sample was transferred to a new tube and analyzed by liquid chromatography–tandem mass spectrometry for analysis of unconjugated primary bile acids (cholic [CA] and chenodeoxycholic [CDCA]) and secondary bile acids (deoxycholic [DCA], lithocholic [LCA], and ursodeoxycholic) as previously described [27]. The final concentration of each bile acid was normalized by the corresponding stool sample weight.
Statistical Analysis
The sample size of 8 per group was based on prior antibiotic microbiome studies with similar patient populations and study designs [28, 29]. All analyses were conducted in R programming version 4.3.2 (R Core Team). Microbial diversity estimates were assessed via alpha and beta diversity per the vegan package [30]. Alpha diversity was measured with the Shannon diversity index following rarefaction, which was performed with the rarefy_even_depth function within the phyloseq package [31]. Beta diversity was determined per the Aitchison distance metric generated with euclidean distance and center log-ratio transformation. Permutational multivariate analysis of variance with adonis2 and the strata argument from the vegan package was used to identify cluster-specific variation observed in the euclidean distance matrix. A Wilcoxon signed rank test was used to compare diversity estimates and changes in bile acid metabolite concentrations (normalized by stool weight) between time points. Differential relative abundance analysis of OTUs was assessed by the ALDEx2 package [32], with multiple comparisons per the paired.test parameter corrected via the Benjamini-Hochberg (BH) method.
RESULTS
This study randomized 16 participants aged 26 ± 5 years (mean ± SD) to receive moxifloxacin (n = 8) or vancomycin (n = 8). The first patient was enrolled 12 October 2020 and the last patient completed follow-up on 23 September 2021. Seven participants (43.75%) provided a stool sample for all 13 time points, 4 (25%) provided 12 samples, 4 (25%) provided 10 samples, and 1 (6.25%) provided 9 samples. No participants were lost to follow-up. In both groups, 5 of 8 (62.5%) participants were male, and all were omnivores. Participants randomized to the moxifloxacin group were all Asian (100%), while those in the vancomycin group were predominantly White (50%; Table 1). Moxifloxacin was generally well tolerated, with no participants requiring drug discontinuation. Of 8 participants, 7 reported a mild drug-related adverse event, most commonly nausea (n = 7), dyspepsia (n = 4), or vomiting (n = 2). The safety and tolerance of vancomycin have been reported [22].
Baseline Demographics for Participants Stratified by Antibiotic Therapy
| Moxifloxacin (n = 8) | Vancomycin (n = 8) | P Valuea | |
|---|---|---|---|
| Age, y | 27.9 ± 4.0 | 24.6 ± 5.6 | .21 |
| Body mass index | 26.08 ± 4.2 | 23.85 ± 4.2 | .30 |
| Sex | >.99 | ||
| Male | 5 (62.5) | 5 (62.5) | |
| Female | 3 (37.5) | 3 (37.5) | |
| Race | .026 | ||
| White | 0 (0.0) | 4 (50.0) | |
| Asian | 8 (100.0) | 3 (37.5) | |
| Black | 0 (0.0) | 1 (12.5) | |
| Ethnicity | .20 | ||
| Non-Hispanic | 8 (100.0) | 5 (62.5) | |
| Hispanic | 0 (0.0) | 3 (37.5) | |
| Diet | >.99 | ||
| Omnivore | 8 (100.0) | 7 (87.5) | |
| Vegetarian | 0 (0.0) | 1 (12.5) |
Data are presented as No. (%) or mean ± SD.
aP values were determined by a Fisher exact test for categorical variables and a Student t test for continuous variables.
Microbial Perturbations With Antibiotic Therapy
For the 16 participants, 16S rRNA sequencing was conducted for 188 fecal samples detecting 7231 unique OTUs. No significant difference in alpha diversity was observed at baseline between the therapy groups (P = .7984; Figure 1A), confirming successful randomization. However, significant differences were observed during therapy (P < .0005). Overall significant differences in microbial compositions were observed between all samples from the moxifloxacin and vancomycin study arms (permutational multivariate analysis of variance, P = .001; test of homogeneity, P = .001; Figure 1B). Longitudinal analysis at the phylum level showed minimal changes during moxifloxacin therapy (Figure 1C). Conversely, vancomycin therapy showed an increase in Proteobacteria (yellow) that started on D2 of therapy and persisted until D13.

Gut microbial perturbations differ between moxifloxacin and vancomycin therapy. A, Alpha diversity comparison per the Shannon diversity metric reveals no significant difference at baseline (day 0 [D0]) and end of therapy (D13 and D30). Significant alpha diversity differences were observed during therapy (D1–D10) between moxifloxacin and vancomycin, with lower diversity observed for vancomycin as compared with moxifloxacin. Data are presented as median (line), IQR (box), and 95% CI (error bars). B, Compositional differences based on the Aitchison distance metric reveal significant differences between moxifloxacin and vancomycin (permutational multivariate analysis of variance, P < .05) at all sample time points. Test of homogeneity also reveals significant compositional differences within treatment groups (P < .05). C, Stacked bar plot represents the composition of bacterial taxa for each healthy volunteer with moxifloxacin or vancomycin therapy. Data illustrate that the Bacteroidetes taxa (green) is predominant among participants treated with moxifloxacin, while Proteobacteria (yellow) dominates for those treated with vancomycin, specifically during therapy. ***P < .0005. NS, nonsignificant (P > .05); PCA, principal component analysis; PERMANOVA, permutational multivariate analysis of variance; TH, test of homogeneity.
Participants randomized to the moxifloxacin group did not exhibit clustering by longitudinal time point groupings (Figure 2A). To prevent overrepresentation in the during-therapy and end-of-therapy time points in our analyses, D5 was chosen as being representative of the during-therapy categorization and D30 for end of therapy. D0, D5, and D30 had stool samples available for all 8 participants across both antibiotic arms (Supplementary Figure 2). Additionally, Supplementary Figure 3 demonstrates that the impact of the antibiotic perturbation on the microbiome had stabilized for vancomycin, making the comparisons generalizable to the rest of the during-therapy time points.
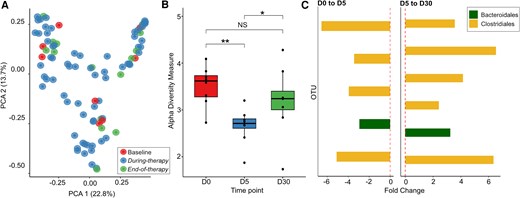
Minimal microbial perturbations with moxifloxacin therapy among healthy volunteers. A, Principal component analysis plot demonstrates no apparent clustering among time points: baseline, during therapy, and end of therapy. B, Alpha diversity plots based on Shannon diversity metrics show significant differences (Wilcoxon rank sum, P < .05) in diversity between baseline and day 5 (D5) and between D5 and D30, with no significant difference between baseline and D30. Data are presented as median (line), IQR (box), and 95% CI (error bars). C, Differential expression abundance analysis per ALDEx2 identified limited OTUs that were significantly different (P < .05; Benjamini-Hochberg, P > .05) from D0 to D5 and from D5 to D30. Additionally, there were no significantly different OTUs between D0 and D30. Each bar represents a unique OTU, and OTUs that were significantly differentially abundant for both comparisons (D0 vs D5 and D5 vs D30) belonged predominantly to the Clostridiales order (gold), which decreased in abundance from D0 to D5 and increased from D5 to D30. *P < .05. **P < .005. NS, nonsignificant (P > .05); OTU, operational taxonomic unit; PCA, principal component analysis.
For moxifloxacin, alpha diversity comparisons revealed significant differences between baseline (D0) and D5 (P = .0030) and between D5 and D30 (P = .028), while no significant difference was observed between D0 and D30 (P = .38; Figure 2B). Beta diversity comparisons showed no significant differences across time points (D0 vs D5, P = .278; D5 vs D30, P = .383; D0 vs D30, P = .991; Supplementary Figure 4). Differential abundance analyses based on ALDEx2 did not identify any OTUs that passed BH correction; however, OTUs with P < .05 primarily belonged to the Clostridiales order, specifically taxa from the Lachnospiraceae and Ruminococcaceae families (Figure 2C, Supplementary Tables 1 and 2), which decreased in abundance from D0 to D5 (Supplementary Figure 5A) and increased from D5 to D30 (Supplementary Figure 5B). Differential abundance values reported from ALDEx2 are reported in the supplementary material, representing the median difference between center log-ratio–transformed abundance values between the specified conditions (D0 vs D5, D5 vs D30, or D0 vs D30).
For participants randomized to vancomycin, clustering by therapy group and time point was observed (Figure 3A). Alpha diversity significantly differed across all time points compared: D0 vs D5 (P = .00016), D5 vs D30 (P = .00016), and D0 vs D30 (P = .028; Figure 3B). Additionally, beta diversity significantly differed across all time points: D0 vs D5 (P = .0010), D5 vs D30 (P = .0010; Figure 3C), and D0 vs D30 (P = .010; Supplementary Figure 6). ALDEx2 differential abundance analysis comparing D0 and D5 identified an increase in species from the Enterobacterales order, including Enterobacter, Escherichia/Shigella, Erwinia, unclassified Enterobacteriaceae, with all passing BH correction (P < .05; Supplementary Table 3, Supplementary Figure 7). No taxa passed BH correction for comparisons between D5 and D30 and between D0 and D30. Overarchingly, OTUs with P < .05 across D0, D5, and D30—despite not passing BH correction (P > .05)—predominately belonged to the Clostridiales order (Figure 3D, Supplementary Tables 4 and 5).

Significant gut microbial perturbations with vancomycin therapy among healthy volunteers. A, Principal component analysis demonstrates unique clustering by therapy group (i). Time point–specific comparisons exhibit unique clusters, with day 5 (D5) clustering separately than baseline (D0) and end of therapy (D30) (ii). B, Alpha diversity comparisons across D0, D5, and D30 reveal significant differences between Shannon diversity metrics for D0 vs D5, D5 vs D30, and D0 vs D30 (Wilcoxon rank sum, P < .05). Data are presented as median (line), IQR (box), and 95% CI (error bars). C, Beta diversity comparison reveals significant compositional differences between D0 and D5 and between D5 and D30 (Pr[>f] < .05). D, Each bar represents a unique OTU. OTUs significantly changing across longitudinal time points primarily belonged to the Clostridiales order (yellow bar). A decrease in relative abundance was observed from D0 to D5, while an increase was observed from D5 to D30. **P < .005. ***P < .0005. NS, nonsignificant (P > .05); OTU, operational taxonomic unit; PCA, principal component analysis; PCoA, principal coordinate analysis; PERMANOVA, permutational multivariate analysis of variance.
Considering that Clostridiales was the most prevalent taxa with significant changes in abundance between the therapy groups, their relative changes were further assessed (Figure 4A). In participants administered vancomycin, average Clostridiales abundance decreased following antibiotic initiation up to D3 of therapy, after which it fell below the limit of detection and remained undetectable until D13. By D30, Clostridiales abundance was nearly reestablished to baseline. In contrast, participants receiving moxifloxacin showed a decrease in average Clostridiales abundance until D5, followed by a steady increase from D5 to D30. Within the moxifloxacin group, a statistically significant difference in relative abundance of Clostridiales was observed between D0 and D5 (P = .05; Figure 4B), although no significant differences were observed between D0 and D30 (P = .38) and D5 and D30 (P = .10). This trend was mirrored but more attenuated in the vancomycin group (Figure 4C), which reached statistical significance between D0 and D5 (P = .00016) and D5 and D30 (P = .00016).

Longitudinal assessment of relative Clostridiales abundance within each treatment group. A, Averaged relative abundance of OTUs belonging to the Clostridiales order plotted by antibiotic treatment groups over time. B and C, Box-and-whisker plots demonstrate the relative abundance of Clostridiales for the moxifloxacin and vancomycin treatment groups. Data are presented as median (line), IQR (box), and 95% CI (error bars). Time point representatives were used for specific comparisons: baseline (day 0 [D0]), during antibiotic therapy (D5), and end of therapy (D30). *P < .05. ***P < .0005. NS, nonsignificant (P > .05); OTU, operational taxonomic unit.
Metabolomic Assessment of Bile Acid Metabolite Changes
Metabolomics was utilized to measure bile acid concentration changes with antibiotic therapy. Metabolites of interest included primary bile acids (CA and CDCA) and secondary bile acids (DCA, LCA, ursodeoxycholic, and hyodeoxycholic ). The average proportional abundance of each metabolite by time point is illustrated in Figure 5. The average concentration of primary bile acids (nanograms per milligram; CA and CDCA) remained relatively consistent across longitudinal time points for both therapy groups (Figure 6A and 6B). In the moxifloxacin group, secondary bile acids (DCA and LCA) decreased from D0 to D7 and increased thereafter until D30 (Figure 6C and 6D). In contrast, DCA and LCA concentrations with vancomycin therapy decreased until D2 and D3, respectively, and remained reduced until D30. For both primary bile acids, no significant difference was observed, although an increase in concentration was visually evident from D0 to D5 for patients taking moxifloxacin (Figure 6E and 6F). Alternatively, patients taking vancomycin saw a significant increase in both primary bile acids from D0 to D5 (CA, P = .0080; CDCA, P = .0080). Regarding secondary bile acids, a decrease in concentration was observed from D0 to D5 for participants taking moxifloxacin; statistical significance was reached for LCA (P = .039) but not DCA (P = .078; Figure 6G and 6H). Similarly, a significant decrease in secondary bile acids was observed with vancomycin therapy (LCA, P = .0080; DCA, P = .0080).
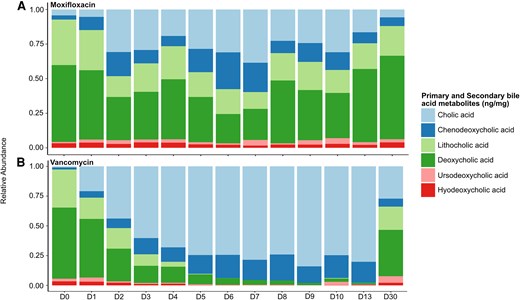
Metabolite proportional concentrations across study time points. A and B, Stacked bar plots illustrate the average proportional concentration of bile acids (primary, blue bars; secondary, green and red bars) across all study time points for the moxifloxacin and vancomycin therapy groups.
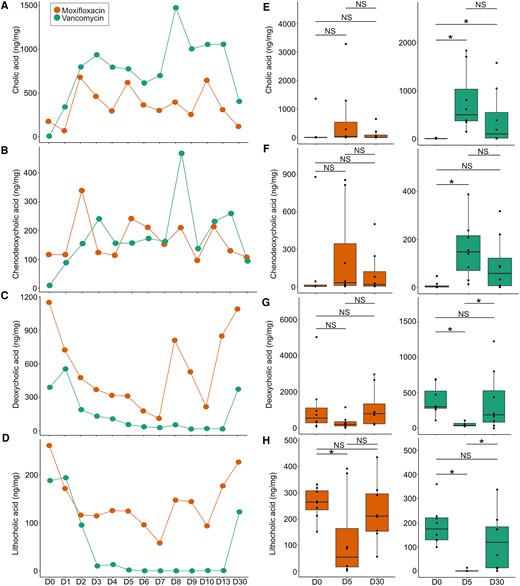
Significant variation in bile acid metabolites between moxifloxacin and vancomycin treatment. Line graphs illustrate the average concentration changes for bile acids longitudinally: A and B, primary; C and D, secondary. E and F, Univariate analysis (Wilcoxon rank sum test) comparing day 0 (D0), D5, and D30 illustrates a nonsignificant increase in primary bile acids (cholic and chenodeoxycholic) in the moxifloxacin treatment group but a significant increase in the vancomycin treatment group. G, A nonsignificant decrease in deoxycholic acid was observed for participants in the moxifloxacin treatment group. H, Conversely, a significant decrease was observed in lithocholic acid. Both deoxycholic and lithocholic significantly decreased in participants in the vancomycin treatment group. Data are presented as median (line), IQR (box), and 95% CI (error bars). *P < .05. NS, nonsignificant (P > .05).
DISCUSSION
Among healthy volunteers randomized to moxifloxacin or oral vancomycin therapy, notable changes were observed in the gut microbiome and metabolomic profiles. For participants receiving moxifloxacin, minimal changes in alpha diversity occurred between the longitudinal sampling time points. However, differential abundance analysis identified significant changes in key species belonging to the Clostridiales order. Participants receiving vancomycin showed time point–specific clustering, with the during-therapy representative time point (D5) exhibiting distinct clustering patterns as compared with baseline and end of therapy (D30). Alpha diversity also demonstrated significant differences following comparison across all time points. Differential abundance analysis revealed that Clostridiales was the predominant taxa significantly changing, with vancomycin exhibiting a greater magnitude of change as compared with moxifloxacin.
Clostridiales is an order that contains a bile acid–inducible operon responsible for the dehydroxylation of primary bile acids CA and CDCA to secondary bile acids DCA and LCA, respectively [33]. For both antibiotic groups, the concentrations of primary bile acids remained reasonably constant across all time points, while secondary bile acids DCA and LCA decreased until D7 with moxifloxacin therapy and increased thereafter. With vancomycin therapy, secondary bile acids decreased until D3, remained below the limit of detection until D13, and returned near baseline concentrations by D30. The presence of DCA and LCA has been implicated in hindering C difficile spore germination and growth, conferring colonization resistance to enteric pathogens such as C difficile [33, 34]. In this study, the period of decreased DCA and LCA during moxifloxacin therapy likely represents a window of increased susceptibility to CDI. An epidemiologic study during the peak of the RT 027 epidemic in Quebec, Canada, found that hospitalized patients colonized primarily with RT 027 strains progressed to CDI more rapidly than patients with community-onset CDI with non–RT 027 strains [11]. Also, susceptibility to CDI following antibiotic treatment was previously characterized by reduced concentrations of secondary bile acids in a mouse model [35]. Therefore, our observations of a short window of vulnerability with reduced secondary metabolites may help explain the high-risk association of moxifloxacin and other second-generation fluoroquinolones with the RT 027 epidemic [18–20]. While the concomitant use of other antibiotics can increase this risk, it is noteworthy that this effect was observed in healthy volunteers without recent antibiotic exposure. This demonstrates that moxifloxacin monotherapy may incur a short-term risk of CDI in susceptible patients.
This study has limitations. The small sample size affected our ability to identify all significant differences at the family or genus level. Larger studies with healthy volunteers are needed to identify microbial differences at these levels. However, vancomycin as a comparator microbiome-disrupting agent provides contextual understanding of microbiome disruption between studies even with smaller sample sizes. For example, our prior study with omadacycline as compared with vancomycin showed a shorter window of microbiome vulnerability, similar to our findings with moxifloxacin [22]. We did not measure moxifloxacin concentrations in the stool, but prior studies demonstrated high concentrations due to the fecal excretion route [36]. Our participant population was relatively homogeneous in terms of race, ethnicity, and diet, which precluded our ability to assess for the impact of these variables in our regression models. Although future studies with different races and ethnicities, ages, and diets are warranted, the microbiome changes caused by antibiotics are likely much more substantial than those caused by diet or other factors. Our results also show that changes in secondary bile acids correlate with the changes in Clostridiales abundance in these participants. Future studies will be needed to mechanistically understand these microbe-metabolomic interactions, which could lead to diagnostics or therapies aimed at detecting or modifying these changes. For example, Clostridiales abundance correlates with urinary metabolite 3-indoxyl sulfate, which could serve as a microbial biomarker in future studies [37, 38]. The mechanistic understandings derived from these phase 1 healthy-volunteer studies also provide testable hypotheses for future phase 2 studies. We chose 2 time points as compared with baseline due to availability of samples; as such, earlier or later perturbations may be informative. This healthy-volunteer study without C difficile exposure cannot establish causality, which will need to be investigated in future studies.
In conclusion, moxifloxacin use was associated with specific microbiome and metabolomic changes increasing CDI risk albeit for a shorter period than vancomycin. This window of vulnerability may help to explain the risk of fluoroquinolones with the faster germination time for RT 027 strains. Phase 2 studies are warranted to better understand the mechanistic effects of antibiotics on CDI risk.
Supplementary Data
Supplementary materials are available at The Journal of Infectious Diseases online (http://jid.oxfordjournals.org/). Supplementary materials consist of data provided by the author that are published to benefit the reader. The posted materials are not copyedited. The contents of all supplementary data are the sole responsibility of the authors. Questions or messages regarding errors should be addressed to the author.
Notes
Acknowledgments. The Texas Children's Hospital Department of Pathology and Immunology provides salary support to staff of the Metabolomics and Proteomics Mass Spectrometry Laboratory, Texas Children's Microbiome Center (T. D. H. and S. J. H.).
Author contributions. All listed authors contributed intellectually and approved the final version of the submitted manuscript. J. J. contributed to the enrollment of patients. All authors contributed to the acquisition and analysis of data and interpretation of results. K. W. G. and B. M. H contributed acquisition of funding. H. A., B. M. H., and K. W. G. wrote the first draft of the manuscript.
Data availability. Sequence Read Archive data for the 16S sequences used in this study are available on NCBI, BioProject, PRJNA1196963. Biosample labels that correspond to participant labels in this project are available in the supplementary material (Supplementary Table 6). R programming scripts containing our analysis pipeline are available at https://github.com/Hanson-Lab/publications/tree/main/moxifloxacin_paper.
Financial support. This work was supported by Paratek Pharmaceuticals, Inc as an investigator-initiated grant (G0505124 to K. W. G.); by a University of Houston New Investigator Award (to J. J.); and by the National Institute of Allergy and Infectious Diseases, National Institutes of Health (1P01AI152999 to B. M. H., 2R01AI139261 and T32AI141349 to K. W. G.).
References
Author notes
Potential conflicts of interest. K. W. G. has received additional research grants paid to his institution from Acurx Pharmaceuticals, Seres Therapeutics, and Vendanta Biosciences. T. D. H. is a member of the editorial advisory board and is contracted as an associate editor with the STAR Protocols journal (Cell Press). All other authors report no potential conflicts.


