


Abstract
The impact of long-acting injectable cabotegravir plus rilpivirine (CAB/RPV) on rectal human immunodeficiency virus 1 (HIV-1) RNA dynamics and the factors associated with viral shedding remain poorly understood.
This prospective study evaluated HIV-1 RNA dynamics by analyzing sequential paired plasma and rectal fluid samples from virologically suppressed individuals who transitioned from oral antiretroviral therapy (ART) to every-2-month CAB/RPV (preceded or not by oral lead-in), over a 9-month follow-up period. RPV trough concentrations were measured in 384 rectal samples.
In total, 597 plasma and 561 rectal samples from 90 participants were analyzed. HIV-1 RNA >50 (>1.69 log10) copies/swab was detected in 14.7% (59/401) of rectal samples (42.2% of participants) during intramuscular CAB/RPV, and in 17.5% (28/160) of rectal samples (29% of participants) during oral ART. Median detectable rectal HIV-1 RNA level during intramuscular ART was 362 (range, 133–2216) copies/swab. The frequency and quantity of rectal shedding did not differ between groups with/without oral lead-in. No correlation was observed between rectal shedding and detectable plasma HIV-1 RNA. Median rectal RPV concentration was 3.07 (quartile 1–quartile 3, 2.83–3.35) log10 ng/swab, 1.6-fold above the 90% maximum effective concentration (EC90) for rectal tissue, and did not correlate with rectal HIV-1 RNA levels. Rectal shedding was associated with plasma pre-ART HIV-1 RNA >5 log10 in multivariate Cox regression, but was unrelated to established predictors of virological failure with CAB/RPV.
Rectal HIV-1 shedding is common during bimonthly intramuscular CAB/RPV treatment and is also observed with oral ART. Shedding was independent of concurrent plasma HIV-1 RNA and rectal RPV concentrations, and was associated with pre-ART viral load.
The long-acting (LA) cabotegravir (CAB) plus rilpivirine (RPV) regimen represents an innovative antiretroviral option for the treatment of human immunodeficiency virus (HIV). Phase 3 trials have shown high virological control rates with monthly or bimonthly intramuscular administration, demonstrating noninferiority to daily oral 3-drug regimens [1–3]. Viral suppression is critical for health and preventing transmission, but the “HIV undetectable equals untransmittable” principle is primarily based on oral antiretroviral therapy (ART) studies [4, 5]. Whether this assumption can be extrapolated to intramuscular LA ART remains to be confirmed.
Data on HIV-1 RNA dynamics in transmission-associated anatomical sites for parenteral CAB plus RPV are scarce. The only study involving the rectal compartment examined participants receiving monthly intramuscular ART with CAB plus RPV [6]. The once-monthly schedule is not available in Europe and the United Kingdom, where only the bimonthly regimen is marketed. Compared to monthly dosing, the bimonthly schedule has been associated with higher virologic failure rates [7] and breakthrough infections in HIV preexposure prophylaxis (PrEP) [8]. Given the increased rectal viral shedding seen with daily oral ART and monthly LA CAB plus RPV [6, 9–12], evaluating bimonthly efficacy in this compartment is crucial for transmission risk assessment.
Low CAB and RPV concentrations correlate with virological failure [13]. PrEP studies have explored pharmacokinetics in transmission-relevant sites, typically after a single intramuscular dose [14–17], but pharmacokinetics and pharmacodynamics in the rectum under a bimonthly regimen remain unknown. The impact of oral lead-in CAB and RPV on rectal HIV-1 RNA dynamics also warrants investigation.
Our goal was to assess the effects of long-acting ART on HIV-1 dynamics within the rectal compartment. We prospectively analyzed HIV-1 RNA levels and RPV concentrations in paired plasma and rectal fluid samples from a cohort of virologically suppressed people with HIV (PWH) transitioning from standard oral ART to bimonthly intramuscular CAB and RPV, with or without an oral lead-in phase. By analyzing sequential paired plasma and rectal fluid samples, the study sought to characterize viral dynamics across treatment phases, recognizing that differences in sampling frequency between the oral and intramuscular phases preclude direct aggregated comparisons. We also investigated factors associated with rectal HIV-1 RNA shedding. As a secondary objective, we compared HIV-1 RNA dynamics in the rectal compartment during the intramuscular phase between individuals who received the oral lead-in and those who did not.
METHODS
Study Design and Participants
This prospective observational study enrolled adult (aged ≥18 years) PWH with viral suppression (HIV-1 RNA <50 copies/mL) switching from different oral standard-of-care regimens to CAB plus RPV LA administered every 2 months. Exclusion criteria were pregnancy and lactation, chronic hepatitis B infection, and virologic failure with nonnucleoside reverse transcriptase inhibitors or integrase strand transfer inhibitors. Eligible participants entered the study in 2 sequential groups, based on the time period of their enrollment. The first group (January to April 2023) switched directly from their oral ART to injection, receiving a second dose 1 month after the initial injection, followed by subsequent doses every 2 months. The second group (May to July 2023) received a 4-week oral lead-in phase with daily CAB 30 mg plus RPV 25 mg, before their first injection. The study was conducted at Hospital General Universitario de Elche. The local Ethics Committee of Hospital General de Elche approved the study and all participants provided written informed consent.
Study Procedures
From 24 January 2023 to 28 July 2023, all eligible individuals who expressed willingness to initiate LA CAB plus RPV were invited to enroll in the study. Participants were invited to undergo high-resolution anoscopy for rectal secretion sampling using flocked swabs (cone-shaped FLOQSwab, Copan Flock Technologies SRL) for HIV-1 RNA measurement, and samples were processed as previously described [9]. Each rectal swab was placed into 2 mL of transport and preservation medium (eNAT tube; Copan Italia SpA) and immediately frozen at −80°C. Rectal and plasma samples were collected from all participants before each injection in both the lead-in and non-lead-in groups at the following time points: 4 weeks before the first set of intramuscular injections (week −4), on day 1 (baseline visit, the day of the first intramuscular CAB plus RPV injections), 1 month after the injections (month 1, the day of the second set of intramuscular injections), and every 2 months thereafter until month 9 after the first injections (Supplementary Figure 1). Samples were frozen and stored at −80°C until use.
Laboratory Assessments
In plasma and rectal swabs, HIV-1 RNA was quantified using the COBAS HIV-1 test in a Cobas 6800 System (Roche Diagnostics, SL), and the lower limits of detection (LOD) were established at 20 copies/mL and 50 copies/swab, respectively. For consistency, the terms “undetectable levels” and “virological suppression” will refer to the LOD of HIV-1 RNA < 50 (1.69 log10) copies/mL and copies/swab in the plasma and rectal compartments, respectively. Virologic failure was defined as either 2 consecutive viral loads ≥200 copies/mL or a single viral load ≥1000 copies/mL in plasma samples.
Rectal swabs in the 2 mL collection tubes were warmed, thoroughly mixed by vortexing for 1 minute, and then centrifuged at 3500g for 5 minutes to remove fecal matter and suspended particles. Eight hundred and eighty microliters of supernatant was diluted with Cobas omni Specimen Diluent (dilution factor 1:1.25). The Cobas results were multiplied by 2.5 to obtain the correct viral load results (the 1:2 preserving dilution for rectal swab plus the 1:1.25 polymerase chain reaction [PCR] analysis dilution meant a 2.5 final dilution factor). Results were expressed in copies/swab (final LOD for rectal viral load was 50 copies/swab).
To simplify long-acting pharmacokinetic evaluation, we chose to analyze RPV levels due to its greater variability in rectal fluid compared to plasma, potential dilution by luminal intestinal fluid despite high tissue concentrations, and the lack of direct PrEP experience, which raises questions about its role in reducing transmission risk. Rectal fluid RPV concentrations were analyzed by the Services of the Institute for Research, Development and Innovation in Health Biotechnology of Elche (IDiBE) via liquid chromatography with tandem mass spectrometry (LC–MS/MS). Protein precipitation pretreatment was performed for measuring total RPV concentration. RPV concentrations were expressed in ng/swab (see the Supplementary Material for more detail).
Statistical Analysis
Descriptive statistics for demographic and clinical variables were performed using frequency distributions for categorical variables and median and interquartile range (IQR) for continuous variables. Coefficients of variation for duplicate analyses of RPV concentrations on the same sample were calculated. For the primary objective—to evaluate HIV-1 RNA dynamics in the rectal compartment and plasma among individuals transitioning from oral ART to every-2-months intramuscular CAB/RPV—we analyzed sequential paired plasma and rectal fluid samples from both the oral and intramuscular ART phases. The oral phase included plasma and rectal samples collected 4 weeks before, and on the day of the first intramuscular injection. This phase combined samples from both the oral ART prior to CAB/RPV switch, as well as the oral lead-in phase. The intramuscular phase involved sample collection 1 month after the initial injection, followed by bimonthly sampling over a 9-month follow-up period. Due to differences in sampling frequency between the oral and intramuscular phases, direct aggregated comparisons between these phases were not performed. χ2 test or Fisher exact test were used for group comparisons of categorical variables and Mann-Whitney U test, Student t test, or Kruskal-Wallis test for group comparisons of continuous variables. Generalized linear mixed models and linear mixed models, both using the Wald test, were employed for group comparisons of categorical and continuous variables, respectively, accounting for repeated measures within patients. McNemar test was used to assess concordance between plasma and rectal HIV-1 viral loads. Cox regression models were run to investigate the baseline factors associated with the occurrence of a first episode of detectable rectal HIV-1 RNA, and mixed effects Cox regression was applied to analyze the added effect of repeated measures of RPV rectal levels in the predictive models of rectal shedding. All analyses were conducted using R software version 4.0.3 (R-Core Team 2020, R-4.1.2.1).
RESULTS
Study Population and Baseline Characteristics
A total of 597 plasma and 561 (536 paired) rectal samples from 90 participants were analyzed. Paired plasma and rectal samples were collected up to month 7 in 80 (88.9%) participants, and up to month 9 in 71 (78.9%) participants. Median age was 47 years (IQR, 37–52 years), 10 (11.1%) were female, and 78 (86.7%) were White, non-Hispanic. Median time since HIV diagnosis was 10.4 years (IQR, 4.7–19.2 years), median time with virological suppression was 4.9 years (IQR, 2.6–13.4 years), and nadir and baseline CD4+ T cells were 272 cells/µL (IQR, 182–459 cells/µL) and 724 cells/µL (IQR, 519–955 cells/µL), respectively (Table 1). Overall, 32 (35.6%) participants entered the study having previously received an oral lead-in with CAB plus RPV for 4 weeks, and 58 (64.4%) switched directly to injection. The most frequent prior antiretroviral regimens were dolutegravir/lamivudine in 23 (25.6%) participants and dolutegravir/RPV in 21 (23.3%) participants (Table 1).
Baseline Characteristics of Study Participants
| Characteristic | All Participants | Lead-In Group | Non-Lead-In Group | P |
|---|---|---|---|---|
| n | 90 | 32 | 58 | |
| Age, y, median (IQR) | 47 (37–52) | 47 (38–53) | 47 (36–52) | .774a |
| Sex, female, n (%) | 10 (11.1) | 4 (12.5) | 6 (10.3) | .709b |
| HIV risk factor, n (%) | .285b | |||
| MSM | 59 (65.6) | 19 (21.1) | 40 (68.9) | |
| Heterosexual | 12 (13.3) | 3 (3.3) | 9 (15.5) | |
| IDU | 8 (8.9) | 5 (5.6) | 3 (5.2) | |
| Unknown | 11 (12.2) | 5 (5.6) | 6 (10.3) | |
| Race, n (%) | .527b | |||
| Black/Latino | 12 (13.3) | 3 (8.4) | 9 (18.4) | |
| White | 78 (86.7) | 29 (90.6) | 49 (84.5) | |
| Weight, kg, median (IQR) | 75.0 (66.0–82.9) | 25.5 (23.6–28.3) | 24.9 (22.5–27.6) | .580c |
| BMI, median (IQR) | 24.9 (22.8–27.9) | 25.5 (23.6–28.3) | 24.9 (22.5–27.6) | .580c |
| Smoker, n (%) | 37 (41.1) | 18 (56.3) | 19 (32.8) | .001b |
| Unknown | 6 (6.7) | 1 (3.1) | 5 (8.6) | |
| Alcohol consumption, n (%) | 16 (17.8) | 10 (31.3) | 6 (10.3) | .001b |
| Unknown | 15 (16.7) | 5 (5.6) | 10 (17.2) | |
| Time since HIV diagnosis, y, median (IQR) | 10.4 (4.7–19.2) | 9.2 (4.8–20.7) | 11.4 (4.6–19.2) | .813c |
| Time with HIV-1 viral load <50 copies/mL, y, median (IQR) | 4.89 (2.55–13.37) | 5.73 (4.36–12.6) | 4.54 (1.77–13.65) | .360c |
| HIV-1 viral load at diagnosis, copies/mL, median (IQR) | 4.79 (4.43–5.20) | 4.77 (4.35–5.15) | 4.95 (4.48–5.41) | .298c |
| HIV-1 RNA >5.0 log10 copies/mL at diagnosis, n (%) | 27 (38.7) | 9 (34.6) | 18 (42.9) | .675d |
| Nadir CD4 T-cell count, cell/µL, median (IQR) | 272 (182–459) | 300 (205–495) | 262 (180–382) | .383c |
| CD4 T-cell count, cell/µL, median (IQR) | 724 (519–955) | 720 (625–956) | 743 (504–951) | .444c |
| CD8 T-cell count, cell/µL, median (IQR) | 800 (556–986) | 706 (560–829) | 864 (554–999) | .313c |
| CD4/CD8 ratio, median (IQR) | 0.99 (0.74–1.36) | 1.04 (0.78–1.38) | .95 (0.72–1.30) | .261c |
| HIV subtype, n (%) | .007b | |||
| B | 43 (47.8) | 14 (43.8) | 29 (50.0) | |
| Non-B | 10 (11.1) | 8 (25.0) | 2 (3.4) | |
| Unknown | 37 (41.1) | 10 (31.3) | 27 (46.7) | |
| Preswitch regimen, n (%) | .159b | |||
| INSTI + 2 NRTI | 21 (23.3) | 7 (21.9) | 14 (24.1) | |
| NNRTI + 2 NRTI | 17 (18.9) | 5 (5.6) | 12 (20.7) | |
| PI + 2 NRTI | 4 (4.4) | 2 (6.3) | 2 (3.4) | |
| DTG/3TC | 23 (25.6) | 7 (21.9) | 13 (22.4) | |
| DTG/RPV | 21 (23.3) | 7 (21.9) | 14 (24.1) | |
| 2-drug regimen other than DTG/3TC or DTG/RPV | 4 (4.4) | 4 (12.5) | 0 | |
| Presence of RPV mutations, n (%)e | 5 (8.2) | 0 | 5 (13.5) | .146b |
Abbreviations: BMI, body mass index; DTG, dolutegravir; IDU, injection drug use; INSTI, integrase strand transfer inhibitor; IQR, interquartile range; MSM, men who have sex with men; NNRTI, nonnucleoside reverse transcriptase inhibitors; NRTI, nucleoside reverse transcriptase inhibitors; PI, protease inhibitor; RPV, rilpivirine; 3TC, lamivudine.
aStudent t test.
bFisher exact test.
cMann-Whitney U test.
dχ2 test.
eRPV mutations 138A, 138A, 138A, 138A + 106I, 138G + 179E all conferred low-level resistance to RPV according to the Stanford University HIV Drug Resistance Database (https://hivdb.stanford.edu/hivdb/by-patterns/).
HIV-1 RNA Levels in Plasma and Rectal Fluid Secretions
Plasma Levels
At baseline, 64 (71.1%) participants showed target not detected (TND) HIV-1 RNA levels, 17 (18.9%) HIV-1 RNA <20 copies/mL, and 9 (10%) HIV-1 RNA >20 and <50 copies/mL, with no participant exhibiting plasma levels ≥50 copies/mL. During the follow-up period under intramuscular ART, 22 of 442 (4.9%) samples, corresponding to 18 (20%) participants, showed intermittent plasma HIV-1 RNA levels ≥50 copies/mL, with median values of 69.5 copies/mL (IQR, 61.3–84 copies/mL) (Figure 1 and Supplementary Table 1). No participants experienced virologic failure. There were no differences during follow-up in the proportion of plasma HIV-1 RNA levels ≥50 copies/mL between the lead-in and non-lead-in groups.
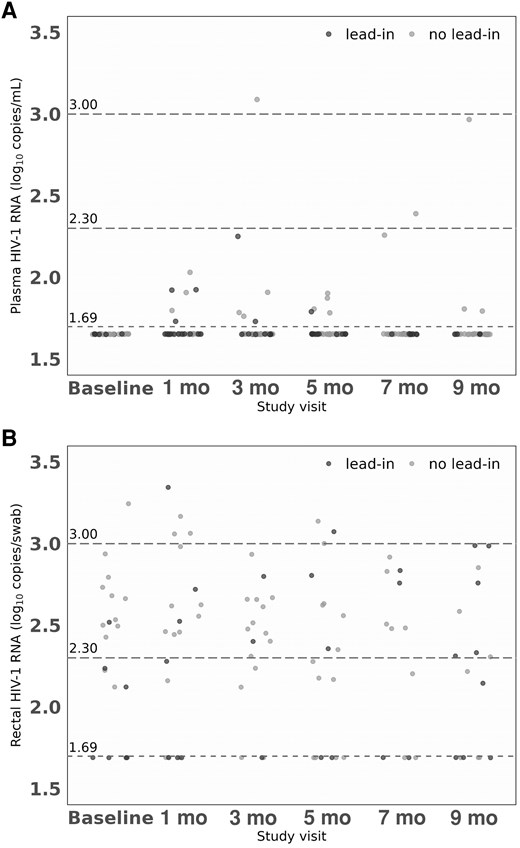
HIV-1 RNA levels in plasma and rectal secretions by study visit: (A) HIV-1 RNA levels in plasma; and (B) HIV-1 RNA levels in rectum. Baseline, at day of first intramuscular injection; and at 1, 3, 5, 7, and 9 months after the first intramuscular injection. The dashed lines represent the limit of detection of HIV-1 RNA < 50 (1.69 log10) copies/mL in plasma and <50 copies/swab in rectum. Limit values of viral load considered of low/lower risk of transmission are also represented in both compartments: 200 (2.30 log10) copies/mL (A) and copies/swab (B) and 1000 (3 log10) copies/mL (A) and copies/swab (B).
Rectal Secretions
Table 2 and Figure 1 show the rectal HIV-1 RNA levels during the study period. Median number of rectal samples per participant was 7 (IQR, 6–7). At the baseline visit, 78.4% of participants exhibited HIV-1 RNA TND, 4.6% had levels below 50 copies/swab, and 17% had levels above 50 copies/swab in the rectal fluid. The majority of participants (79%), from both the lead-in and no-lead-in groups, provided at least 2 consecutive samples 1 month apart (week −4 and baseline visit) while on oral ART, prior to starting LA intramuscular CAB plus RPV. In the analysis including all samples collected during oral ART, 28 of 160 (17.5%), corresponding to 26 (29%) participants, showed detectable HIV-1 RNA levels (>50 copies/swab), with median concentrations of 336 copies/swab (IQR, 234–560; range, 133–2272 copies/swab). During the 9-month follow-up period under intramuscular CAB plus RPV therapy, 59 of 401 (14.7%) samples, corresponding to 38 (42.2%) participants, showed rectal shedding, with median HIV-1 RNA values of 362 copies/swab (IQR, 226–659; range, 133–2216 copies/swab). The percentage of participants exhibiting intermittently detectable HIV-1 RNA levels (>50 copies/swab) at each study visit ranged from 10% to 18% (Table 2), and 14 out of 38 participants (37%) with rectal shedding experienced 2 or more episodes of detectable HIV-1 RNA.
HIV-1 RNA Levels in Rectal Secretions During the Study
| Rectal Viral Load, Copies/Swab | All Participants (n = 90) | Lead-In Group (n = 32) | Non-Lead-In Group (n = 58) | P |
|---|---|---|---|---|
| All study samples | ||||
| (n = 561) | (n = 198) | (n = 363) | .111a | |
| TND | 440 (78.4) | 156 (78.8) | 284 (78.2) | |
| <1.69 log10 | 34 (6.1) | 17 (8.6) | 17 (4.7) | |
| ≥1.69 log10 | 87 (15.5) | 25 (12.6) | 62 (17.1) | |
| ≥1.69 log10, median (IQR) | 345 (226–635) | 345 (215–685) | 345 (256–525) | .188b |
| Week −4 | ||||
| (n = 72) | (n = 30) | (n = 42) | .999c | |
| TND | 54 (75.0) | 23 (76.7) | 31 (73.8) | |
| <1.69 log10 | 5 (6.9) | 2 (6.6) | 3 (7.1) | |
| ≥1.69 log10 | 13 (18.1) | 5 (16.7) | 8 (19.1) | |
| ≥1.69 log10, median (IQR) | 345 (255–708) | 345 (255–708) | 333 (268–458) | .943d |
| Baseline | ||||
| (n = 88) | (n = 30) | (n = 58) | .012c | |
| TND | 69 (78.4) | 23 (76.7) | 46 (79.3) | |
| <1.69 log10 | 4 (4.6) | 4 (13.3) | 0 | |
| ≥1.69 log10 | 15 (17.0) | 3 (10.0) | 12 (20.7) | |
| ≥1.69 log10, median (IQR) | 330 (220–510) | 173 (153–251) | 401 (301–560) | .149d |
| Month 1 | ||||
| (n = 84) | (n = 27) | (n = 57) | .605c | |
| TND | 63 (75.0) | 20 (74.1) | 43 (75.4) | |
| <1.69 log10 | 6 (7.1) | 3 (11.1) | 3 (5.3) | |
| ≥1.69 log10 | 15 (17.9) | 4 (14.8) | 11 (19.3) | |
| ≥1.69 log10, median (IQR) | 415 (289–1053) | 430 (299–958) | 415 (289–1053) | .949d |
| Month 3 | ||||
| (n = 80) | (n = 27) | (n = 53) | .171c | |
| TND | 63 (78.8) | 24 (88.9) | 39 (73.6) | |
| <1.69 log10 | 3 (3.8) | 1 (3.7) | 2 (3.8) | |
| ≥1.69 log10 | 14 (17.5) | 2 (7.4) | 12 (22.6) | |
| ≥1.69 log10, median (IQR) | 314 (263–457) | 441 (347–536) | 314 (240–456) | .607d |
| Month 5 | ||||
| (n = 84) | (n = 30) | (n = 54) | .838c | |
| TND | 66 (78.6) | 25 (83.3) | 41 (75.9) | |
| <1.69 log10 | 6 (7.1) | 2 (6.7) | 4 (7.4) | |
| ≥1.69 log10 | 12 (14.3) | 3 (10.0) | 9 (16.7) | |
| ≥1.69 log10, median (IQR) | 391 (216–731) | 640 (434–912) | 363 (190–430) | .373d |
| Month 7 | ||||
| (n = 81) | (n = 29) | (n = 52) | .694c | |
| TND | 69 (75.2) | 25 (86.2) | 44 (84.6) | |
| <1.69 log10 | 4 (4.9) | 2 (6.9) | 2 (3.9) | |
| ≥1.69 log10 | 8 (9.9) | 2 (6.9) | 6 (11.5) | |
| ≥1.69 log10, median (IQR) | 449 (304–679) | 630 (603–658) | 314 (303–589) | .479d |
| Month 9 | ||||
| (n = 72) | (n = 25) | (n = 47) | .094c | |
| TND | 56 (77.8) | 16 (64.0) | 40 (85.1) | |
| <1.69 log10 | 6 (8.3) | 3 (12.0) | 3 (6.4) | |
| ≥1.69 log10 | 10 (13.9) | 6 (24.0) | 4 (8.5) | |
| ≥1.69 log10, median (IQR) | 300 (203–678) | 395 (208–869) | 294 (193–467) | .609d |
| All intramuscular phase samples | ||||
| (n = 401) | (n = 138) | (n = 263) | .345a | |
| TND | 317 (79.1) | 110 (79.7) | 207 (78.7) | |
| <1.69 log10 | 25 (6.2) | 11 (8.0) | 14 (5.3) | |
| ≥1.69 log10 | 59 (14.7) | 17 (12.3) | 42 (16.0) | |
| ≥1.69 log10, median (IQR) | 362 (226–659) | 575 (228–685) | 344 (232–465) | .179b |
Categorical variables are expressed as number (percentage). 1.69 log10 = 50 copies/swab.
Abbreviations: TND, target not detected; IQR, interquartile range.
aGeneralized linear mixed model with a Wald test accounting for repeated measures within patients.
bLinear mixed model with a Wald test accounting for repeated measures within patients.
cFisher exact test.
dMann-Whitney U test.
The frequency of rectal shedding did not significantly differ between groups based on whether they received oral lead-in treatment, within both the oral and intramuscular ART phases, without directly comparing the 2 phases (Table 2). The median detectable rectal HIV-1 RNA levels were similar in both the lead-in and non-lead-in groups.
In most cases, there was no correlation between rectal shedding and detectable HIV-1 RNA levels in plasma (Supplementary Table 2). Only in 6 paired samples corresponding to 3 (3.3%) participants were rectal HIV-1 RNA levels exceeding 50 copies/swab found alongside concurrent plasma levels exceeding 50 copies/mL, all of them observed in the non-lead-in group.
Clinical characteristics of the 38 participants showing rectal HIV-1 RNA levels >50 copies/swab at any time during intramuscular CAB plus RPV therapy are shown in Table 3. Rectal shedding was associated with female sex, older age, longer duration of HIV-1 infection, a greater proportion of individuals with a nadir CD4 cell count below 200 cell/uL, and higher pretreatment viral load or a viral load >5 log10 copies/mL (Table 3). No relationship was observed between rectal shedding and the body mass index (BMI), HIV subtype, or the presence of minor RPV resistance mutations. The multivariate Cox regression model including the baseline variables with significant association in the univariate analysis showed that HIV-1 plasma viral load >5 log10 at HIV diagnosis was a predictor of rectal shedding (hazard ratio [HR], 3.47; 95% confidence interval [CI], 1.53–7.86) and female sex was marginally associated (HR, 2.49; 95% CI, .94–6.62) (Table 3). The association with sex vanished when the BMI was included in the adjustments (data not shown). Similar trends were obtained for cutoff levels of >200 copies/swab (Supplementary Table 3).
Clinical Characteristics of Participants With and Without Rectal Viral Shedding
| Characteristic | Any HIV-1 RNA ≥ 1.69 log10 Copies/Swab (n = 38) | All HIV-1 RNA < 1.69 log10 Copies/Swab (n = 52) | P | HRa (95% CI) (n = 68) | P | HRb (95% CI) (n = 61) | P |
|---|---|---|---|---|---|---|---|
| Sex, female, n (%) | 8 (21.05) | 2 (3.85) | .016c | 2.49 (0.94–6.62) | .066 | 1.88 (0.43–8.18) | .401 |
| Age, y, median (IQR) | 48 (42–54) | 45 (35–52) | .040d | 0.98 (0.94–1.03) | .452 | 0.97 (0.92–1.03) | .315 |
| BMI, kg/m2, median (IQR) | 26.0 (22.8–28.1) | 24.6 (22.5–26.8) | .332e | ||||
| BMI ≥ 25, n (%) | 20 (52.63) | 19 (36.54) | .512g | ||||
| Time since HIV diagnosis, y, median (IQR) | 15.2 (7.6–20.5) | 7.6 (3.5–13.4) | .003e | 1.05 (0.98–1.12) | .191 | 1.02 (0.94–1.11) | .537 |
| Time with HIV-1 viral load < 50 copies/mL, y, median (IQR) | 11.0 (4.4–14.2) | 4.3 (2.0–10.8) | .011e | 1.02 (0.92–1.13) | .726 | 1.07 (0.96–1.19) | .198 |
| HIV-1 viral load at diagnosis, log10 copies/mL, median (IQR) | 5.17 (4.52–5.49) | 4.65 (4.22–4.99) | .001e | ||||
| ≤5.0 log10 copies/mL, n (%) | 12 (40.00) | 29 (76.32) | .005f | Ref | Ref | ||
| >5.0 log10 copies/mL, n (%) | 18 (60.00) | 9 (23.68) | 3.47 (1.53–7.86) | .002 | 3.03 (1.15–7.99) | .024 | |
| Nadir CD4 cell count, cell/µL, median (IQR) | 225 (142–412) | 301 (215–476) | .075e | ||||
| ≥200 cell/µL, n (%) | 22 (57.89) | 43 (82.69) | .018f | Ref | Ref | ||
| <200 cell/µL, n (%) | 16 (42.11) | 9 (17.31) | 1.35 (0.54–3.35) | .517 | 1.22 (0.40–3.68) | .724 | |
| CD4 cell count, cell/µL, median (IQR) | 838 (654–1035) | 677 (458–914) | .157e | ||||
| CD8 cell count, cell/µL, median (IQR) | 827 (613–977) | 766 (515–987) | .322e | ||||
| CD4/CD8 ratio, median (IQR) | 1.05 (0.81–1.39) | 0.92 (0.73–1.19) | .178e | ||||
| Sexually transmitted infections, n (%) | 2 (5.26) | 6 (11.54) | .459c | ||||
| HIV-1 subtype, n (%) | .159c | ||||||
| B | 17 (44.74) | 27 (51.92) | |||||
| Non-B | 2 (5.26) | 17 (32.69) | |||||
| Unknown | 19 (50.00) | 8 (15.38) | |||||
| Presence of RPV mutations, n (%) | .999c | ||||||
| Yes | 2 (5.3)h | 3 (5.8)i | |||||
| No | 24 (63.2) | 32 (61.5) | |||||
| Unknown | 12 (31.6) | 17 (32.7) | |||||
| RPV concentration, log10 ng/mL, median (IQR) | 3.08 (2.78–3.30) | 3.06 (2.86–3.37) | .329h | 1.09 (.41–2.85) | .857 |
HIV-1 RNA ≥50 copies/swab = 1.69 log10 copies/swab.
Abbreviations: BMI, body mass index; CI, confidence interval; DTG, dolutegravir; HIV, human immunodeficiency virus; MSM, men who have sex with men; RPV, rilpivirine; IQR, interquartile range.
aCox regression model.
bMixed effects Cox regression model with time-dependent covariates and random effects.
cFisher exact test.
dStudent t test.
eMann-Whitney U test.
fχ2 test.
gLinear mixed model with a Wald test accounting for repeated measures within patients.
hRPV mutations 138A and 138A + 106I: all conferred low-level resistance to RPV according to the Stanford University HIV Drug Resistance Database (HIVDB) (https://hivdb.stanford.edu/hivdb/by-patterns/).
iRPV mutations 138A, 138A, 138G + 179E all conferred low-level resistance to RPV according to HIVBD.
Rilpivirine Rectal Concentrations
RPV concentrations were measured in 28 samples collected during the lead-in phase with oral CAB plus RPV and in 346 samples from participants receiving the LA intramuscular regimen. Supplementary Figure 2 shows the median (IQR) trough rectal RPV concentrations during the study period. Median overall rectal RPV concentrations were slightly higher in samples collected during oral CAB plus RPV therapy (median, 3.23; IQR, 3.08–3.51 log10 ng/swab) than in samples from participants receiving the intramuscular regimen (median 3.07; IQR, 2.83–3.35 log10 ng/swab). Coefficients of variation for 2 repeated measurements were 9.3% (IQR, 3.4%–12.6%) and 12.4% (IQR, 5.3%–24.3%) for oral and intramuscular regimens, respectively. Concentrations were also higher in participants who received the oral lead-in at each study visit, with levels exceeding 1.8 times the 90% maximum effective concentration (EC90) for rectal tissue in all cases (Supplementary Table 4).
Figure 2 and Supplementary Table 5 show the rectal trough RPV concentrations by HIV-1 RNA stratum, ranging from <1.69 log10 (<50) copies/swab to >2.69 log10 (>500) copies/swab. No significant differences were found in RPV concentrations between the HIV-1 RNA strata, both in the total samples and by study visit (Figure 2 and Supplementary Table 5). The coefficient of variation ranged from 10% to 13.5%. There were no differences in the RPV concentrations among participants with undetectable and detectable viral load for different cutoff points, including <1.69 log10, < 2.30 log10 (<200), and <2.69 log10 copies/swab (Supplementary Table 6 and Supplementary Figure 3). No correlation was found between rectal RPV concentrations and rectal HIV-1 RNA levels (ρ = 0.019, P = .729). Mixed effects Cox regression model including RPV levels on each visit and the significant baseline variables associated with rectal viral shedding showed that plasma HIV-1 viral load >5 log10 copies/mL at diagnosis remained as a predictor of rectal shedding (HR, 3.03; 95% CI, 1.15–7.99; Table 3).
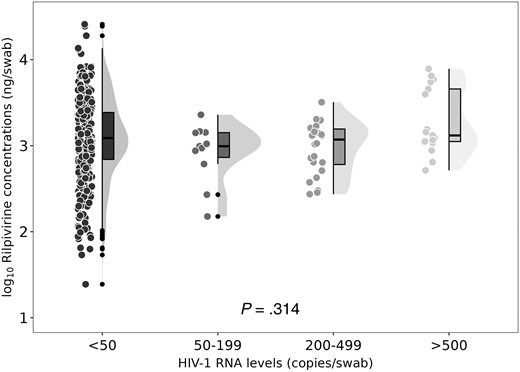
Rectal rilpivirine trough concentrations according to rectal HIV-1 RNA levels. The circles represent individual data observations. The lines and bars form a boxplot displaying the data distribution, including the median, first, and third quartiles. The whiskers extend up to 1.5 times the IQR. The shaded area represents a density distribution plot.
DISCUSSION
In this prospective study, we examined HIV-1 RNA dynamics in the rectal compartment of virologically suppressed PWH switching from oral ART to bimonthly intramuscular CAB and RPV. We found that 40% of participants intermittently showed detectable HIV-1 RNA in their rectal secretions, reaching up to 3 log10 copies/swab both during the oral and the intramuscular ART phases. Rectal shedding was not linked to concurrent plasma HIV-1 RNA levels or rectal RPV concentrations, which were above the EC90 for rectal tissue. Importantly, pre-ART HIV-1 RNA levels in plasma were predictive of rectal shedding during the intramuscular phase, highlighting a key factor influencing viral dynamics in the rectal compartment. While the clinical significance and transmission risk remain uncertain due to the absence of standardized rectal HIV-1 RNA thresholds and variability in detection methods, our findings provide valuable insights into rectal HIV-1 shedding dynamics during long-acting CAB/RPV therapy, highlighting the need for further research to assess its potential implications for HIV transmission and therapeutic monitoring.
The impact of the bimonthly intramuscular CAB plus RPV regimen on rectal HIV-1 RNA dynamics was previously unexamined. Our study found that HIV-1 RNA was undetectable in most rectal samples, but 14% showed viral shedding despite plasma suppression. Similarly, nearly 20% of participants on oral ART had detectable rectal HIV-1 RNA, although comparisons are limited by sample size and follow-up differences. A prior study found similar rectal suppression rates between monthly LA CAB plus RPV and daily oral ART [6]. We also assessed the effect of an oral lead-in with CAB and RPV before intramuscular initiation and found no significant differences.
Most cases of rectal HIV-1 shedding occurred with plasma virologic suppression, consistent with prior reports of higher viral loads in rectal secretions than in plasma or semen [6, 18–20]. Factors contributing to this include latent HIV persistence in gut-associated lymphoid tissue, which comprises up to 85% of lymphoid tissue [21–23], and the rectum's role as a major HIV reservoir with higher CD4+ T-cell–associated HIV DNA than blood [20, 24]. The reported correlation between DNA and RNA levels in rectal biopsies, irrespective of plasma HIV RNA levels, suggests local HIV release from rectal cells [18, 25]. Our findings support the conclusion that the rectal HIV-1 reservoir is distinct from blood reservoirs.
Suboptimal tissue drug levels may allow localized viral replication despite adequate plasma concentrations [26–28]. CAB reaches high rectal fluid levels, exceeding plasma concentrations and remaining above the 90% maximum inhibitory concentration (IC90) threshold for up to 8 weeks postdose [17], supporting its efficacy in PrEP studies [29, 30]. RPV shows more variability, with lower rectal fluid levels despite comparable or higher rectal tissue concentrations [16]. The lack of direct PrEP experience with RPV may raise questions regarding its effectiveness in reducing transmission risk. Our study found no significant association between rectal RPV levels and HIV-1 RNA shedding, with median concentrations exceeding the EC90 for rectal tissue [14, 31, 32]. Detectable rectal HIV-1 RNA despite adequate RPV levels suggests intermittent viral release from rectal CD4+ T cells, consistent with HIV persistence in rectal biopsies despite ART [33].
This study is among the largest examining rectal HIV-1 RNA in virologically suppressed PWH [18]. The high prevalence of episodic rectal shedding contrasts with prior studies [18, 34], possibly due to extensive sampling. Among participants on intramuscular ART, shedding was associated with factors linked to reservoir size, such as high pre-ART viral load, low nadir CD4 count, and longer HIV duration. In adjusted analyses, rectal shedding remained associated with higher pretreatment viral loads, which have been linked to residual viremia [35] and persistent HIV-1 RNA in genital compartments [36, 37]. Established risk factors for LA CAB plus RPV failure, such as HIV-1 subtype, RPV resistance, and BMI [13], showed no association with rectal shedding. These results highlight the importance of reservoir-related factors in rectal HIV-1 persistence [19, 25], suggesting closer monitoring for individuals with high pre-ART viral loads due to potential transmission risk.
Some participants exhibited intermittent high rectal HIV-1 RNA (>2.5–3 log10 copies/mL) on both oral and intramuscular regimens, although its clinical relevance remains uncertain. Plasma HIV-1 RNA <1000 copies/mL confers minimal transmission risk [38], but rectal thresholds are undefined, and measurement disparities complicate comparisons. Additionally, it is unclear how much detected rectal HIV-1 RNA is replication competent. Sources of discordant rectal HIV-1 shedding include intermittent virion release from activated CD4+ T cells and cell-associated RNA from intact proviruses, which are rare under ART [39–42]. T-cell activation due to infection could also trigger replication. While we did not systematically assess rectal sexually transmitted infection (STI) presence, symptomatic STIs were not linked to increased rectal HIV-1 RNA, aligning with prior findings [34, 43]. Local trauma during sexual intercourse can also induce replication. While additional cumulative experience will definitively validate these findings, the PARTNER study involving gay serodifferent couples demonstrated no HIV transmission among suppressed individuals after a median follow-up of 2 years [4].
The reproducibility and generalizability of the results may be compromised by the absence of standardized methods for detecting HIV-1 RNA in compartments beyond plasma. This is a limitation of the study as it hinders the assessment of the significance of rectal viral shedding levels. We did not systematically collect samples to analyze STIs, which might have influenced HIV-1 shedding. The replication competence/infectivity of the HIV-1 RNA detected in the rectum has not been analyzed. Participants were not randomly assigned to lead-in versus non-lead-in and, additionally, samples from participants receiving intramuscular ART were overrepresented compared to those from participants on oral therapy. The small number of discordant plasma and rectal pairs limits the statistical power of McNemar test to assess differences between groups. As we performed multiple significance tests for each analysis without adjusting for multiple comparisons, this may increase the risk of type I errors, and we acknowledge this as a limitation. Additionally, the majority of participants were older, white men from Spain, which may limit the generalizability of our findings to more diverse populations. The longitudinal collection of multiple consecutive rectal samples over a prolonged period to measure HIV-1 RNA and RPV concentrations is a strength of the study. The study provides novel information about the pharmacodynamics of the bimonthly long-acting CAB plus RPV regimen within the rectal compartment, along with the pharmacokinetics of RPV in the rectum, which could have implications for future therapeutic strategies and for understanding HIV transmission risks. Further research is needed to determine the clinical significance of rectal HIV-1 RNA, refine detection methodologies, and assess whether these findings could influence HIV prevention and treatment guidelines.
In conclusion, intermittent rectal HIV-1 RNA shedding is common among virologically suppressed PWH who switch to bimonthly intramuscular CAB and RPV. Shedding was also observed in patients receiving oral ART. RPV concentrations in the rectum with the bimonthly regimen exceed the EC90 for rectal tissue and show no correlation with rectal shedding. A high pre-ART viral load, but not concurrent plasma HIV-1 RNA levels, predicts rectal HIV-1 RNA detection.
Supplementary Data
Supplementary materials are available at The Journal of Infectious Diseases online (http://jid.oxfordjournals.org/). Supplementary materials consist of data provided by the author that are published to benefit the reader. The posted materials are not copyedited. The contents of all supplementary data are the sole responsibility of the authors. Questions or messages regarding errors should be addressed to the author.
Notes
Author contributions. M. M. contributed conceptualization (lead), methodology (lead), writing the original draft (lead), funding acquisition, project administration, and supervision. M. F. G. contributed resources, project administration (supporting), data curation (supporting), and manuscript review and editing (equal). C. L. contributed methodology (supporting), data curation (supporting), and manuscript review and editing (equal). M. L. E. contributed plasma drug concentrations measurements, and manuscript review and editing (equal). N. G. performed virological measurements, and manuscript review and editing (equal). P. M., J. G. A., and L. L. performed data curation (supporting), and manuscript review and editing (equal). M. B. contributed data curation (supporting), and manuscript review and editing (equal). S. P. contributed methodology (supporting), data curation (supporting), and manuscript review and editing (equal). F. G. contributed conceptualization (lead), methodology (lead), writing the original draft (supporting), manuscript review and editing (equal), funding acquisition, project administration, and supervision.
Data sharing. The data that support this work are available from the corresponding author upon reasonable request.
Financial support. This work was supported by Consorcio Centro de Investigación Biomédica en Red (grant number CB21/13/00011); Ministerio de Ciencia e Innovación, European Union NextGenerationEU; and Instituto de Salud Carlos III (grant number PI22/01949).
References
Author notes
Potential conflicts of interest. All authors: No reported conflicts of interest. All authors have submitted the ICMJE Form for Disclosure of Potential Conflicts of Interest. Conflicts that the editors consider relevant to the content of the manuscript have been disclosed.

