


Abstract
This study explores the relationship between influenza infection, both clinically diagnosed in primary care and laboratory confirmed in hospital, and atherothrombotic events (acute myocardial infarction and ischemic stroke) in Spain. A population-based self-controlled case series design was used with individual-level data from electronic registries (n = 2 230 015). The risk of atherothrombotic events in subjects ≥50 years old increased more than 2-fold during the 14 days after the mildest influenza cases in patients with fewer risk factors and more than 4-fold after severe cases in the most vulnerable patients, remaining in them more than 2-fold for 2 months. The transient increase of the association, its gradient after influenza infection, and the demonstration by 4 different sensitivity analyses provide further evidence supporting causality. This work reinforces the official recommendations for influenza prevention in at-risk groups and should also increase the awareness of even milder influenza infection and its possible complications in the general population.
Cardiovascular diseases (CVDs) are the leading cause of death globally, accounting for 32% of all deaths worldwide in 2019 [1]. There is growing evidence that respiratory infections, especially influenza, can trigger or aggravate CVDs [2–5]. Influenza affects 5%–15% of the population yearly [6] and 290 000–650 000 of cases result in death [7]. These estimates do not consider deaths from other diseases such as CVDs, which can be influenza related [8].
Although the association between influenza and acute cardiovascular events (ACVEs) seems to be well established, there are significant methodological aspects that could be biasing the results [3, 9–16]. First, some studies lacked individual-level information of influenza and ACVE [17, 18]. Second, studies restricting to laboratory-confirmed influenza (LCI) cases are prone to selection bias and therefore, not generalizable for 2 main reasons: (1) laboratory testing is mainly performed on individuals with a severe infection or underlying risk factors for severe disease [3, 10–12, 19], and (2) likelihood of undergoing an influenza test (exposure) may be linked to an ACVE (outcome) by clinical practice [20]. Therefore, studies with robust methodologies, and including severe and milder cases of influenza, would provide further evidence of possible causality between influenza and increased ACVEs risk.
The biological mechanism by which influenza virus triggers ACVEs is still unknown [21]. Among the postulated hypotheses, influenza might exacerbate vascular atherosclerosis by activating inflammatory pathways [22], destabilizing preexisting atherosclerosis plaques, or elevating macrophage circulation in arteries [23, 24]. Experiments on apolipoprotein-deficient mice (a well-established mouse model of atherosclerosis) showed that infection with influenza virus promotes inflammatory cell infiltration, smooth muscle cell proliferation, and fibrin deposition in atherosclerotic plaques [25].
On the other hand, if influenza is one of the triggers of ACVEs, its prevention through vaccination could also prevent and reduce CVD burden. Despite attempts to establish a correlation between influenza vaccination and reduced risk of ACVEs in people with preexisting CVD or those with comorbidities [9, 26–28], evidence gaps still remain [17, 24, 26, 29, 30]. A better understanding of the effects of influenza infection on CVD would help to better target influenza vaccination programs.
This study aims to further explore the relationship between influenza infection, considering both clinically diagnosed influenza (CDI) in primary care (PC) setting and LCI in hospital setting, and ACVEs (acute myocardial infarction [AMI] and ischemic stroke).
METHODS
Study Design, Setting, and Population
This was a population based, retrospective, self-controlled case series (SCCS) study using electronic healthcare registries from the Valencia Health System Integrated Database (VID) [31]. In the SCCS design, individuals act as their own control, avoiding confusion for individuals’ differences in baseline time-invariant characteristic [32].
The index date was the date of influenza diagnosis in PC for CDI cases or the date of sampling for LCI cases [3, 12]. We estimated the incidence rate ratios (IRR) of ACVE during a 90-day period after the index date (risk period), compared with all other periods of no exposure (baseline periods) (Figure 1). Additionally, the 90-day risk period (during which an acute inflammatory stimulus such as influenza infection could provoke a systemic effect according to Warren-Gash et al [33]) was divided into 1–7, 8–14, 15–29, 30–60, and 61–90 days. When less than 30 days elapsed between 2 influenza episodes, they were considered the same episode and the index date was the earliest, with priority given to LCI over CDI records (Figure 1).
![Illustration of the self-controlled case series design used in the study, Valencia region, 1 January 2011 to 31 December 2018. Adapted from Ohland et al [12]. Abbreviations: CDI, clinically diagnosed influenza; LCI, laboratory-confirmed influenza; LCNI, laboratory-confirmed negative for influenza.](https://oup.silverchair-cdn.com/oup/backfile/Content_public/Journal/jid/230/3/10.1093_infdis_jiae070/1/m_jiae070f1.jpeg?Expires=1748874462&Signature=GG5yA9eQqTPYipD5tixbmUXwxLdnaIzK2CekGk~N3epXUpsEc4ZnyKSxoNH0TQKZJ6NPjoy8ebM1mJLTPPk~oaWHBk~YjbgQZPU0M2cOyZ5T14VdakgUuelxvPAyVs1bKuPmU2d0FSiErOt1N5gdx0loXDA1klOulO~H4zFldb-1x3QHLuiCs0Um8SNBKXRnPLRIrTZoH8JEyAITtDQFhP7PD1b4gP1kQRCUvThn92m81cfTs1FForUI1jJo5EFD8vbwYOSwB~Wcndg7Lgd6eKrmzLA7jbK7Ld0Kh1CVqlO8YxJI96OM4AVzoMRRR4V7kU1pYZ2DLfmaJDkEDJAQ6Q__&Key-Pair-Id=APKAIE5G5CRDK6RD3PGA)
Illustration of the self-controlled case series design used in the study, Valencia region, 1 January 2011 to 31 December 2018. Adapted from Ohland et al [12]. Abbreviations: CDI, clinically diagnosed influenza; LCI, laboratory-confirmed influenza; LCNI, laboratory-confirmed negative for influenza.
A 15-day washout period, including day 0 (index date) and the preceding 14 days, was excluded from the baseline. The reason was that an ACVE occurring in this time interval could affect the subsequent likelihood of undergoing an influenza test and being diagnosed [12, 33].
The outcomes, that is atherothrombotic ACVEs (AMI and ischemic stroke), were defined as all hospitalizations related with the following International Classification of Diseases (ICD) codes reached in the minimum basic data set (MBDS): 410.xx, I21.xx, I22.xx, 411.xx, I24.xx, 434.0, 434.9, 436, I63.0x, I63.2x, I63.3x, I63.5x, I63.8x, and I66. All cases spaced at least 1 month apart in the study period were considered as a new ACVE.
Three different exposures to influenza were studied: (1) CDI, referred to all PC and specialist visits related to influenza ICD-9 and ICD-10 codes (487.x, 488.xx, J09.xx, J10.xx, and J11.xx) without laboratory confirmation; (2) LCI encompassed all positive laboratory results for influenza recorded in all hospitals of the region; and (3) laboratory-confirmed negative for influenza (LCNI) encompassed all negative laboratory results for influenza recorded in the Microbiological Surveillance Network (RedMIVA) from hospitals throughout the region.
The design accounted for multiple influenza exposures and ACVEs per patient during the observation period. Only 1 influenza diagnosis per subject and season was considered.
The overall study population included (1) all subjects aged ≥50 years living in the Valencia region and registered in VID (more than 98%) from 1 January 2011 through 31 December 2018; (2) with more than 6 months of enrolment in VID; and (3) with no more than 1 episode of influenza in consecutive seasons, less than 90 days apart (to avoid overlapping of 2 risk periods). Of them, 3 subpopulations were considered, each consisting of individuals with at least one ACVE and with at least (1) one CDI, (2) one LCI, or (3) one LCNI, respectively, within the observation period (see flowchart in Figure 2).
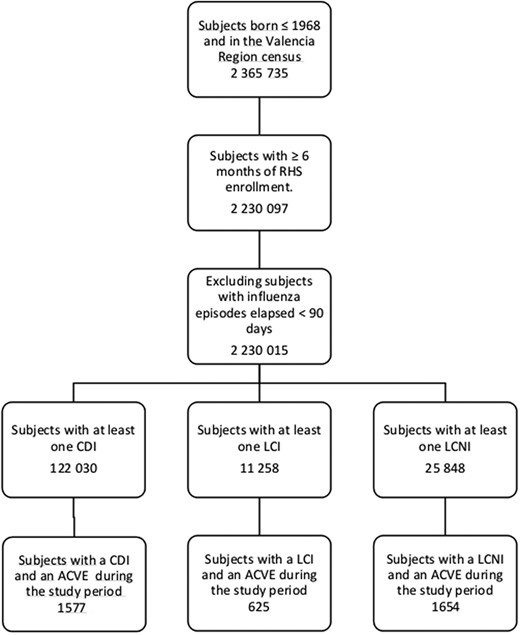
Flowchart with individuals included in the study, Valencia region, 1 January 2011 to 31 December 2018 (n = 2 365 735 individuals). Abbreviations: ACVE, acute cardiovascular event; CDI, clinically diagnosed influenza; LCI, laboratory-confirmed influenza; LCNI, laboratory-confirmed negative for influenza; RHS, regional health system.
Data Sources
VID is composed of a set of multiple data sources described elsewhere [31], including (1) the regional population-based administrative database; (2) the Ambulatory Care Information System (SIA), containing medical information for each patient attended in the PC setting (general practitioners and specialists); (3) the MBDS, which collects all discharge diagnosis and procedures from hospitalizations; and (4) the RedMIVA containing the results (positive and negative) of the microbiological analyses performed in the Valencian Health System. Both SIA and MBDS used the International Classification of Diseases, Ninth/Tenth Revision, Clinical Modification coding system (ICD-CM) for codification. All these registries can be linked at the individual level through a unique personal identification number.
Statistical Analysis
Characteristics were described for the overall study population and for the SCCS populations, by frequencies and proportions in the case of categorical/discrete variables, and by means, standard deviations, medians, and interquartile ranges for continuous variables.
Rates of ACVE during risk periods (1–7, 8–14, 15–29, 30–60, and 61–90 days) following the index date were compared with baseline period by a Poisson regression model. Because the basic SCCS design does not account for time-varying variables, the model was adjusted by age (stratified in age groups 50–54, 55–59, 60–64, 65–69, 70–74, 75–79, ≥ 80 years) and by season (period from September 1 to August 31 of the following year for 7 seasons) [12]. A robust variance estimator, known as the sandwich estimator, was used to correct the IRR to account for recurrent events [34]. The same analysis was performed for the 3 influenza exposure definitions (CDI, LCI, and LCNI) in the population aged ≥ 50 years and in the subgroup aged ≥ 65 years.
Sensitivity Analysis
Four sensitivity analysis were performed: (1) by adjusting by calendar month; (2) by considering the observation period as the interval from 1 year before to 1 year after the index date; (3) by excluding patients with recurrent events; and (4) by excluding patients who died within 30 days of the exposure.
Adjustments (1) and (2) were implemented to minimize potential remaining confounding by time-dependent factors other than age and season [3]. Adjustment (3) was applied because SCCS assumes that events occurring within individuals at different times are independent [19]. Although in the main analysis we employed the sandwich estimator to account for the correlation between recurrent events in the same individual [34], we wanted to investigate any potential remaining bias. Adjustment (4) was applied because an increased risk of death is to be expected after an ACVE. By excluding patients who died within 30 days of the index date we aimed to analyze the potential bias introduced in the SCCS design by censoring the follow-up of individuals at death [32].
Ethical Considerations
This study protocol is observational in design. It uses retrospective anonymized nonidentifiable data transferred from the Valencia Ministry of Health to the research team in agreement with the Spanish laws and institutional requirements. The protocol was approved by the Ethics Committee of Arnau de Vilanova Hospital of Valencia. According to Spanish law, informed consent is exempt for this kind of register-based research and the Ethics Committee accepted the exemption.
RESULTS
Baseline Characteristics of the Study Population
From the 2 365 735 subjects ≥50 years old, 2 230 015 met the inclusion criteria to constitute the overall study population (see flowchart in Figure 2). Of these, 7% had a flu diagnosis or a flu test recorded during the study period; 122 030 (5.5%) had at least 1 CDI and 37 106 (1.7%) were tested for influenza at a hospital, with 11 258 (30%) positive results. Supplementary Figure 1 shows the distribution of influenza (CDI and LCI) and LCNI episodes, by calendar month in the Valencia region during the study period. SCCS populations were composed of 1577, 625, and 1654 subjects with at least 1 CDI, LCI, and LCNI, respectively, and an ACVE during the study period.
Demographic characteristics of the overall and the CDI, LCI, and LCNI populations are described in Table 1. Of the overall population, 53% were women, and this percentage was reduced to 33%–36% in the SCCS populations. In comparison with overall and CDI populations, patients with LCI or LCNI showed higher mean age (62 and 64 years for overall and CDI vs 70 years for LCI and LCNI), higher mortality rates (14% and 18% vs 43% and 52%), higher percentage of patients with 4 or more comorbidities (11% and 31% vs 54% and 53%), and greater percentage of patients with 2 or more ACVEs (<0.4% and 9.7% vs 24.2% and 22.2%), respectively.
Baseline Characteristics of the Overall Population, and Patients With at Least 1 CDI, LCI, or LCNI, Who Also Had at Least 1 ACVE Within the Observation Period (SCCS Populations), Valencia Region, 2011–2018
| Characteristic | Overall (n = 2 230 015) | CDI (n = 1577) | LCI (n = 625) | LCNI (n = 1654) |
|---|---|---|---|---|
| Sex, No. (%) | ||||
| Male | 1 047 415 (47) | 1050 (67) | 403 (64) | 1083 (65) |
| Female | 1 182 600 (53) | 527 (33) | 222 (36) | 571 (35) |
| Age, y | ||||
| Mean (SD) | 62 (12) | 64 (10) | 70 (10) | 70 (10) |
| Median (IQR) | 59 (50–70) | 63 (55–71) | 71 (63–77) | 72 (63–78) |
| Range | 50–111 | 50–93 | 50–95 | 50–95 |
| Comorbidities, No. (%) | ||||
| DM | 473 589 (21) | 807 (51) | 400 (64) | 998 (60) |
| COPD | 182 297 (8.2) | 299 (19) | 252 (40) | 713 (43) |
| Liver disease | 125 561 (5.6) | 177 (11) | 68 (11) | 234 (14) |
| Kidney disease | 205 565 (9.2) | 376 (24) | 290 (46) | 852 (52) |
| Obesity | 278 701 (12) | 458 (29) | 177 (28) | 434 (26) |
| Chronic CVD | 1 200 873 (54) | 1389 (88) | 602 (96) | 1572 (95) |
| Immunodeficiency | 484 688 (22) | 465 (29) | 241 (38) | 652 (39) |
| Number of comorbidities, No. (%) | ||||
| 0 | 701 108 (31) | 56 (4) | 5 (1) | 15 (0.9) |
| 1 | 545 313 (25) | 289 (18) | 33 (5) | 96 (5.8) |
| 2 | 438 425 (20) | 378 (24) | 112 (18) | 276 (16.7) |
| 3 | 292 476 (13) | 364 (23) | 136 (22) | 394 (23.8) |
| 4 | 158 259 (7) | 250 (16) | 171 (27) | 376 (22.7) |
| >5 | 94 434 (4) | 240 (15) | 168 (27) | 497 (30.1) |
| Death, No. (%) | 309 708 (14) | 277 (18) | 270 (43) | 854 (52) |
| Number of ACVE, No. (%) | ||||
| 0 | 2 189 680 (98) | … | … | … |
| 1 | 36 317 (1.6) | 1425 (90.3) | 474 (75.8) | 1287 (77.8) |
| 2 | 3384 (0.2) | 132 (8.4) | 117 (18.7) | 299 (18) |
| 3 | 505 (<0.1) | 17 (1.1) | 26 (4.2) | 49 (3.0) |
| >4 | 129 (<0.1) | 3 (0.2) | 8 (1.3) | 19 (1.2) |
Abbreviations: ACVE, acute cardiovascular event; CDI, clinically diagnosed influenza; CVD, cardiovascular disease; DM, diabetes mellitus; IQR, interquartile range; LCI, laboratory-confirmed influenza; LCNI, laboratory-confirmed negative for influenza; SCCS, self-controlled case series.
Risk of ACVEs After Influenza
In the population with CDI, there were 84 ACVEs during the 90-day risk period after CDI and 1618 during the baseline (Table 2). Stratification by subperiods of risk showed that IRR of ACVE were 2.21 (95% confidence interval [CI], 1.22–4.00) and 2.62 (95% CI, 1.51–4.52) during periods 1–7 and 8–14 days, respectively. No significant increase was observed on days 15 through 29 (1.13; 95% CI, .64–1.99), on days 30 through 60 (1.01; 95% CI, .66–1.54), or on days 61 through 90 (1.25; 95% CI, .85–1.83) after CDI.
Age- and Season-Adjusted IRR for ACVEs in Periods After CDI, LCI, and LCNI Compared With Baseline Periods, in the Whole SCCS populations (≥ 50 Years) and in the Subgroups ≥ 65 Years, Valencia Region, 2011–2018
| Days After Sample Collection/Clinical Diagnosis | CDI | LCI | LCNI | |||
|---|---|---|---|---|---|---|
| ACVE | IRR (95% CI) | ACVE | IRR (95% CI) | ACVE | IRR (95% CI) | |
| Age ≥ 50 y (n = 3318) | ||||||
| Baseline | 1618 | 1 | 558 | 1 | 1467 | 1 |
| 1–7 | 11 | 2.21 (1.22–4.00) | 8 | 4.4 (2.16–8.97) | 27 | 5.16 (3.52–7.55) |
| 8–14 | 13 | 2.62 (1.51–4.52) | 9 | 5.09 (2.63–9.86) | 21 | 4.19 (2.72–6.45) |
| 15–29 | 12 | 1.13 (.64–1.99) | 9 | 2.47 (1.27–4.79) | 25 | 2.45 (1.65–3.64) |
| 30–60 | 22 | 1.01 (.66–1.54) | 16 | 2.24 (1.34–3.74) | 50 | 2.55 (1.93–3.39) |
| 60–90 | 26 | 1.25 (.85–1.83) | 6 | 0.91 (.40–2.04) | 30 | 1.68 (1.17–2.42) |
| Age ≥ 65 y (n = 2303) | ||||||
| Baseline | 920 | 1 | 437 | 1 | 1199 | 1 |
| 1–7 | 7 | 2.56 (1.21–5.38) | 8 | 5.48 (2.67–11.24) | 19 | 4.17 (2.65–6.56) |
| 8–14 | 7 | 2.57 (1.22–5.4) | 8 | 5.66 (2.79–11.45) | 15 | 3.42 (2.05–5.71) |
| 15–29 | 9 | 1.55 (.81–2.98) | 8 | 2.76 (1.36–5.57) | 19 | 2.13 (1.35–3.36) |
| 30–60 | 11 | 0.92 (.51–1.66) | 14 | 2.48 (1.43–4.29) | 44 | 2.59 (1.92–3.5) |
| 61–90 | 16 | 1.4 (.85–2.29) | 5 | 0.95 (.39–2.33) | 26 | 1.68 (1.14–2.48) |
Abbreviations: ACVE, acute cardiovascular event; CDI, clinically diagnosed influenza; CI, confidence interval; IRR, incidence rate ratio; LCI, laboratory-confirmed influenza; LCNI, laboratory-confirmed negative for influenza; SCCS, self-controlled case series.
In the population with LCI, there were 48 ACVEs during the 90-day risk period after LCI and 558 during the baseline. IRR of ACVEs were significantly elevated during the 60-day risk period following an LCI, with values of 4.4 (95% CI, 2.16–8.97), 5.09 (95% CI, 2.63–9.86), 2.47 (95% CI, 1.27–4.79), and 2.24 (95% CI, 1.34–3.74) during 1–7, 8–14, 15–29, and 30–60 days, respectively. No significant increase was observed during the 61 to 90-day risk period after LCI (0.91; 95% CI, .4–2.04).
In the population with LCNI, there were 153 ACVEs during the 90-day risk period after LCNI and 1467 during the baseline. IRR of ACVEs were significantly elevated during the 90-day risk period following a LCNI, with values of 5.16 (95% CI, 3.52–7.55), 4.19 (95% CI, 2.72–6.45), 2.45 (95% CI, 1.65–3.64), 2.55 (95% CI, 1.93–3.39), and 1.68 (95% CI, 1.17–2.42) during 1–7, 8–14, 15–29, 30–60, and 61–90 days, respectively.
When the subgroup over 65 years of age was analyzed, IRR of ACVEs increased (in comparison with the overall ≥ 50 years old populations) during the 7-day risk period after a CDI and during the 60-day risk period after an LCI, contrary to the decrease observed in IRRs during the 29-day risk period after LCNI (Table 2).
Sensitivity Analyses
The results were consistent across the 4 sensitivity analysis (Table 3). In sensitivity analysis 1, in which adjustment was made by calendar month, and 2, when the baseline interval was limited from 1 year before to 1 year after the index date, the IRRs remained practically unchanged compared to the main analysis. In sensitivity analyses 3 and 4, in which patients with recurrent ACVEs and patients who died within 30 days of exposure were excluded, the results were in the same direction as those obtained in the main model, except that in some cases the lower limit of the confidence interval was slightly less than 1 due to the small sample size. For instance, the IRR of ACVEs was not significantly elevated during the first 7 days after a CDI (1.20; 95% CI, .50–2.90) in sensitivity analysis 3, but it was again significantly elevated from day 8 to 14 after CDI (2.41; 95% CI, 1.29–4.49). The same occurred in sensitivity analysis 4, during 1–7 and 30–60 day-periods after LCI, where IRRs were 2.67 (95% CI, .99–7.26) and 1.68 (95% CI, .88–3.2), respectively.
Sensitivity Analysis Adjusting by Calendar Month, Limiting the Observation Period to the Interval From 1 Year Before to 1 Year After the Index Date, Excluding Patients With Recurrent ACVEs, and Excluding Patients Who Died Within 30 Days of CDI (n = 87), LCI (n = 73), and LCNI (n = 220)
| Days After Sample Collection/Clinical Diagnosis | CDI | LCI | LCNI | |||
|---|---|---|---|---|---|---|
| ACVE | IRR (CI 95%) | ACVE | IRR (CI 95%) | ACVE | IRR (CI 95%) | |
| Sensitivity analysis adjusting by calendar month | ||||||
| Baseline | 1618 | 1 | 558 | 1 | 1467 | 1 |
| 1–7 | 11 | 2.06 (1.13–3.76) | 8 | 4.42 (2.16–9.05) | 27 | 4.84 (3.29–7.11) |
| 8–14 | 13 | 2.43 (1.4–4.21) | 9 | 5.14 (2.61–10.11) | 21 | 3.95 (2.54–6.12) |
| 15–29 | 12 | 1.04 (.59–1.85) | 9 | 2.52 (1.28–4.97) | 25 | 2.34 (1.57–3.49) |
| 30–60 | 22 | 0.92 (.6–1.41) | 16 | 2.32 (1.35–3.97) | 50 | 2.54 (1.91–3.38) |
| 61–90 | 26 | 1.17 (.79–1.73) | 6 | 0.94 (.41–2.14) | 30 | 1.74 (1.21–2.51) |
| Sensitivity analysis limiting the observation period to the interval from 1 y before to 1 y after the index date | ||||||
| Baseline | 437 | 1 (Ref) | 179 | 1 (Ref) | 508 | 1 (Ref) |
| 1–7 | 11 | 2.35 (1.29–4.27) | 8 | 4.09 (2.00–8.40) | 27 | 4.32 (2.94–6.35) |
| 8–14 | 13 | 2.78 (1.60–4.82) | 9 | 4.72 (2.43–9.16) | 21 | 3.51 (2.27–5.44) |
| 15–29 | 12 | 1.20 (.68–2.13) | 9 | 2.28 (1.17–4.46) | 25 | 2.04 (1.36–3.05) |
| 30–60 | 22 | 1.07 (.70–1.64) | 16 | 2.04 (1.22–3.44) | 50 | 2.09 (1.57–2.78) |
| 61–90 | 26 | 1.32 (.89–1.95) | 6 | 0.83 (.36–1.89) | 30 | 1.37 (.95–1.97) |
| Sensitivity analysis excluding patients with recurrent ACVEs (n = 2855) | ||||||
| Baseline | 1348 | 1 | 411 | 1 | 1008 | 1 |
| 1–7 | 5 | 1.20 (.50–2.90) | 5 | 3.96 (1.62–9.67) | 13 | 3.60 (2.08–6.24) |
| 8–14 | 10 | 2.41 (1.29–4.49) | 6 | 4.87 (2.19–10.84) | 14 | 4.05 (2.39–6.87) |
| 15–29 | 5 | 0.57 (.23–1.36) | 6 | 2.37 (1.04–5.41) | 18 | 2.56 (1.60–4.09) |
| 30–60 | 15 | 0.83 (.50–1.37) | 10 | 2.03 (1.07–3.84) | 34 | 2.54 (1.80–3.58) |
| 61–90 | 21 | 1.21 (.78–1.86) | 3 | 0.66 (.21–2.06) | 14 | 1.15 (.68–1.95) |
| Sensitivity analysis excluding patients who died within 30 d of CDI or LCI compared with baseline time (n = 3057) | ||||||
| Baseline | 1535 | 1 | 511 | 1 | 1342 | 1 |
| 1–7 | 10 | 2.15 (1.15–4) | 4 | 2.67 (.99–7.26) | 16 | 3.68 (2.25–6.03) |
| 8–14 | 10 | 2.15 (1.15–4.01) | 7 | 4.8 (2.28–10.1) | 15 | 3.59 (2.16–5.98) |
| 15–29 | 8 | 0.81 (.4–1.61) | 8 | 2.64 (1.31–5.32) | 15 | 1.76 (1.05–2.93) |
| 30–60 | 20 | 0.98 (.63–1.52) | 10 | 1.68 (.88–3.2) | 36 | 2.18 (1.57–3.04) |
| 61–90 | 21 | 1.07 (.7–1.65) | 5 | 0.9 (.37–2.19) | 25 | 1.66 (1.11–2.46) |
Abbreviations: ACVE, acute cardiovascular event; CDI, clinically diagnosed influenza; CI, confidence interval; IRR, incidence rate ratio; LCI, laboratory-confirmed influenza; LCNI, laboratory-confirmed negative for influenza; Ref, reference.
LCNI also showed a similar association with ACVEs in the sensitivity analyses. Only in the sensitivity analysis 2 and 3, the decrease in the number of cases resulted in a loss of significance of the association in the last period after LCNI (61–90 days), with IRRs of 1.37 (95% CI, .95–1.97) and 1.15 (95% CI, .68–1.95), respectively.
DISCUSSION
To our knowledge, this is the first population-based study in Spain to comprehensively analyze the association between influenza infections and acute atherothrombotic events, considering both CDI in PC setting and LCI in hospital setting, and using individual-level data by means of an SCCS design. Additionally, the association between ACVEs and laboratory-confirmed negative influenza cases was studied.
The main findings of this study are the following: (1) patients sampled for laboratory confirmation of influenza in a hospital encounter, either with positive (LCI) or negative results (LCNI) were older, with more comorbidities and higher mortality rates than the overall and CDI populations; (2) influenza was associated with an increased risk of ACVEs in a time-dependent manner, and the association was robustly demonstrated using 4 different sensitivity analysis; (3) less severe cases of influenza in persons with fewer risk factors (CDI) were associated with more than twice the risk of admission with an ACVE during the 14 days after infection; (4) more severe cases in persons with a more compromised health status (LCI) showed 4–5 times more risk of ACVE during the 14-day risk period, decreasing thereafter, but remaining in them more than 2-fold for 2 months post-LCI; (5) the IRR of ACVE were higher in subjects aged ≥ 65 years; and (6) the association of LCNI and ACVE was comparable to LCI but longer lasting (3 months). These data suggest, on the one hand, that the magnitude of the association found between LCI and ACVEs could be an underestimate, and, on the other hand, that as shown before, infection with respiratory viruses and bacteria other than influenza might also increase the risk of ACVEs [12, 19, 35, 36].
Since the first paper in which Kwong et al found an association between LCI and AMI in Canada [3], several studies have reproduced their results with data from Scotland [19], Denmark [12] and the United States [11]. The authors state that their results were only applicable to the most severe cases of influenza and/or the most vulnerable patients, which are the cases in which professionals are most likely to request laboratory confirmation [3, 11, 12]. Moreover, these studies are expected to be subject to selection bias because ACVE (outcome) usually increases the probability of being tested for influenza (exposure) [20]. This was our rationale for using 2 influenza definitions: CDI registered at PC is more representative of milder influenza infections in healthier patients, whereas LCI represents more severe hospital-treated infections in more vulnerable patients. Although the CDI definition lacks laboratory confirmation, we used influenza-related ICD codes, instead of the less specific influenza-like illness definition commonly used [5, 33, 37]. In addition, the fact that the maximum number of episodes for the 3 exposure definitions studied (CDI, LCI, and LCNI) occurred in the same months, gives reliability to our definition of CDI. Therefore, our results also highlight the importance of less severe influenza infections as potential triggers of atherothrombotic events for 2 weeks after infections in persons with fewer risk factors, which should increase the general population's awareness of influenza infection and its potential complications.
The transient increase in the risk of ACVE and its gradient after influenza infection make a causal relationship more likely. However, this is difficult to demonstrate by an observational study [9, 19]. The period with increased risk of ACVEs was longer after LCI (2 months) than CDI (14 days), and the longest was observed after LCNI (3 months). LCNI may include missed cases (swab taken too late to detect the virus) and false negatives of influenza. In which case, our results would imply an underestimation of the true association between influenza and ACVEs. But LCNI infections might also have been caused by other agents such as Streptococcus pneumoniae, that have been previously associated with AMI and stroke up to 3 months after infection [38, 39]. The magnitude of the association between S. pneumoniae and ACVEs was even greater than with influenza, especially with stroke [12, 19]. Our results coincide with those published in other countries in terms of the duration of the association [15, 33, 38, 39]. The variability found in the magnitude of the association between studies could be related to methodological differences [3, 11, 12, 14, 19].
Regarding the age groups at elevated risk of ACVEs after influenza infection, there is some controversy among studies. A Scottish paper found that younger patients (<65 years) showed higher risk of AMI and stroke compared to those ≥65 years, which could be related to the lower vaccination rate among younger people, the authors suggest [19]. By contrast, we found higher IRRs in the group aged ≥ 65 years, like in other countries, supporting recommendations for influenza immunization in people older than 65 years to protect against ACVEs [3, 14]. However, IRRs of ACVEs after LCNI were found to be lower in the group aged ≥ 65 years than those ≥ 50 years. Similarly, Ohland et al found incidence ratios for AMI and stroke 1–3 days after S. pneumoniae infection in the age group 40–64 years were more than double those of the age group ≥ 65 years [12]. These results support that, in addition to the potential missed cases of influenza, part of the LCNI in our study could be related to S. pneumoniae.
Although several infectious agents are thought to increase cardiovascular risk through a cascade of systemic infection and subsequent inflammation, the influenza virus may play a more specific role in direct cardiac infection and endothelial dysfunction leading to preexisting plaque destabilization and rupture [21, 24]. Supporting this, a Spanish ecological work from García-Lledó et al found an association between influenza-like illness and type 1 AMI, specifically induced by rupture of the atheroma plaque [18]. On the other hand, Blackburn et al found an association among laboratory-confirmed respiratory infections (including influenza) and ischemic but not hemorrhagic stroke [14]. Because we selected atherothrombotic episodes as the outcome, our results provide further evidence in favor of the hypothesis of a specific role of influenza in triggering acute events by exclusively targeting areas of atherosclerosis and destabilizing preexisting plaques [24].
The strengths of this study include the population-based design, the data linked at individual-level including positive and negative laboratory results, the implementation of 4 sensitivity analysis, and the availability of both influenza definitions, LCI and CDI. By describing the baseline characteristics of LCI and CDI SCCS populations, we demonstrated the differences in health status and death rate between patients with cases registered from hospital encounters with LCI and cases attended in PC. Including CDI by collecting only influenza-specific codes allowed us to extend the applicability of the results to less severe cases of influenza. The VID have proven to be very reliable in previous epidemiological studies [31, 40, 41]. An added value is the use of the SCCS design, for which individuals act as their own control, avoiding confusion for individuals' differences in baseline characteristic. As this method is more statistically efficient compared to a cohort design, our study moves the field closer to demonstrating a possible causality.
Among the limitations of the study, the population size was not large enough to examine in detail the effects of age or different comorbidities by studying subgroups. The day after the date of respiratory sampling was used as the index date for the risk period and ACVEs occurring during the preceding 14-day period were excluded. Because infection could have started before our index date, this would have led to an underestimate of the true effect size. It was not possible to investigate the effects of other noninfluenza respiratory agents on ACVE separately because only positive and negative results for influenza were available. However, the results obtained for LCNI confirm that the association between influenza and elevated risk of ACVE could be even greater than that described here, and that such an association also exists for other possible causative agents of respiratory infections, as has been previously demonstrated [12, 14, 19, 36].
CONCLUSION
The study shows a robust association between influenza infection and an increased risk of acute atherothrombotic events in subjects ≥50 years old in Spain. The transient increase in the risk of ACVE and its gradient after influenza infection provides further evidence supporting causality. The risk of ACVE was more than 2-fold during the 14 days after milder influenza cases in patients with fewer risk factors and more than 4-fold after severe cases in more vulnerable patients, remaining in them more than 2-fold for 2 months. Our findings reinforce official recommendations for influenza prevention in at-risk groups and should also increase the awareness of even milder influenza infection and its possible complications in the general population.
Supplementary Data
Supplementary materials are available at The Journal of Infectious Diseases online (http://jid.oxfordjournals.org/). Supplementary materials consist of data provided by the author that are published to benefit the reader. The posted materials are not copyedited. The contents of all supplementary data are the sole responsibility of the authors. Questions or messages regarding errors should be addressed to the author.
Notes
Acknowledgments. We thank Dr Francisco Jose De Abajo, Dra Sara Rodríguez Martín, and Dr Antonio Rodríguez Miguel for help with the study design and Dr Alberto García-Lledó for help with the outcome case definitions.
Author contributions. All authors contributed to the study conception and design. Material preparation, data collection, and analysis were performed by M. L. L. and C. M. Q. The first draft of the manuscript was written by C. M. Q. and M. L. L. and all authors commented on previous versions of the manuscript. All authors read and approved the final manuscript.
Disclaimer. The opinions expressed in this paper are those of the authors and do not necessarily represent those of Sanofi. Sanofi had no role in the design of the study; in the collection, analyses, or interpretation of data; in the writing of the manuscript, or in the decision to publish the results.
Financial support. This work was supported by Sanofi-Aventis S.A. through an agreement signed with Fundación para el Fomento de la Investigación Sanitaria y Biomédica de la Comunitat Valenciana and the Catholic University of Valencia San Vicente Mártir.
References
Author notes
C. M.-Q. and M. L.-L. contributed equally.
Potential conflicts of interest. C. M. Q., M. L. L., J. D. D., and A. O. S. have attended several congresses whose registration, travel, and accommodation costs have been covered by GlaxoSmithKline, Merck Sharp and Dohme, and Sanofi. J. D. D. has been principal investigator in clinical trials sponsored by Sanofi, Merck Sharp and Dohme, GlaxoSmithKline, and Pfizer. J. D. D. and A. O. S. have acted as advisors for GlaxoSmithKline and Sanofi. A. U. declares no potential conflicts of interest.
All authors have submitted the ICMJE Form for Disclosure of Potential Conflicts of Interest. Conflicts that the editors consider relevant to the content of the manuscript have been disclosed.

