


Abstract
Vaccines and vaccine boosting have blunted excess morbidity and mortality from severe acute respiratory syndrome coronavirus 2 (SARS-CoV-2) infection in older nursing home residents (NHR). However, the impact of repeated vaccination on the T-cell response based on biological sex and prior infection of NHR remain understudied.
We examined T-cell responses to SARS-CoV-2 mRNA vaccines in a cohort of NHR and healthcare workers (HCW) over 2 years. We used interferon-γ ELIspot and flow cytometry to assess T-cell response before, 2 weeks, and 6 months after the initial series and each of 2 booster vaccines. We analyzed these data longitudinally with mixed-effect modeling and also examined subsets of our cohorts for additional changes in T-cell effector function.
Prior SARS-CoV-2 infection and female sex contributed to higher T-cell response in NHR but not HCW. When looking across time points, NHR but not HCW with prior infection had significantly higher T-cell responses than infection-naive subjects. These patterns of response were maintained across multiple booster vaccinations.
These results suggest that the age, multimorbidity, and/or frailty of the NHR cohort may accentuate sex and infection status differences in T-cell response to mRNA vaccination.
Coronavirus disease 2019 (COVID-19)–related mortality fell dramatically upon the introduction of severe acute respiratory syndrome coronavirus 2 (SARS-CoV-2) vaccines. However, these vaccines fell short of hopes for long-lasting protection against SARS-CoV-2 strains from the initial vaccine series [1]. However, benefit to T-cell responses from booster vaccination remains debated [2–9]. Despite the role of T cells in mitigating severe disease [10, 11], these critical memory responses remain understudied and incompletely understood.
Older individuals, such as residents in long-term care facilities, experienced a disproportionately severe impact from COVID-19. Older and frailer individuals produce lower antibody titers and lower spike-specific T-cell frequencies when compared to younger cohorts [12–15]. Additional vaccination increases antibody titers in aged individuals [3, 16, 17]. However, it is unclear how additional antigen exposures contribute to the evolution of the T-cell response against SARS-CoV-2, particularly in the context of additional vaccinations. Some evidence indicates that prior infection influences T-cell memory resulting from booster vaccination, particularly in the memory CD8+ compartment, but the duration of differences in effector molecule production and spike-specific T-cell frequency between COVID-19–naive and previously infected individuals after the first booster vaccine remain unknown [9, 18–21].
Here, we follow a cohort of nursing home residents (NHR) and health care workers (HCW) longitudinally after vaccination. We examine the T-cell response using interferon-γ (IFN-γ) ELIspot and flow cytometry.
METHODS
Sample Recruitment and Collection
This study began December 2020 with initial approval of vaccines and continued rolling enrollment until the present. Data presented in this study continues into 2022. After obtaining informed consent from all subjects or their legally authorized representatives according to Western Copernicus Group (Princeton, NJ)-approved Institutional Review Board protocols, we recruited residents who received mRNA vaccination with and without prior SARS-CoV-2 infection, along with a HCW cohort. NHR were from 11 nursing homes in Ohio and 12 in Rhode Island. The HCWs were workers at 5 nursing home buildings in Ohio, Cleveland Veterans Affairs Medical Center, and Case Western Reserve University. Sex and the terms male and female refer to biological sex categories assigned at birth. We determined prior SARS-CoV-2 infection by a prior positive polymerase chain reaction (PCR) or antigen test and/or positive antibody titer to SARS-CoV-2 spike or receptor-binding domain (RBD) at time of initial recruitment prior to their very first vaccination. Initial vaccination was considered complete after the recommended primary series for mRNA vaccines, that is, 2 shots 3 or 4 weeks apart, depending on which mRNA vaccine was received. After initial vaccination, we considered subjects to have breakthrough infections if they (1) were clinically diagnosed with SARS-CoV-2 infection by PCR or antigen test, or (2) had evidence of infection by increased levels of anti-N antibodies or a significant rise in anti-spike or RBD not associated with vaccination at draw time points. We censored data at time points for individuals who experienced SARS-CoV-2 breakthrough infection at the time point nearest their breakthrough as well as the following vaccine time point to limit the potential influence of recent COVID-19 infection on T-cell response. Venous blood was collected from subjects at various time points after vaccination and peripheral blood mononuclear cells (PBMC) were isolated using Ficoll gradient, cryopreserved, and stored in liquid nitrogen until use.
ELIspot
ELIspot assays were then conducted as previously described [22]. Briefly, high protein-binding Immobilon-P membrane plates (Merck Millipore) were coated with IFN-γ monoclonal capture antibodies (M701A, Invitrogen), and 300 000 PBMCs/well were incubated overnight with dimethyl sulfoxide (DMSO; 1 μL/well), Staphylococcus enterotoxin B (SEB) (0.5 μg/mL; BT202, Toxin Technology), or pooled Wuhan spike peptide (0.73 μg/mL per peptide; NR-52402, BEI Resources). After washing, wells were incubated with biotinylated IFN-γ monoclonal detection antibody (M701B, Invitrogen) then streptavidin-horseradish peroxidase (Agilent Dako). Next, they were developed with ELIspot 3-Amino-9-ethylcarbazole (AEC) substrate set kit (BD Biosciences), and spot-forming units (SFU) visualized with Immunospot 5.0.22 Professional DC (Cellular Technology). Spike-specific SFUs are determined by subtracting the negative DMSO condition from the spike peptide condition. The vast majority of samples averaged <1 SFU in the DMSO condition across duplicates. ELIspot results were not included in the dataset if they did not meet a cutoff result of 450 SFU/well in response to SEB.
Flow Cytometry
PBMCs were stimulated as in ELIspot along with Brefeldin A (5 μg/mL; B7651, Sigma) and anti-CD28/CD49d costimulation (1 μg/mL of each; 160289, eBiosciences; 304310, Biolegend). Samples were incubated at 37°C overnight and stained with eBiosciences FoxP3/Transcription Factor Staining Buffer Set (00-5523, Invitrogen) and LIVE/DEAD Fixable Aqua Dead Stain (L34957, Invitrogen); anti-CD8 BV786 (563823, BD Biosciences); anti-CD4 APC/Cy7 (300518, Biolegend); anti-CD45RA PE-Dazzle 594 (304146, Biolegend); anti-CD197 (CCR7) PE/Cy7 (353226, Biolegend); anti-CD3 BUV395 (563546, BD Horizon); anti–IFN-γ AF488 (502515, Biolegend); anti–IL-2 APC (500310, Biolegend,); anti–TNF-ɑ Pacific Blue (502920, Biolegend); anti–perforin-1 PE (CDM247, Cell Science); and anti-granzyme B PE/Cy5.5 (GRB18, Invitrogen). Samples were run using BD Fortessa flow cytometer and analyzed using FlowJo 10.8.1.
Statistical Analysis
ELIspot responses were analyzed using mixed-effects models to accommodate correlated outcomes over time within the same subject and imbalanced data that occurs with differences in available samples across our cohort. Additionally, they facilitate the testing of more complex hypotheses and associations than bivariate correlations or single-time point comparisons between groups. Using mixed-effects models we estimated the effects and possible interactions of time point (defined by last vaccine dose and time since vaccination), sex, prior infection, and NHR or HCW cohort on ELIspot responses. Models were performed on log-transformed ELIspot values and model assumptions were assessed. When model effects were detected based on ANOVA-type F tests, model contrasts were used to compare estimated marginal means across times or groups to describe the effect. This allowed us to detect differences across time points or between HCW and NHR cohorts.
We attempted to use similar models to analyze the flow cytometry data, but model assumptions were not met given the observed distributions and reduced sample size. Thus, we used nonparametric Wilcoxon-Mann-Whitney rank sum rank test to compare SARS-CoV-2–naive to subjects with prior COVID-19 infection among NHR paired across time points. For central memory (CM) and effector memory (EM) cells, the data were analyzed with a mixed-effects linear regression model predicting square-root–transformed cytokine frequencies with time point, status, and group. When an effect of time was detected using an F test, post hoc paired differences across the 3 vaccine time points were tested with a Tukey P value adjustment, and significant results are indicated on the graph. Wilcoxon signed rank tests were used to compare paired CM and EM cytokine values within subjects at a given time point. Mixed-effects models and marginal means post hoc tests were performed in R using the nlme and emmeans packages.
RESULTS
We recruited a total of 241 NHR and 96 HCW. Due to the cross-sectional elements of our study, not all individuals were able to be sampled at all time points. Basic demographics for each cohort are reported in Table 1. We were able to sample some individuals before the initial COVID-19 vaccine series as well as 2 weeks and 6 months after the initial series. In addition to time points 2 weeks after each booster, further sampling took place 6 months after the first booster. As the second booster was age restricted for the duration of this study, it was largely received by NHR, and blood was then drawn 2 weeks and 3 months after the second booster. NHR received BNT162b2 most commonly, with mRNA-1273 used in 6% of primary series, 4% for the third dose, and 30% for the fourth dose. HCW received BNT162b2 for all doses. The NHR population in this study is a typical long-stay nursing home population that has the common commodities of aging and functionality. Data were available from NHR at time of enrollment from 224 subjects on immunosuppression and 213 subjects on functionality: 57% of NHR subjects needed assistance from staff, 23% used assistive devices but no staff assistance required, and 20% were independent. Less than 3% of NHR had an immunosuppressive condition or medication. Of the 71 NHR clinically or serologically determined to have had breakthrough infection after enrollment into the study, only 2 required hospitalization and 2 required oxygen. None of the HCW reported severe infection requiring hospitalization or oxygen from infection.
Demographics for Each Cohort
| Cohort | Total No. | Age, y, median (IQR) | Race/Ethnicity, No. (%) | |||||||
|---|---|---|---|---|---|---|---|---|---|---|
| All | Female | Male | Female | Male | Asian | Black | Hispanic | White | Other | |
| NHR | 241 | 120 | 121 | 77 (70–87) | 74 (68–84) | 2 (1) | 46 (19) | 3 (1) | 189 (78) | 1 (1) |
| HCW | 96 | 52 | 44 | 48 (39–56) | 50 (39–57) | 5 (5) | 7 (7) | 5 (5) | 78 (81) | 1 (1) |
Cohort demographics and sample sizes are reported for nursing home resident (NHR) and health care worker (HCW) cohorts. Male and female refers to biological sex assignment at birth. The median and interquartile range (IQR) for ages are also reported.
T-Cell Responses From NHR Cohort Vary by Subject COVID-19 Status and Biological Sex
IFN-γ ELIspot was performed with Wuhan strain spike stimulation at multiple longitudinal time points. Raw data for each cohort are reported in Supplementary Figure 1. Critically, regardless of cohort or prior infection with COVID-19, all groups showed an increase in ELIspot responses from the pre–COVID-19 vaccination time point after vaccination (Supplementary Figure 1). Figure 1 displays the ELIspot responses stratified by time point, sex, cohort, and SARS-CoV-2 infection status, reflecting the data and the variables present in the mixed-effects models. We detected a significant effect of time point but did not detect an interaction between time point and sex or time point and SARS-CoV-2 infection status. In contrast, we detected interactions between cohort and sex (P = .0007) and cohort and infection status (P = .0002), indicating that the effects of sex and infection status on ELIspot differed between HCW and NHR cohorts.
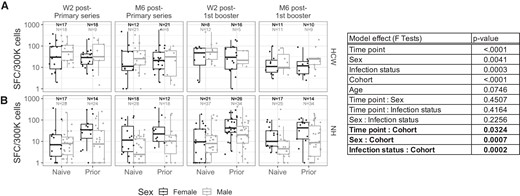
Analysis of effects of sex, cohort, and prior COVID-19 infection status on ELIspot response. Vaccine-specific IFN-γ ELIspot response shown at W2 after the initial series and first boost as well as M6 after each vaccine exposure in (A) HCW and (B) NHR. Marginal F test P values of effects in the mixed-effects model that examined cohort (NHR or HCW), time point, subject sex, and COVID-19 infection status (COVID-19–naive or prior infection) are shown. Significant (ɑ = .05) interaction effects are reported in bold. SARS-CoV-2 infection status (naive or prior) is labeled on the x-axis, and data points are separated by donor's biological sex (black, female; gray, male). Overlaid boxplots display the median in bold line and the 1st and 3rd quartiles at the top and bottom of the box with whiskers that extend to the highest value within 1.5 times the interquartile range (IQR) above the 3rd quartile and below the 1st quartile. Median blood sampling intervals were 14 days for time point W2 after primary series, 181 days for time point M6 after primary series, 15 days for time point W2 after first booster, and 183 days for time point M6 after first booster. Abbreviations: Spot-forming cell (SFC); COVID-19, coronavirus disease 2019; HCW, health care worker; IFN-γ, interferon-γ; M6, 6 months; NHR, nursing home resident; SARS-CoV-2, severe acute respiratory syndrome coronavirus 2; W2, 2 weeks.
We used post hoc tests to assess the direction and statistical significance of these effect differences. Post hoc contrasts did not identify sex differences in HCW ELIspot responses (P = .36), but female NHR had significantly higher responses compared to male NHR (P = .0005). T-cell responses were significantly lower in SARS-CoV-2 infection-naive compared to previously infected individuals in NHR (P < .0001), but not for HCWs (P = .83). Thus, the model interactions captured sex and infection status differences in ELIspot response that were present in the NHR and absent in HCW, consistent with the boxplots within Figure 1.
T-Cell Responses From NHR Cohort Increase With Booster Vaccinations
We sought to further examine the effect of time detected by our mixed-effects model with the addition of a second booster dose. HCW were largely ineligible to receive the second booster due to age restrictions, so we focused this analysis on the NHR cohort and excluded HCW subjects. We used a mixed-effects model of NHR ELIspot responses following the primary series, first monovalent booster, and second monovalent booster as a function of sample time point, age, and prior infection. Figure 2 displays the NHR ELIspot responses used in model estimation, stratified by time and SARS-CoV-2 infection status. The marginal F test P values from the model indicate significant effects of the time point the sample was obtained (P < .0001) and SARS-CoV-2 infection status (P < .0001) on ELIspot responses (Figure 2). Among NHR, we did not detect a significant effect of subject age on ELIspot (P = .09). As in the model described above excluding the second booster and including HCW, we did not detect significant differences in the effect of SARS-CoV-2 infection status at different time points (P = .3).
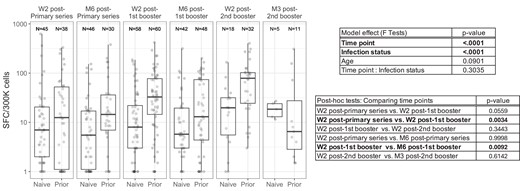
Longitudinal analysis of ELIspot results in NHR. Vaccine-specific IFN-γ ELIspot response shown at W2 after the initial series, first boost, and second boost as well as 3–6 months after each vaccine exposure in NHR. ELIspot results from subjects with prior COVID-19 infection and from COVID-19–naive donors are labeled on the x-axis. Overlaid boxplots display the median in bold line and the 1st and 3rd quartiles at the top and bottom of the box with whiskers that extend to the highest value within 1.5 times the interquartile range (IQR) above the 3rd quartile and below the 1st quartile. A mixed-effects model considering time point, COVID-19 infection status (naive or prior), and subject age was used to examine the NHR cohort specifically to examine the impacts of time on IFN-γ ELIspot response. Significant model effects (ɑ = .05) are reported in bold with pairwise comparisons of time point estimates. Median blood sampling intervals were 14 days for time point W2 after primary series, 181 days for time point M6 after primary series, 15 days for time point W2 after first booster, 183 days for time point M6 after first booster, 17 days for time point W2 after 2nd booster, and 104 days for M3 after 2nd booster. Abbreviations: Spot-forming cell (SFC); COVID-19, coronavirus disease 2019; IFN-γ, interferon-γ; M3, 3 months; M6, 6 months; NHR, nursing home resident; W2, 2 weeks.
Given the detected effect of time point on ELIspot response, we performed post hoc tests of paired time points to identify which pairs differed significantly. We tested differences of the 3 time points immediately postvaccine (2 weeks following) and the 3 pairs of immediate and 3–6 months postvaccine time points (post hoc comparison, Figure 2). We found significant differences between the ELIspot response at week 2 following the initial series and the second booster (P = .003). Additionally, comparing responses at 2 weeks following a vaccine exposure to responses 3–6 months after vaccination, only the first booster showed a significant decrease in response over time (P = .009).
Flow Cytometry Data Show no Increase in Spike-Specific T Cells in Response to Boosting
In addition to ELIspot assay, subjects in our cohort with samples containing a sufficient cell number were also assessed for antigen-specific T-cell responses using flow cytometry. We measured cytokine (IFN-γ, tumor necrosis factor-α [TNF-ɑ], and interleukin 2 [IL-2]) production in memory CD4+ and CD8+ T cells in response to spike antigen stimulation from the Wuhan strain. We performed nonparametric comparisons (Wilcoxon-Mann-Whitney rank sum) within time points to compare SARS-CoV-2–naive NHR and NHR with prior SARS-CoV-2 infection. This method allowed us to acknowledge outliers without permitting them undue influence in the statistical test.
In memory CD4+ T cells, spike-specific IFN-γ+ frequency was the primary longitudinal difference between infection-naive NHR and NHR with prior SARS-CoV-2 infection (Figure 3A). Participants with prior SARS-CoV-2 infection had nearly significantly higher IFN-γ+ frequencies than infection-naive participants after the initial series (P = .07) and maintained statistical significance 6 months after the initial series (P = .05) and after the first booster (P = .03). At later time points, where our SARS-CoV-2 infection-naive sample size decreased due to breakthrough infection, statistical significance was lost. (P = .096). There were otherwise no differences between SARS-CoV-2–naive subjects and subjects with previous COVID-19 (Figure 3B). We detected a significant difference in IL-2+ CD4 memory T cells several months after the primary series (P = .04), but not after the first booster (Figure 3C). For all 3 cytokines, there was no detected time effect, meaning that T-cell response did not vary significantly between time points within COVID-19–naive or previously infected groups.
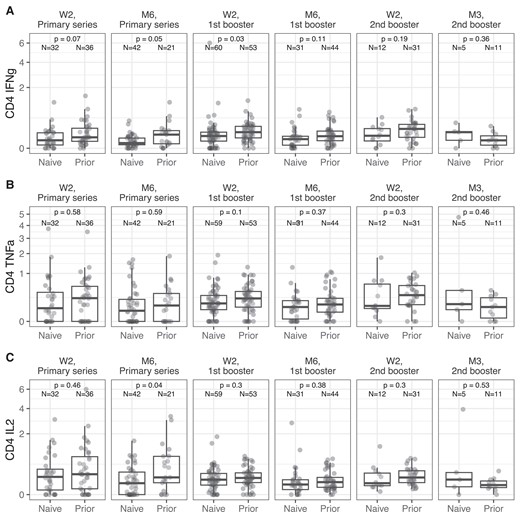
Longitudinal spike-specific cytokine expression in NHR CD4+ memory T cells. Cytokine production in CD4+ memory T cells was examined using flow cytometry from W2 after the primary vaccine series to 3 months after the second booster (M3). Results from subjects with prior COVID-19 infection and from COVID-19–naive donors are labeled on the x-axis. Overlaid boxplots display the median in bold line and the 1st and 3rd quartiles at the top and bottom of the box with whiskers that extend to the highest value within 1.5 times the interquartile range (IQR) above the 3rd quartile and below the 1st quartile. P values for Wilcoxon-Mann-Whitney rank sum tests comparing COVID-19–naive and previously infected NHR are reported for each time point on the graphs for (A) IFN-γ+ frequencies in memory CD4+ T cells, (B) TNF-ɑ+ frequencies, and (C) IL-2+ frequencies. Sample size for COVID-19–naive (naive) and previously infected (prior) individuals are reported for each time point on the graph. Abbreviations: COVID-19, coronavirus disease 2019; IFN-γ, interferon-γ; IL-2, interleukin 2; M3, 3 months; NHR, nursing home resident; TNF-ɑ, tumor necrosis factor-α; W2, 2 weeks.
While a few individuals responded robustly in the CD8+ T-cell compartment, particularly among those with prior SARS-CoV-2 infection, the median frequency of response was less than that of CD4+ T cells (Supplementary Figure 2). As with CD4+ T cells, CD8+ cytokine frequencies did not significantly vary across time points. We found statistical differences in CD8+ spike-specific IFN-γ+ frequencies between COVID-19–naive and subjects with prior COVID after the first booster (P = .005) and nearly significant differences months after the first booster (P = .05) (Supplementary Figure 2A). Likewise, we detected significant differences between CD8+TNF-ɑ+ frequencies of COVID-19–naive and subjects with prior COVID after the first booster, but not other time points (Supplementary Figure 2B). Unsurprisingly, IL-2 production in CD8+ T cells did not vary between SARS-CoV-2 infection-naive and previously infected individuals at any time point, as CD8+ cells are not, by and large, known to produce much IL-2 (Supplementary Figure 2C). Overall, we found that while there was no statistical difference between cytokine frequencies at various time points, statistical differences between SARS-CoV-2–naive and previously infected participants were present until after the first booster.
The predominant memory subsets of spike-specific cells, CM (defined as CD45RA−CCR7+ T cells) and EM (defined as CD45RA−CCR7− T cells) were examined longitudinally. Only CD4+ spike-specific IFN-γ frequencies showed longitudinal differences, and then only in the CD4+ CM compartment (Figure 4). Also, at all time points in CD4+ T cells, EM cells had 5 to 10-fold higher cytokine-positive cells than CM cells (P < .05 by Wilcoxon signed rank test for all times and cytokines). CD8+ responses were more variable but did not show significant longitudinal differences in either CM or EM for any cytokine tested (Supplementary Figure 3).
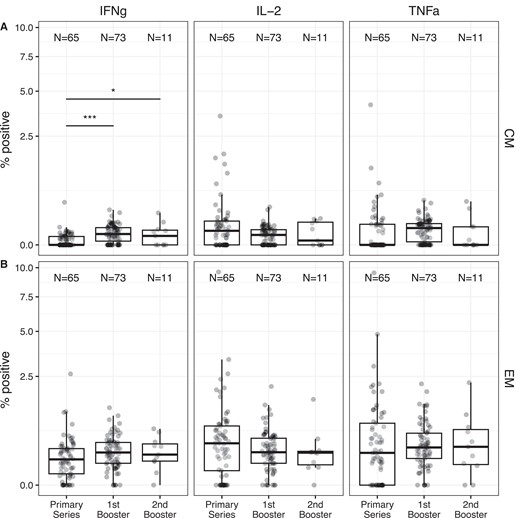
Relative frequencies of antigen-specific (A) CM and (B) EM T cells show minimal changes between time points. The frequency of cells expressing IFN-γ, IL-2, or TNF-ɑ in the CM or EM compartment after incubation with spike protein is shown. Overlaid boxplots display the median in bold line and the 1st and 3rd quartiles at the top and bottom of the box with whiskers that extend to the highest value within 1.5 times the interquartile range (IQR) above the 3rd quartile and below the 1st quartile. For each memory type and cytokine, a mixed-effects linear regression model predicting square-root transformed cytokine frequency was used to assess the effect of vaccine time point while adjusting for infection status and cohort. When the model detected an effect of time point on the cytokine frequency, post hoc paired differences across the 3 time points were tested using a Tukey P value adjustment. Significant differences across time points are shown. *P < .05; ***P < .001. For CM IL-2, the model assumptions were not met and no statistical comparisons were performed across time points. Both COVID-19-naive and previously infected donors are combined in the figure. For all cytokines and times, significant differences between CM and EM values within subjects were detected (Wilcoxon signed rank P < .05 for all). Abbreviations: CM, central memory; EM, effector memory; IFN-γ, interferon-γ; IL-2, interleukin 2; TNF-ɑ, tumor necrosis factor-α.
DISCUSSION
Previous literature has reported that there are vaccine-induced T-cell responses after the initial mRNA COVID-19 vaccine series, and CD4+ cells seem to elicit more response than CD8+ [23]. Though there are mixed reports as to how booster COVID-19 vaccines affect T-cell frequency, vaccine-specific IFN-γ+ CD4+ T cells seem to increase in frequency, at least temporarily [2–9, 14]. However, these studies have focused on healthy, younger cohorts, and there are fewer data available on how boosters affect T-cell responses in older, frailer cohorts such as NHR. Older adults have been reported to have lower COVID-19 vaccine responses than younger adults [9, 14, 20, 24–26], and it is unclear if additional boosters are able to rescue lower T-cell frequencies in older adults. In this study, we sought to understand the longitudinal impact of repeat COVID-19 vaccination on the T-cell responses in a NHR cohort alongside a smaller HCW cohort.
Mixed-effect modeling of both NHR and HCW indicated several factors influenced longitudinal ELIspot response, including time point after vaccination. We found differences in overall longitudinal response ELIspot response, but these differences seemed to lessen over time. More interestingly, however, peak response immediately following a vaccination does not increase further in NHR with additional vaccination, suggesting that spike-specific T-cell response is maximized after the first booster. Others have also noted that booster vaccination seems to have limited ability to increase NHR spike-specific T-cell frequency [9], and cross-strain T-cell responses are already present by the first booster [6, 7, 9]. This suggests that while booster vaccination may keep circulating T-cell frequencies high in NHR, it has limited ability to impact T-cell expansion and adaptation.
Critically and uniquely, mixed-effect modeling was able to show that there are sex-based differences in vaccine-induced T-cell response in NHR (P = .0005), but not HCW. Likewise, NHR, but not HCW, had significantly higher ELIspot responses in previously infected subjects compared to COVID-19–naive subjects (P < .0001). Repeated vaccination did not nullify these differences between COVID-19–naive and previously infected donors or between male and female NHR, as shown by additional analysis focusing on NHR that included another booster time point. There are a number of clinical reports showing hybrid immunity elicits more effective and more long-lasting protection from disease than just vaccine [27, 28]. It is not clear how much of that increased clinical protection is the result of humoral immunity or T-cell responses. Our study, however, does confirm in the NHR population with prior infection that frequencies of spike-specific T cells are elevated over those without hybrid immunity. The importance of these T cells in sustained protection from severe disease remains to be fully elucidated.
While the exact mechanisms for this sex difference are unknown, it is documented that Toll-like receptor 7 (TLR7), an internal TLR activated by mRNA vaccines, is expressed on the X chromosome and escapes X-linked silencing [29, 30]. A role for sex hormones like estradiol and testosterone in COVID-19 severity has also been described [30, 31], but that does not explain sex differences in vaccine response or even differences in populations like our NHR cohort of postmenopausal women and aging men. Our data further suggest an interaction of sex with age in T-cell responses, as sex-based differences in response are only significant in the NHR cohort. Sex-based differences in aging are even less studied than sex-based differences in general, though sex-based differences in older, but not younger, cohorts have been reported in other vaccine contexts [32]. How much these differences relate to differences in thymic involution remains unknown [33]. Our results highlight the need to optimize T-cell responses in the older male population, which have lower vaccine-specific T-cell frequencies even after repeated boosting.
We examined T-cell responses in more detail in a more limited set of subjects using flow cytometry to assess the frequency of spike-specific T cells expressing IL-2, TNF-ɑ, or IFN-γ. No significant differences across time were observed within the CD4+ and CD8+ compartments, although statistical differences were found at various time points between SARS-CoV-2–naive participants and participants with prior SARS-CoV-2 infection. In our dataset, mRNA SARS-CoV-2 vaccines seem to preferentially induce CD4+ responses over CD8+, as others have reported [14, 34]. Data collected from SARS-CoV-2 patients suggest that CD8+ cells largely respond to nonspike epitopes [35]. Analysis of a subset of participants for longitudinal changes in CM and EM T cells showed very minimal changes in spike-specific frequency after multiple vaccinations. This agrees with our ELIspot results, which found no significant differences in overall spike-specific IFN-γ+ frequencies across multiple vaccination time points.
A limitation of this paper is the limited clinical data collected regarding both the HCW and NHR cohort. We did not collect data on clinical severity of breakthrough infection, variant strain if a participant was infected, or existing comorbidities, which limits our ability to significantly characterize our cohorts beyond age, sex, and nursing home residence. Throughout this study, we focused on T-cell responses to spike Wuhan peptide from the original strain, despite the fact that some subjects experienced breakthrough infections during times when Delta and Omicron were highly prevalent in the United States. T cells show remarkable cross-reactivity across COVID-19 variants, particularly CD4+ T cells [6, 36–38]. However, there are likely elements of memory T-cell response missed due to this focus on Wuhan-variant spike peptide.
Another limitation of our flow cytometry dataset is the potential selection bias towards participants with sufficient PBMCs to run the analysis on. Our experimental workflow may be biased against the most frail participants unable to provide sufficient sample to allow for both ELIspot and flow cytometry analysis, resulting in fewer differences in flow cytometry data than ELIspot findings between HCW and NHR.
In this study, we show that initial mRNA vaccines are readily able to generate T-cell responses in NHR and HCW cohorts and T cells experience no or less substantial drops between booster vaccines compared to those seen in humoral immunity [16, 39]. However, repeated vaccination was not able to overcome statistically lower spike-specific T-cell responses in male and SARS-CoV-2–naive NHR. Additionally, while we did not measure T-cell frequency against COVID-19 variants, studies suggest that T-cell responses are highly cross-reactive between COVID-19 variants, especially for CD4+ T cells. Therefore, enhancing T-cell responses may add to protection from severe COVID-19 outcomes for a longer period of time than antibodies, which are more sensitive to variant mutation and experience dramatic drops in neutralization titers at 6 months after booster vaccination [16, 37].
Supplementary Data
Supplementary materials are available at The Journal of Infectious Diseases online (http://jid.oxfordjournals.org/). Supplementary materials consist of data provided by the author that are published to benefit the reader. The posted materials are not copyedited. The contents of all supplementary data are the sole responsibility of the authors. Questions or messages regarding errors should be addressed to the author.
Notes
Author contributions. C. L. Sm. contributed to writing, editing and review, visualization, and formal analysis. E. D. contributed to investigation and validation. T. B. contributed to formal analysis. H. A. conducted investigation. O. O. contributed to investigation and data curation. B. W. contributed to formal analysis, methodology, visualization, and writing. C. L. Sh. contributed to conceptualization and methodology. S. G. and D. C. contributed to conceptualization, funding acquisition, supervision, review and editing, and project management.
Disclaimer. The funders played no role in study design, data collection, analysis, interpretation of data, or the writing of this article.
Data availability. All coding used to develop models, protocols, and data are available upon request to the corresponding author.
Financial support. This work was supported by the National Institutes of Health (grant number AI129709-03S1 and U01 CA260539-03); and the Centers for Disease Control and Prevention (grant number 200-2016-91773) and Veterans Health Admistration ( grant number BX005507-01).
References
Author notes
Potential conflicts of interest. S. G. and D. H. C. are recipients of investigator-initiated grants to their universities from Pfizer to study pneumococcal vaccines, Sanofi Pasteur and Seqirus to study influenza vaccines, and Moderna to study respiratory infection. S. G. is recipient of investigator-initiated grant to the university from Genentech on influenza antivirals; reports consulting for Seqirus, Sanofi, Merck, Vaxart, Novavax, Moderna, and Janssen; has served on the speaker bureaus for Seqirus and Sanofi; reports personal fees from Pfizer; and reports data and safety monitoring board fees from Longevoron and SciClone. C. S. is now employed by CSL Seqirus. All other authors report no potential conflicts.
All authors have submitted the ICMJE Form for Disclosure of Potential Conflicts of Interest. Conflicts that the editors consider relevant to the content of the manuscript have been disclosed.

