


Abstract
Human immunodeficiency virus type 1 (HIV-1) disease manifestations differ between cisgender women and men, including better control of viral replication during primary infection and less frequent residual HIV-1 replication on antiretroviral therapy (ART) in cisgender women with HIV-1 (WWH). Investigating plasmacytoid dendritic cell (pDC) functions and HIV-1 reservoir sizes in 20 WWH on stable ART, we observed inverse correlations between interferon-α and tumor necrosis factor responses of pDCs to Toll-like receptor 7/8 stimulation and intact/total proviral HIV-1 DNA levels. Additionally, ISG15 mRNA levels in peripheral blood mononuclear cells correlated with cytokine responses of pDCs. These findings demonstrate an association between higher type I interferon responses and lower HIV-1 reservoir sizes in WWH on ART, warranting studies to identify the underlying mechanisms.
Biological sex can influence the manifestations of infectious diseases, and females generally exhibit superior control of viral infections [1]. In human immunodeficiency virus type 1 (HIV-1) infection, cisgender women with HIV-1 (WWH) better control viral replication in primary infection than cisgender men with HIV-1 (MWH), but progress faster to AIDS during chronic untreated infection after adjusting for viral replication [2]. During antiretroviral therapy (ART), WWH show greater CD4 T-cell recovery, less detectable residual viral replication, and smaller HIV-1 reservoir sizes compared to MWH [3, 4]. Effects of sex hormones and differences in innate immune responses, including type I interferons (IFNs), have been suggested to contribute to these sex-based differences [5].
Type I IFNs are critical antiviral molecules that can induce expression of interferon-stimulated genes (ISGs) involved in restriction of viruses [6]. Plasmacytoid dendritic cells (pDCs) produce IFNs following sensing of viral single-stranded RNAs (ssRNAs) through Toll-like receptor 7 (TLR7) [5, 6]. Female pDCs produce more IFN-α upon TLR7 stimulation, and WWH express elevated ISG levels compared to MWH, indicating biological consequences of sex differences in type I IFN induction [5, 7]. However, the impact of the strength of type I IFN responses on HIV-1 reservoir sizes is not known.
METHODS
Study Participants and Sample Collection
Twenty cisgender WWH were recruited from December 2021 to August 2022 at the medical care center ICH Hamburg, Germany. Clinical characteristics of study participants are shown in Table 1. The study was approved by the ethics committee of Ärztekammer Hamburg (PV5142). After written informed consent, peripheral blood samples were collected. One million isolated peripheral blood mononuclear cells (PBMCs) were stored in RLT Buffer (Qiagen) for messenger RNA (mRNA) analysis. Remaining PBMCs were cryopreserved and stored in liquid nitrogen for further analysis.
Study Participant Characteristics
| Donor | Age, y | Time Since HIV Diagnosis, y | Pre-ART | Under Ongoing ART | |||||
|---|---|---|---|---|---|---|---|---|---|
| Total CD4 Nadir, Cells/µL | HIV RNAa, Copies/mL | Time on ART, y | Total CD4 Countb, Cells/µL | Total CD8 Countb, Cells/µL | CD4/CD8 T-Cell Ratiob | ART Regimen | |||
| 1 | 57 | 26 | <200 | NA | 26 | 1378 | 964 | 1.43 | EVG/c + TAF + FTC |
| 2 | 56 | 15 | 119 | 111 000 | 15 | 470 | 470 | 1 | BIC + TAF + FTC |
| 3 | 41 | 12 | 302 | 27 713 | 12 | 936 | 347 | 2.7 | BIC + TAF + FTC |
| 4 | 42 | 19 | 11 | NA | 19 | 1230 | 572 | 2.15 | RAL + TDF + FTC |
| 5 | 62 | 14 | 281 | 53 000 | 14 | 1193 | 1023 | 1.17 | DOL + RPV |
| 6 | 73 | 10.8 | 137 | 234 000 | 10.8 | 410 | 950 | 0.43 | RPV + TAF + FTC |
| 7 | 45 | 20 | 32 | 580 000 | 20 | 874 | 650 | 1.34 | BIC + TAF + FTC |
| 8 | 62 | 10.4 | 13 | 1 300 000 | 10.4 | 852 | 1918 | 0.44 | DOL + 3TC |
| 9 | 41 | 6 | 390 | 1800 | 6 | 738 | 539 | 1.37 | DOL + 3TC |
| 10 | 55 | 6 | 359 | 2000 | 6 | 909 | 464 | 1.96 | EVG/c + TAF + FTC |
| 11 | 51 | 13.7 | 195 | 237 000 | 13.7 | 784 | 669 | 1.17 | NVP + TDF + FTC |
| 12 | 33 | 11.5 | 270 | 69 000 | 11.5 | 734 | 490 | 1,5 | RPV + TAF + FTC |
| 13 | 50 | 6 | 514 | 21 000 | 6 | 926 | 881 | 1.05 | BIC + TAF + FTC |
| 14 | 33 | 1.6 | 521 | 73 000 | 1.6 | 1141 | 680 | 1.35 | DOR + TDF + 3TC |
| 15 | 30 | 4.4 | 607 | 14 800 | 4.4 | 2003 | 668 | 3 | DOL + 3TC |
| 16 | 63 | 18.8 | 43 | 236 000 | 18.8 | 691 | 1072 | 0.64 | BIC + TAF + FTC |
| 17 | 29 | 4.2 | 368 | 3754 | 4.2 | 702 | 463 | 1.52 | RPV + TAF + FTC |
| 18 | 56 | 23.4 | 40 | 30 500 | 23.4 | 689 | 638 | 1.08 | DOL + 3TC |
| 19 | 46 | 7.2 | 338 | 197 000 | 7.2 | 1325 | 1263 | 1.05 | DOL + ABC + 3TC |
| 20 | 34 | 10 | 300 | NA | 10 | 880 | 730 | 1.21 | NVP + TDF + FTC |
Abbreviations: 3TC, lamivudine; ABC, abacavir; ART, antiretroviral therapy; BIC, bictegravir; DOL, dolutegravir; DOR, doravirine; EVG/c, elvitegravir/cobicistat; FTC, emtricitabine; HIV, human immunodeficiency virus; NA, not available; NVP, nevirapine; RAL, raltegravir; RPV, rilpivirine; TAF, tenofovir alafenamide; TDF, tenofovir disoproxil fumarate.
aMeasured before start of ART.
bMeasured at most recent blood withdrawal.
Assessment of Cytokine Production Following TLR7/8 Stimulation
Two million PBMCs were stimulated with 1 µg/mL TLR7/8 agonist CL097 (InvivoGen) for 20 hours, as described previously [8]. Unstimulated PBMCs served as controls. Intracellular cytokine staining assays were carried out as described previously [8]. Flow cytometry data were acquired using LSRFortessa (BD Biosciences). A detailed list of antibodies is shown in Supplementary Table 1 and gating strategies in Supplementary Figure 1.
Isolation of CD4 T Cells and Quantification of HIV-1 Proviral DNA
Total CD4 T cells (viable singlets CD3+/CD4+) were isolated using FACSAria Fusion (BD Biosciences) from 10 million PBMCs from each donor (a detailed list of antibodies is shown in Supplementary Table 2, and gating strategy in Supplementary Figure 2). Genomic DNA from approximately 2 million sorted CD4 T cells was extracted using the AllPrep DNA/RNA Kit (Qiagen, Hilden, Germany) according to the manufacturer's instructions, with precautions to avoid excessive DNA shearing. Quantification of total and intact HIV-1 proviruses was performed using the Intact Proviral DNA Assay (IPDA) as described elsewhere [9]. Primers and probes (Integrated DNA Technologies) are shown in Supplementary Table 3.
Quantification of ISG mRNAs Using qRT-PCR
RNA of 1 million PBMCs was extracted using RNeasy Mini Kit (Qiagen) and reverse transcribed (qScriber cDNA Synthesis Kit [highQU]) in accordance with the manufacturers’ instructions. Gene expression was quantified using LightCycler 480 II-96 and SybrGreen (highQU). Quantitative reverse-transcription polymerase chain reaction (qRT-PCR) primers used are listed in Supplementary Table 4. mRNA quantification of each sample was run in duplicates and normalized to RPL13 mRNA expression.
Statistical Analysis
Flow cytometry data were analyzed using FlowJo software v10.8.1 (FlowJo, LLC, BD Life Sciences). For correlation analysis, Spearman tests were performed using GraphPad Prism software (version 9.4.0.). Multivariable linear regression analyses were performed using Stata software (version 17).
RESULTS
Characteristics of Study Participants
To investigate associations between cytokine responses of pDCs and the size of the latent HIV-1 reservoir, we established a cohort of 20 cisgender WWH (subtype B) on stable suppressive ART. Clinical features and baseline characteristics of study participants are shown in Table 1. Exclusion criteria included any acute infections, HCV infection, hematological or autoimmune disorders, malignancies, pregnancy, or any immunosuppressive therapy.
High IFN-α and Tumor Necrosis Factor Responses of pDCs in WWH Are Associated With Lower HIV-1 Reservoir Sizes
To assess associations between inducible cytokine responses of pDCs and HIV-1 reservoir sizes in WWH, PBMCs were stimulated with the TLR7/8 agonist CL097 and cytokine production was quantified using intracellular cytokine staining [8]. In line with previous studies [5], we observed robust IFN-α and tumor necrosis factor (TNF) production by pDCs, and percentages of IFN-α– and TNF-producing pDCs were significantly correlated (Supplementary Figure 3). Total and intact proviral DNA levels were quantified using isolated CD4 T cells and displayed considerable variability between WWH (Supplementary Figure 4 and Supplementary Table 5). Correlation analyses revealed an inverse relationship between TLR7-dependent cytokine production by pDCs and total as well as intact proviral HIV-1 DNA levels (Figure 1A and 1B, Supplementary Figure 5). In particular, higher percentages of IFN-α–producing pDCs significantly correlated with lower intact proviral DNA levels (P = .038, R = −0.47), while inverse correlations with total proviral HIV-1 DNA levels only exhibited a trend (P = .07, R = −0.42). Furthermore, higher percentages of TNF-producing pDCs significantly inversely correlated with total proviral HIV-1 DNA levels (P = .017, R = −0.51) (Supplementary Figure 5) and showed a trend toward an inverse correlation with intact proviral DNA levels (P = .06, R = −0.43) (Figure 1B).
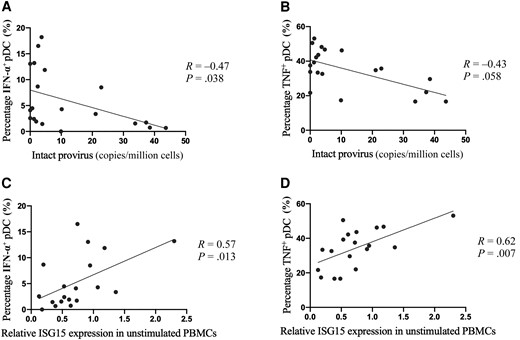
A, Correlation analysis of interferon alpha (IFN-α)+ plasmacytoid dendritic cell (pDC) frequencies and intact human immunodeficiency virus type 1 (HIV-1) reservoir sizes. The percentages of IFN-α–producing pDCs following Toll-like receptor 7 (TLR7) stimulation for 20 h are plotted against the intact HIV-1 reservoir size. B, Correlation analysis of tumor necrosis factor (TNF)+ pDC frequencies and intact HIV-1 reservoir sizes. The percentages of TNF-producing pDCs following TLR7 stimulation for 20 h are plotted against the intact HIV-1 reservoir size. C, Correlation analysis of ex vivo ISG15 expression in peripheral blood mononuclear cells (PBMCs) and IFN-α production by pDCs. The percentages of IFN-α–producing pDCs following TLR7 stimulation for 20 h are plotted against the relative ISG15 expression (normalized to housekeeping gene RPL13) in unstimulated PBMCs. D, Correlation analysis of ex vivo ISG15 expression in PBMCs and TNF production by pDCs. The percentages of TNF-producing pDCs following TLR7 stimulation for 20 h are plotted against the relative ISG15 expression (normalized to the housekeeping gene RPL13) in unstimulated PBMCs. Spearman test was used for correlation analysis (n = 20 in A and B; n = 19 in C and D). P < .05 is considered statistically significant.
As the CD4 nadir has been shown to be inversely associated with HIV-1 proviral DNA levels [10], multivariable linear regression analyses of IFN-α responses by pDCs with total or intact proviral DNA levels adjusted for CD4 nadir were performed. These analyses showed that IFN-α responses by pDCs following TLR7 stimulation were inversely associated with intact proviral HIV-1 DNA levels (coefficient: −1.25; P = .05), but not CD4 nadir (coefficient: –0.048; P = .64). Furthermore, no significant correlation was observed between TLR7-induced cytokine production by pDCs and 3′-defect or 5′-defect proviral DNA in CD4+ T cells (Supplementary Figure 6). These findings show that the in vitro ability of pDCs to produce IFN-α and TNF following TLR7 stimulation is negatively associated with intact and total proviral HIV-1 DNA levels, indicating a potential role of pDC responsiveness in modulating HIV-1 reservoir sizes.
Inducible IFN-α and TNF Responses by pDCs Are Associated With Baseline ISG Expression in PBMCs
Type I IFN responses of pDCs are enhanced by a positive feedback loop, linking higher cytokine responses to previous IFN-α exposure [11]. The observed inverse association between in vitro pDC cytokine responses after TLR7 stimulation and HIV-1 reservoir sizes might thus reflect a higher baseline type I IFN status in those WWH with stronger pDC responsiveness. We therefore assessed baseline ISG mRNA expression levels of ISG15, IFI16, and IFI44 in PBMCs using qRT-PCR (Supplementary Figure 7). Results were normalized to the housekeeping gene RPL13. One study participant was excluded from the analysis of ISGs because of out-of-range data. Increased ISG15 mRNA expression correlated significantly with heightened TLR7-induced production of IFN-α (P = .008, R = 0.59) and TNF (P = .006, R = 0.62) by pDCs (Figure 1C and 1D), while no significant correlations were observed between cytokine production by pDCs and IFI6 and IFI44 mRNA levels (Supplementary Figure 8). However, expression of both ISGs showed a moderate relationship with TNF production (IFI6: P = .05, R = 0.46; IFI44: P = .09, R = 0.40). No significant associations were observed between the investigated ISG mRNA levels in PBMCs and proviral DNA levels (data not shown).
DISCUSSION
Type I IFNs produced by pDCs play a central role in controlling viral infections through induction of ISGs with antiviral activity [6]. However, their impact on the HIV-1 reservoir sizes in people with HIV (PWH) is unclear. In a cohort of 20 cisgender WWH on stable ART, we describe an inverse association between in vitro type I IFN responses of pDCs following TLR7 activation and HIV-1 reservoir sizes, identifying type I IFNs as potential modulators of the size of the latent HIV-1 reservoir in WWH.
During HIV-1 infection, type I IFNs exhibit a dual role in viral control and immune activation. In early antiviral defense, their role is reflected by restricting viral replication [6]. Previous studies have demonstrated that HIV-1 ssRNAs are sensed by TLR7, inducing the production of cytokines by pDCs [5, 6]. In line with these studies, we observed significant induction of IFN-α and TNF production by pDCs upon TLR7 stimulation in WWH. Notably, cytokine production by pDCs showed significant variability in the study participants, allowing us to correlate pDC responsiveness with HIV-1 reservoir sizes. These analyses demonstrated a significant inverse association between the strength of TLR7-induced cytokine production by pDCs and the size of the intact and total proviral HIV-1 DNA reservoir in CD4 T cells isolated from the same blood sample (Figure 1, Supplementary Figure 5). As IFN-α responses correlated with intact proviral reservoirs and TNF responses were associated with total proviral reservoirs, it remains to be determined whether TNF or IFN-α production were the principal drivers of these inverse associations with HIV-1 reservoir sizes. The observed correlations are consistent with studies suggesting an inhibitory role of pDCs in HIV-1 latency establishment, which demonstrated restriction of HIV-1 by IFN-α before integration in cell culture models, potentially reducing integrated proviral DNA [12]. Although our study population, potentially due to the small sample size, showed no significant correlation between age of study participants and IFN-α production by pDCs, as previously described by others [13], we observed a significant positive correlation between age and total proviral HIV DNA levels (P = .004, R = 0.62; Supplementary Figure 9), emphasizing the need to consider age in studies involving WWH. Taken together, these studies in WWH on stable ART provide evidence that type I IFN responses not only play a role in restricting viral replication during untreated HIV-1 infection, but can potentially also impact the size of the HIV-1 reservoir during ART. However, the exact mechanisms responsible for the observed inverse association between type I IFN responses of pDCs and HIV-1 reservoir sizes remain to be determined.
One of the main downstream consequences of type I IFNs is the induction of ISGs that are known to mediate strong antiviral effects [6, 13]. Interestingly, expressions of ISGs in unstimulated PBMCs, in particular ISG15, was significantly associated with the magnitude of IFN-α and TNF responses by pDCs following in vitro TLR7 stimulation, suggesting that ex vivo ISG15 mRNA expression levels might serve as a surrogate marker for the ability of pDCs to respond to TLR7 stimulation. A functional connection between IFN-α activity, ISG expression, and HIV-1 replication has been recently suggested in PWH who interrupted ART, as enhanced expression of several ISGs, including ISG15, IFI6, and IFI44, was linked to delayed rebound of viral replication after discontinuation of ART [14]. Of note, we observed a significant inverse correlation of IFN-α responses with intact proviral DNA levels, which causes viral rebound, providing a potential link between strength of type I IFN responses, the size of the intact proviral DNA reservoir, and kinetics of HIV-1 rebound.
This explorative study included a relatively small sample size, and was limited to cisgender WWH in an attempt to exclude potential confounders, such as sex-specific gene-dosage differences of genes encoded by the X chromosome, including TLR7 [15]. Therefore, the findings of this study must be validated in larger cohorts of PWH, including females and males. Despite these limitations, results from this study show a significant inverse correlation between TLR7-dependent IFN-α production of pDCs and intact proviral DNA levels in WWH, suggesting a potential role of type I IFN responses in influencing HIV-1 reservoir dynamics during suppressive ART, and providing valuable insights for future research aiming at a functional cure for HIV-1.
Supplementary Data
Supplementary materials are available at The Journal of Infectious Diseases online (http://jid.oxfordjournals.org/). Supplementary materials consist of data provided by the author that are published to benefit the reader. The posted materials are not copyedited. The contents of all supplementary data are the sole responsibility of the authors. Questions or messages regarding errors should be addressed to the author.
Notes
Author contributions. R.-J. T. planned experiments. M. P.-G. and S. H. H. gave important intellectual and practical input and guidance. R.-J. T. and B. G. conducted experiments regarding isolation of PBMCs and subsequent TLR7/8 stimulation. R.-J. T. performed flow cytometry and analyzation of flow cytometry data. O. T. K., M. M., and L. J. performed IPDA of CD4 T cells. R.-J. T. performed subsequent analyzation of the IPDA data. H. H. performed qPCR of ISGs. R.-J. T. performed subsequent analyzation of the qPCR data. A. D. and J. H. performed FACS sorting of CD4 T cells. C. H. recruited participants for the cohort and provided clinical information. D. S. and M. J. B. performed multivariable analysis with Stata. R.-J. T. and M. A. wrote the manuscript.
Financial support. This work was supported by the German Research Foundation (Deutsche Forschungsgemeinschaft; Research Unit 5068—Sex Differences in Immunity, to R.-J. T., B. G., M. P.-G., H. H., and M. A.) and the German Center for Infection Research (Project TTU 04.820 to M. M., L. J., and O. T. K.).
References
Author notes
Presented in part: Deutsch-Österreichischer AIDS Congress, Bonn, Germany, March 2023. Abstract 81049; and Gordon Research Conference on Sex Differences in Immunity, Ventura, California, May 2023.
Potential conflicts of interest. S. H. H. is an employee at AdaptVac since August 2021, a company commercializing virus-like particle display technology and vaccines. All other authors report no potential conflicts of interest.
All authors have submitted the ICMJE Form for Disclosure of Potential Conflicts of Interest. Conflicts that the editors consider relevant to the content of the manuscript have been disclosed.

