


Abstract
A subset of antiretroviral therapy-treated persons with human immunodeficiency virus (HIV), referred to as immunological nonresponders (INRs), fails to normalize CD4+ T-cell numbers. In a case-control study involving 26 INRs (CD4 < 250 cells/µL) and 25 immunological responders (IRs; CD4 ≥ 250 cells/µL), we evaluated the potential contribution of transcriptionally competent defective HIV-1 proviruses to poor CD4+ T-cell recovery. Compared to the responders, the INRs had higher levels of cell-associated HIV RNA (P = .034) and higher percentages of HLA-DR+ CD4+ T cells (P < .001). While not encoding replication-competent viruses, the RNA transcripts frequently encoded HIV-1 Gag-p17 and Nef proteins. These transcripts and/or resulting proteins may activate pathway(s) leading to the immunological nonresponse phenotype.
Despite consistent suppression of plasma viral load by antiretroviral therapy (ART), 10%–40% of persons with HIV (PWH) have been reported to exhibit poor CD4+ T-cell count recovery (immunological nonresponders, INR) compared to those with optimal CD4+ T-cell recovery (immunological responders, IR) [1, 2]. The incomplete immune recovery of INR is associated with an increased risk of AIDS-related and unrelated morbidities and mortality [3]. The underlying mechanisms of the immunological nonresponse are not well understood and are likely multifactorial. In addition to age, host genetic, and metabolic factors, an imbalance between production, destruction, and migration of CD4+ T cells have been suggested as possible mechanisms [1, 2, 4]. We have previously demonstrated long-term persistence of transcriptionally active defective human immunodeficiency virus-1 (HIV-1) proviruses in PWH receiving suppressive ART and a correlation with anti–HIV-1 antibody production [5]. Although unable to give rise to replication-competent viruses, some of these defective proviruses are able to express viral proteins in vivo and are thought to have active roles in eliciting both innate and adaptive immune responses [6]. In the present study, we investigated the potential contribution of transcriptionally competent defective HIV-1 proviruses to the poor immune recovery observed in INRs.
METHODS
All 51 participants were enrolled in National Institute of Allergy and Infectious Diseases Institutional Review Board-approved HIV-1 clinical research protocols and provided written informed consent before study participation. Study participants were categorized into 1 of the 2 groups: IR or INR based on CD4+ T-cell counts (CD4+ ≥250 cells/µL, CD4+ <250 cells/µL, respectively). A total of 25 healthy volunteers without HIV-1 infection (matched for age and sex) were also included as controls. Characteristics of the study participants are summarized in Supplementary Table 1. HIV DNA and cell-associated (CA) HIV RNA were simultaneously isolated from peripheral blood mononuclear cells (PBMCs) using the Nucleospin RNA purification kit (Takara Bio) with an on-column DNase I digestion step, following the protocol provided by the manufacturer. Copy numbers of HIV DNA and CA HIV RNA were quantified for the 5′ untranslated region (5′ UTR) of HIV-1 using the primers and probes described in the Supplementary Material. PBMC samples were used for calculation of the levels of HIV DNA and CA HIV RNA. The results were converted to copies/106 CD4+ T cells using percentages of CD4+ T cells in PBMC (which were determined by flow cytometry). Polymerase chain reaction (PCR) amplification of near–full-length HIV DNA and CA HIV RNA and the sequence analyses were performed as previously described [5]. An individualized approach to CA HIV RNA primer selection was adopted, in that best-fit PCR primers were selected based on HIV DNA sequences from the same participant. Details of the approaches used in 5′ long terminal repeat (LTR)-to-3′ LTR RT-PCR for CA HIV RNA are included in the Supplementary Material. For the analyses of HIV-1 genome, near–full-length HIV DNA and CA HIV RNA were defined as PCR amplicons of 9.0 and 8.8 kb in size, respectively. Near–full-length HIV DNA and CA HIV RNA were further divided into 3 subgroups: full-length (FL) intact (FL containing 9 open reading frames with no gene defects); FL hypermutant (FL with hypermutations); and FL INDEL (FL with frameshifting insertion or deletion mutations). Any HIV DNA or CA HIV RNA species that were less than near full length were defined as non-FL. Nonparametric Mann-Whitney test and Fisher exact test were performed for statistical analyses using the Prism software (version 9.3.1). Tables and figures were constructed using the Prism and Adobe Illustrator software.
RESULTS
A cohort of 51 PWHs with prolonged suppression of plasma viremia (HIV RNA levels <50 copies/mL for more than 1 year) were divided into IR and INR groups based on their CD4+ T-cell count. INRs were defined by having total CD4+ T-cell count <250 cells/µL, and IRs by having total CD4+ T-cell count ≥250 cells/µL at 1–25 years after ART initiation. Clinical characteristics including age, sex (majority males), years of HIV-1 infection, years of virologic suppression, presence of viral coinfections, years of ART, nadir CD4+ T-cell count, and ART regimens were comparable between the 2 groups (Supplementary Table 1). PWHs in the INRs group had a median CD4+ T-cell count of 187 cells/µL, which was significantly lower than PWHs in the IRs (median 605 cells/µL, P < .001) and controls without HIV (median 784 cells/µL, P < .001) groups (Table 1). While total CD8+ T-cell counts were comparable between the INR group and the control group without HIV (median 556 cells/µL vs 471 cells/µL, P = .249), total CD8+ T-cell counts in the INR group were significantly lower than those in the IR group (median 556 cells/µL vs 940 cells/µL, P = .001). Of particular note is the higher proportions of INR CD4+ and CD8+ T cells expressing the activation marker HLA-DR as compared to those in the IR group (CD4+ T cells, 21.5% vs 12.0%, P < .001; CD8+ T cells, 41.5% vs 31.0%, P = .037). Reduced percentages of naive CD4+ T cells were observed in the INR group compared to the IR group (naive CD4+ T cells, 16.5% vs 25.0%, P = .038). On the contrary, percentages of memory CD4+ T cells were higher in the INR than in the IR (memory CD4+ T cells, 83.5% vs 75.0%, P = .034). Accordingly, lower ratios of naive/memory CD4+ T cells were observed for the INR group (0.2 vs 0.3 in the INR and IR groups, P = .035). While a similar trend was observed for CD8+ T cells, differences in the ratio of the percentages of naive and memory CD8+ T cells between the INR and IR groups did not reach statistical significance (0.2 vs 0.3 in the INR and IR groups, respectively, P = .152). While the levels of HIV DNA were comparable between the IR and INR groups (median 1827 vs 1575 copies/106 cells, P = .835), levels of CA HIV RNA were significantly higher in the INR compared to the IR group (1593 vs 580 copies/106 cells, P = .034).
T-Cell Characteristics and Levels of HIV DNA and CA HIV RNA of Study Participants
| Characteristic | IR (n = 25) | INR (n = 26) | P Value, IR vs INR | HNC (n = 25) | P Value, IR vs HNC | P Value, INR vs HNC |
|---|---|---|---|---|---|---|
| CD4+ count, cells/µL | 605 (548–730) | 187 (155–246) | <.001 | 784 (677–1030) | .002 | <.001 |
| CD8+ count, cells/µL | 940 (682–1050) | 556 (381–744) | .001 | 471 (365–631) | <.001 | .249 |
| CD4/CD8 ratio | 0.8 (0.5–0.9) | 0.3 (0.2–0.5) | <.001 | 1.9 (1.2–2.3) | <.001 | <.001 |
| % CD4+ HLA-DR+ | 12.0 (10.0–17.0) | 21.5 (16.0–29.0) | <.001 | 8.0 (7.0–10.0) | .003 | <.001 |
| % CD8+ HLA-DR+ | 31.0 (24.0–43.0) | 41.5 (32.0–57.0) | .037 | 27.0 (15.0–36.0) | .013 | <.001 |
| % CD4+ naive, CD4+ CD45RO− | 25.0 (11.0–39.0) | 16.5 (7.5–23.0) | .038 | 26.0 (19.0–41.0) | .634 | .005 |
| % CD4+ memory, CD4+ CD45RO+ | 75.0 (61.0–88.0) | 83.5 (76.3–93.0) | .034 | 74.0 (60.0–81.0) | .627 | .005 |
| % CD8+ naive, CD8+ CD45RO− | 23.0 (12.0–41.0) | 14.0 (11.3–25.0) | .146 | 37.0 (22.0–49.0) | .087 | <.001 |
| % CD8+ memory, CD8+ CD45RO+ | 77.0 (59.0–89.0) | 85.0 (75.0–90.0) | .139 | 63.0 (51.0–79.0) | .073 | <.001 |
| CD4+ naive/memory ratio | 0.3 (0.1–0.6) | 0.2 (0.1–0.3) | .035 | 0.4 (0.2–0.7) | .627 | .005 |
| CD8+ naive/memory ratio | 0.3 (0.1–0.7) | 0.2 (0.1–0.3) | .152 | 0.6 (0.3–1.0) | .083 | <.001 |
| HIV DNA copies/106 CD4+ cellsa | 1575 (540–7882) | 1827 (642–5434) | .835 | … | ||
| CA HIV RNA copies/106 CD4+ cellsa | 580 (40–1331) | 1593 (450–3622) | .034 | … |
Data are median (interquartile range). P values were calculated by Mann-Whitney test.
Abbreviations: CA, cell-associated; HNC, HIV negative control; INR, immunological nonresponder; IR, immunological responder.
aData from 24 IRs and 25 INRs.
Differences in HIV DNA and CA HIV RNA profiles between the IR and INR groups were evaluated. HIV DNA and CA HIV RNA were amplified by 5′ LTR-to-3′ LTR PCR. All PCR amplicons generated through single-genome amplification were directly sequenced. A total of 423 HIV DNA and 116 CA HIV RNA sequences were obtained for the IR; a total of 253 HIV DNA and 94 CA HIV RNA sequences were obtained for the INR (Figure 1A and Supplementary Figure 1). No difference was observed in the proportion of FL intact HIV DNA between the IR and INR groups (5.2% and 4.3%, P = .724). Proportions of FL hypermutant (6.6% and 7.1%, P = .352), FL INDEL (7.3% and 5.9%, P = .927), and non-FL (80.9% and 82.6%, P = .772) among HIV DNA sequences were also comparable between the 2 groups (Supplementary Figure 2). No full-length CA HIV RNA was detected in any of the study participants who were positive for the 5′ LTR-to-3′ LTR RT-PCR (16 participants in the IR and 15 participants in the INR group). No significant differences in the length of HIV DNA (median = 4.4 and 4.1 kb for the IR and INR groups, respectively, P = .908) or CA HIV RNA (median = 2.5 and 2.6 kb for the IR and INR groups, respectively, P = .082) were observed between the 2 groups.
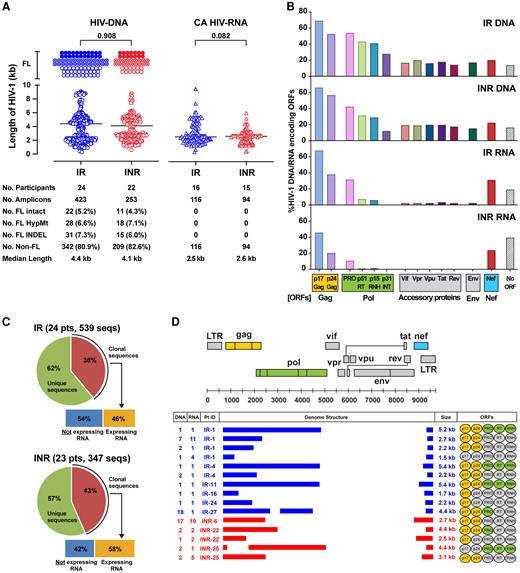
Differences in HIV-1 quasispecies profiles between the IR and INR groups. A, Scatter plots represent the sequence length in kb of HIV DNA and CA HIV RNA amplicons derived from PBMCs of the IR and INR. Each dot represents a unique amplicon. Horizontal bars represent median values (4.4 kb and 4.1 kb, respectively for IR and INR) and P values are given. Total number of amplicons for FL intact (9 kb for HIV DNA; 8.8 kb for CA HIV RNA), FL HypMt, FL INDEL, and non-FL are indicated below the plots. The numbers in parentheses represent the proportion of each HIV-1 type detected in the IR and INR. Statistical significance was evaluated using Mann-Whitney test. B, Bar charts represent the percentages of HIV DNA and CA HIV RNA maintaining translationally competent ORFs. C, Pie charts represent the proportion of transcriptionally competent HIV-1 provirus clones in the IR and INR groups. D, The number of sequences detected in a given participant, genome structures, and sizes in kilobases (kb) of all transcriptionally active HIV-1 provirus clones are shown. The genome structure and sequence coordinate of HIV-1 HXB2 are shown at the top as reference. Ovals in the ORFs column indicate gene segments that are translationally competent (highlighted in yellow for the Gag protein; and green for the Pol protein). Abbreviations: CA, cell-associated; FL, full-length; HIV, human immunodeficiency virus; HypMt, hypermutant; INDEL, frameshifting insertion or deletion; INR, immunological nonresponder; IR, immunological responder; non-FL, less than full length; LTR, long terminal repeat; ORF, open reading frame; PBMC, peripheral blood mononuclear cell; pts, participants; seqs, sequences.
Of the non-FL defective HIV DNA, the majority (83.5% in the IR and 92.5% in the INR group) had gross internal deletions involving the RT to the Env coding regions (Figure 1B). In these defective HIV-1 species, among the most preserved viral protein-coding regions were Gag p17 (69.1% and 66% in the IR and INR groups), Gag p24 (52.4% and 56.6%), and Nef (20% and 22.4%). The profiles of viral protein-coding regions for CA HIV RNA were similar between the 2 groups: 100% IR and 100% INR had gross internal deletions involving the RT to the Env coding regions. All HIV RNA transcripts were in novel unspliced forms and frequently encoded for Gag p17 (67.9% in IR, 45.5% in INR) followed by Gag p24 (37.9% in IR, and 20.1% in INR), and Nef (31.1% in IR, 23.6% in INR) (Figure 1B).
During somatic cell division, HIV-1 provirus integrated in CD4+ T cells is duplicated and exact copies (clones) of the HIV-1 provirus are passed on to daughter cells. Given the high error rate of reverse transcription, each proviral DNA sequence is virtually unique. Thus, detection of identical HIV DNA sequences reflects clonal expansion of CD4+ T cells infected with HIV-1. Sequencing of all HIV DNA and CA HIV RNA species revealed that 38% of HIV-1 proviruses in the IR group were clonal, and 46% of them were associated with corresponding RNA transcripts (Figure 1C). Similarly, 43% of proviruses in the INR group were clonal, and 58% of the provirus clones were found to be transcriptionally active (Figure 1C). There was no difference in the proportion of transcriptionally active HIV-1 provirus clones between the IR and INR groups (P = .864).
Genome structures of clonal HIV DNA with corresponding CA HIV RNA are shown in Figure 1D. A total of 10 transcriptionally active HIV-1 provirus clones were detected in 6 different IRs; a total of 5 transcriptionally active HIV-1 provirus clones were detected in 3 different INRs. All showed gross internal deletions, involving the segment from the 5′ end of Pol to the 5′ end of Nef coding regions. Despite having large internal deletions (median deletion size, 6.4 kb; range, 3.6–7.5 kb), Gag coding regions were frequently preserved among these provirus clones expressing HIV RNA transcripts (Gag p17 in 93% of clones; Gag p24 in 85% of clones).
DISCUSSION
Currently available ART regimens are markedly effective at suppressing HIV-1 replication, increasing CD4+ T-cell counts, and improving clinical outcomes among PWH [7]. However, a certain proportion of treated PWH (approximately 10%–40%) fail to achieve CD4+ T cells ≥250 cells/µL despite achieving virologic success (prolonged suppression of plasma HIV RNA levels <50 copies/mL) [1, 2]. While a long-term follow-up of the individuals in the START trial showed that a delay in initiation of ART was associated with lower CD4+ T-cell recovery [8], no underlying mechanism has been identified. CD4+ T-cell homeostasis is regulated by a dynamic balance between cell production and destruction. Of note, total CD8+ T-cell counts in the INR group were significantly lower than those in the IR group (Table 1). Possible mechanisms include a lack of naive cells pretherapy and/or some factor affecting total lymphocyte numbers. The nadir CD4+ T-cell count was lower in the INR group compared to that in the IR group. While the difference did not reach statistical significance (61.7 vs 119.0 cells/µL, P = .392; Supplementary Table 1), these data suggest that some irreversible damage might have been done to the ability of the CD4+ T-cell pool to fully reconstitute. The INRs in the present study had higher levels of CA HIV RNA and a higher proportion of activated CD4+ T cells compared to the IRs. No differences were seen in proportions of near–full-length intact HIV-1, number of viral protein-coding regions, and proportions of transcriptionally competent HIV-1 provirus clones. Consistent with other studies [9–11], we have found a higher frequency of activated CD4+ T cells in the INR group compared to the IR. By extending these previous observations, we have also demonstrated an association of higher levels of HIV RNA transcripts in the INR group. Given, no full-length HIV RNA was detected in any of the participants examined in the present study, HIV RNA transcription was mainly fueled by defective proviruses. Given that viral transcripts from defective proviruses can be translated [6], these viral proteins could have some pathophysiological roles, as demonstrated in a recent publication [12] (J Infect Dis. 2023. DOI:10.1093/infdis/jiad503). Given the absence of full-length intact HIV RNA transcripts in the INRs (as well as in the IRs; Figure 1A), direct cell killing by ongoing HIV-1 replication is unlikely to be a critical factor contributing to the poor CD4+ recovery in INRs. We have previously demonstrated that defective HIV-1 proviruses produce RNA transcripts that encode viral proteins in vitro and in vivo and a correlation between levels of CA HIV RNA and antibody responses to HIV-1 and levels of activated T cells [5, 6, 13]. While intact HIV virions clearly have cytopathic effects on CD4+ T cells and are associated with CD4+ T-cell depletion, it seems possible that defective proviruses may also have an effect on T-cell homeostasis [14]. In addition to intracellular effects, defective proviral DNA-encoded HIV-1–associated proteins encapsulated in exosomes is another possible mechanism for how defective HIV-1 proviruses could exert pathogenetic effects on uninfected cells [15]. Further understanding the pathway(s) involved in the poor CD4+ T-cell recovery is required to develop novel therapies aimed at achieving better immune recovery in the subset of individuals referred to as INRs.
Supplementary Data
Supplementary materials are available at The Journal of Infectious Diseases online (http://jid.oxfordjournals.org/). Supplementary materials consist of data provided by the author that are published to benefit the reader. The posted materials are not copyedited. The contents of all supplementary data are the sole responsibility of the authors. Questions or messages regarding errors should be addressed to the author.
Notes
Acknowledgments. We thank S. Paudel and T. Imamichi for support in Sanger sequencing, and J. Adelsberger and M. Bosche for preparation of clinical specimens.
Disclaimer. The views expressed in this article are those of the authors and do not necessarily represent the views of the National Institute of Allergy and Infectious Diseases or Frederick National Laboratory for Cancer Research. The content of this article does not necessarily reflect the views or policies of the Department of Health and Human Services, nor does mention of trade names, commercial products, or organizations imply endorsement by the US Government.
Data availability. The sequences reported in this paper have been deposited in the GenBank database (accession Nos OR736737–OR737622).
Financial support. This work was supported by the Intramural Research Program of the National Institute of Allergy and Infectious Diseases, National Institutes of Health (NIH) and the NIH Clinical Center. This work was funded in part with federal funds from the National Cancer Institute, NIH, (grant number HHSN261200800001E).
References
Author notes
Presented in part: IAS 2023, the 12th IAS Conference on HIV Science, Brisbane, Australia, 23–26 July 2023 (abstract EPA0025).
Potential conflicts of interest. J. A. K. and H. C. L. are investigators on a clinical trial of pembrolizumab being conducted under a Cooperative Research and Development Agreement between the NIH and Merck Sharp & Dohme Corp. J. A. K. is a principal investigator of a Cooperative Research and Development Agreement between the NIH and Matinas BioPharma Holdings, Inc to develop encochleated medications. All other authors report no potential conflicts.
All authors have submitted the ICMJE Form for Disclosure of Potential Conflicts of Interest. Conflicts that the editors consider relevant to the content of the manuscript have been disclosed.

