


Abstract
Natural killer (NK) cells are dysfunctional in chronic human immunodeficiency virus (HIV) infection as they are not able to clear virus. We hypothesized that an infusion of NK cells, supported by interleukin 2 (IL-2) or IL-15, could decrease virus-producing cells in the lymphatic tissues.
We conducted a phase 1 pilot study in 6 persons with HIV (PWH), where a single infusion of haploidentical related donor NK cells was given plus either IL-2 or N-803 (an IL-15 superagonist).
The approach was well tolerated with no unexpected adverse events. We did not pretreat recipients with cyclophosphamide or fludarabine to “make immunologic space,” reasoning that PWH on stable antiretroviral treatment remain T-cell depleted in lymphatic tissues. We found donor cells remained detectable in blood for up to 8 days (similar to what is seen in cancer pretreatment with lymphodepleting chemotherapy) and in the lymph nodes and rectum up to 28 days. There was a moderate decrease in the frequency of viral RNA-positive cells in lymph nodes.
There was a moderate decrease in HIV-producing cells in lymph nodes. Further studies are warranted to determine the impact of healthy NK cells on HIV reservoirs and if restoring NK-cell function could be part of an HIV cure strategy.
Clinical Trials Registration. NCT03346499 and NCT03899480.
(See the Editorial Commentary by Altfeld and Müller-Trutwin on pages 1249–51.)
During primary infection, human immunodeficiency virus (HIV) establishes tissue reservoirs that include a large population of HIV-infected CD4 T cells with a transcriptionally silent HIV provirus [1] that are thought to persist via homeostatic proliferation [2, 3]. However, HIV reservoirs can also be maintained by ongoing virus production and/or replication in tissue sanctuaries such as lymphatic tissues and the gastrointestinal tract [4–6] despite antiretroviral therapy (ART). Ideally, any strategy to cure HIV should eliminate both the latent reservoir of cells with an inducible provirus and cells productively making virus.
Natural killer (NK) cells are a central component of the innate immune system that could be exploited to assist in the elimination of both forms of the HIV reservoir. NK cells can mediate potent antitumor and antiviral responses and they play an important role in immune surveillance. However, in HIV infection, the activity of NK cells is inhibited due to HIV selective modulation of MHC-I molecules on the infected cell surface, which impairs NK cell killing. The HIV Nef protein downregulates HLA-A, HLA-B, and HLA-E, while HIV Vpu partially downregulates HLA-C [7–10] resulting in reduced susceptibility of infected cells to recognition by virus-specific T cells. Downregulation but retention of HLA-C and HLA-E impairs the response by NK cells that specifically express KIR2DL1/2/3 and CD94/NKG2A, which are the inhibitory receptors for HLA-C and HLA-E, respectively [11, 12]. Thus, NK cell function is impaired in people with HIV (PWH) and an important line of defense against viral infections is missing.
Several strategies have been tested to augment NK cell function in the setting of cancer, particularly using alloreactive NK cells in leukemia. Our group was the first to show that HLA half-matched allogeneic NK cells from related donors given after high-dose cyclophosphamide and fludarabine lymphodepletion [13] can lead to significant expansion of NK cells in vivo and persistence in recipients for at least 14 days. Until recently, interleukin 2 (IL-2) was the only cytokine available to support allogeneic lymphocytes in vivo. IL-2 has been used clinically for many years in the setting of cancer therapy and was studied in 2 large trials of PWH to determine if it provided a clinical benefit with larger populations of CD4 T cells and fewer opportunistic infections [14]. In contrast, IL-15 is another cytokine with potential to prolong lymphocyte activity by working directly on NK cells and both CD4 and CD8 T cells [15]. While IL-15 physiologically stimulates both NK and CD8 T-cell effector functions, in vitro it can also activate HIV-infected IL-15R/IL-2Rβγ+ CD4 T cells to produce viral gene transcripts [16, 17], potentially making them targets for NK cell killing. Up to 40% of patients undergoing lymphodepletion and a single infusion of NK cells supported by one of these cytokines achieved a sustained remission of their disease [18–22]. We conducted a study of haploidentical NK cells given to PWH on stable ART and supported by either IL-2 (aldesleukin) or N-803, an IL-15 superagonist (ImmunityBio).
METHODS
Study Design and Setting
The study was conducted at the University of Minnesota (UMN) on the Minneapolis campus. The first participant was enrolled on 16 October 2017 and the last participant on 13 February 2020. Inclusion criteria included age 18–65 years, stable ART for at least 12 months, plasma HIV RNA below the limit of detection for at least 6 months, and recent CD4 T-cell counts > 500 cells/µL. Exclusion criteria included other active infection (eg, hepatitis C), pregnancy or breastfeeding, and cardiac, pulmonary, hepatic, or renal diseases of clinical significance.
Screening Procedures
We used the National Institutes of Health Division of AIDS Adverse Event (AE) Grading Scale (version 2.0) and all screening laboratories (eg, complete blood cell count, chemistry panel) were required to be normal or not greater than a grade 1 toxicity on this scale. Other screening procedures included transthoracic echocardiogram showing pulmonary artery pressures in the range of 18–26 mmHg and pulmonary function tests showing forced expiratory volume in first second (FEV1) and the Diffusing capacity for carbon mononxide > 50% of predicted.
Participant Procedures
Leukaphereses were carried out at the MHealth Clinics and Surgeries Center. Colonoscopies with biopsy were carried out at the UMN Medical Center (UMMC) Endoscopy Center. Excisional inguinal lymph node (LN) biopsies were completed at baseline and postinfusion time points by experienced surgeons (J.C. and G.B.) at the UMN Phase 1 Clinical Research Unit (CRU). Participants were admitted to the UMMC for infusion of NK cells, first cytokine dose, and 24-hour observation postinfusion. All subsequent visits occurred in the CRU.
IL-2 and N-803 Dosing
IL-2 was administered to 2 participants at a dose of 6 million units subcutaneously 4 hours after infusion of NK cells (day 0) and again at days 2, 4, 6, 8, and 10 (Figure 1). Participants were observed in the CRU for up to 4 hours after each outpatient dose. N-803 was given subcutaneously at a dose of 6 µg/kg 4 hours after the NK cells (day 0) were infused and again at day 21 and 42.
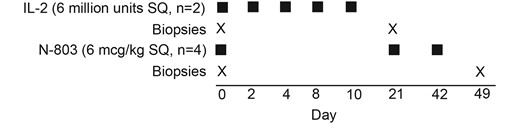
Schematic presentation of the clinical protocol showing the drug, timing, dose, and number of participants who received either IL-2 or N-803. There were 2 participants in the IL-2 arm, of whom 1 individual (2474) had only the postinfusion biopsy obtained. There were 4 individuals in the N-803 arm, of whom 1 individual (2611) had the baseline biopsy and we were unable to obtain the postinfusion biopsy due to COVID-19 restrictions. Abbreviations: IL-2, interleukin 2; SQ, subcutaneous.
Details about donor NK cell harvest, peripheral blood mononuclear cell (PBMC) processing, plasma HIV RNA testing, and flow cytometry to measure specific lymphocyte subsets can be found in the Supplementary Material. Also, methods for in situ hybridization (ISH), immunohistochemistry (IHC), and quantitative image analysis (QIA) have been extensively published [4, 23–26] and, as such, details can be found in the Supplementary Material.
Statistics
To compare the frequency of CD56+ cells (NK cells) in LN to either ileum or rectum we used an unpaired t test. Because of the small sample size, we did not present statistical comparisons for the frequency of viral RNA (vRNA)-positive cells.
Study Approval
All samples analyzed in this study were obtained with the written consent of participants using institutional review board-approved protocols (code numbers 1508M77601 and 00003157). The protocol was approved by the Food and Drug Administration (IND 16486) and registered on ClinicalTrials.gov (NCT03346499 for IL-2 and NCT03899480 for N-803). Participants were recruited through referral by their primary doctor, social media advertisements, and print media.
RESULTS
Protocol
The primary objective of this single-site study was to determine the safety of adoptive transfer of haploidentical NK cells in PWH who are on fully suppressive ART. Our original intent was to enroll 5 individuals who would receive NK cells with IL-2. Shortly after the first 2 participants completed the protocol, N-803 became available and we amended the protocol to use N-803 in place of IL-2 and enrolled 4 additional participants. A dose of 6 µg/kg subcutaneously and frequency of every 3 weeks for 3 doses were chosen based on our earlier dose-escalation study in PWH [27]. The secondary objective was to determine if there were reductions in frequency of vRNA-positive cells in lymphatic tissues.
Participants
A total of 19 individuals were consented and screened. Of those, 12 were eligible and completed the protocol (6 donors and 6 recipients). The primary reason for screen failure was absence of a suitable haploidentical donor as several recipients had HLA identical-matched sibling donors.
Prior to the infusion of NK cells, participants had a baseline inguinal LN biopsy and colonoscopy with biopsy of the ileum, colon, and rectum. These procedures were repeated at postinfusion time points (Figure 1). Two participants (1 receiving IL-2 and 1 receiving N-803) did not complete both LN biopsy collections. The demographic and clinical characteristics of the study cohort are shown in Table 1. All participants were male and White.
Demographic and Clinical Characteristics of Study Participants
| Cytokine | PID | Age, y | Duration of ART, y | Reported CD4 T-Cell Nadir, Cells/µL | CD4 T-Cell Count at Study Entry, Cells/µL | CD8 T-Cell Count at Study Entry, Cells/µL | CD4/CDC8 Ratio at Study Entry |
|---|---|---|---|---|---|---|---|
| IL-2 | 2474 | 51 | 12 | 382 | 1101 | 758 | 1.47 |
| 2558 | 47 | 8 | 300 | 865 | 1012 | 0.85 | |
| N-803, IL-15 superagonist | 2479 | 56 | 13 | 300 | 579 | 571 | 1.01 |
| 2606 | 49 | 12 | 304 | 643 | 261 | 2.46 | |
| 2168 | 36 | 17 | 380 | 570 | 884 | 0.64 | |
| 2611 | 34 | 2 | 380 | 759 | 525 | 1.44 |
Abbreviations: ART, antiretroviral therapy; IL, interleukin; PID, patient identification.
Related Donor NK-Cell Products
The donor NK cells shared variable degrees (3−4 loci) of HLA match at the 6-antigen class I locus by high-resolution typing (Supplementary Table 1). Further results are presented as Supplementary Material.
Primary End Point Analyses
Safety and Tolerability
Participants tolerated the procedures and NK cell and drug infusions well and there were no unexpected safety signals among the 6 participants (Table 2). No AEs were reported in the 6 donors who underwent leukapheresis to obtain NK cells.
Clinical and Laboratory Adverse Events Data in People Receiving NK Cells Plus Either IL-2 or N-803 (... no adverse event at that grade reported)
| Adverse Event | NK Cells and IL-2 (n = 2) | NK Cells and N-803 (n = 4) | ||||||
|---|---|---|---|---|---|---|---|---|
| G1 | G2 | G3 | No. Affected, (%) | G1 | G2 | G3 | No. Affected, (%) | |
| Clinical adverse event | ||||||||
| Injection site erythema | 6 | 4 | … | 2/2 (100) | 7 | 7 | 5 | 4/4 (100) |
| Injection site induration or swelling | 7 | … | … | 2/2 (100) | 1 | 1 | 2 | 4/4 (100) |
| Injection site pruritus | … | … | … | … | 5 | … | … | 3/4 (75) |
| Injection site pain | … | … | … | … | 4 | … | … | 3/4 (75) |
| Paina | 1 | … | … | 1/2 (50) | 5 | … | … | 4/4 (100) |
| Fatigue | 2 | … | … | 2/2 (100) | 4 | … | … | 2/4 (50) |
| Myalgia | 2 | … | … | 1/2 (50) | 4 | … | … | 3/4 (75) |
| Nausea | 1 | 1 | … | 1/2 (50) | 4 | 1 | … | 3/4 (75) |
| Chills | 2 | … | … | 1/2 (50) | 11 | … | … | 4/4 (100) |
| Fever | 2 | 1 | … | 2/2 (100) | 5 | … | … | 4/4 (100) |
| Headache | … | … | … | … | 4 | 1 | … | 4/4 (100) |
| Arthralgia | 1 | … | … | 1/2 (50) | 1 | … | … | 1/4 (25) |
| Dyspnea | 1 | … | … | 1/2 (50) | 1 | … | … | 1/4 (25) |
| Vomiting | 1 | … | … | 1/2 (50) | 1 | … | … | 1/4 (25) |
| Hypertension | 1 | … | … | 1/2 (50) | 2 | … | … | 1/4 (25) |
| Mucositis | … | 1 | … | 1/2 (50) | … | … | … | … |
| Diarrhea | … | … | … | … | 2 | … | … | 2/4 (50) |
| Insomnia | … | … | … | … | 1 | … | … | 1/4 (25) |
| Bruising | … | … | … | … | 1 | … | … | 1/4 (25) |
| Infusion site erythema | … | … | … | … | 1 | … | … | 1/4 (25) |
| Infusion site tenderness | … | … | … | … | 1 | … | … | 1/4 (25) |
| Other clinical AE not identifiedb | … | … | … | … | 23 | 1 | … | 4/4 (100) |
| Laboratory adverse event | ||||||||
| Absolute lymphocyte count, low | … | … | … | … | … | 2 | 1 | 2/4 (50) |
| Albumin, low | 2 | … | … | 1/2 (50) | … | … | … | … |
| Total bilirubin, high | … | … | … | … | 1 | … | … | 1/4 (25) |
| Calcium, low | 3 | … | … | 2/2 (100) | 1 | … | … | 1/4 (25) |
| Creatinine, high | 1 | … | … | 1/2 (50) | 1 | … | … | 1/4 (25) |
| eGFR, low | … | 2 | 1 | 1/2 (50) | … | 4 | … | 4/4 (100) |
| Glucose, high | 5 | … | … | 2/2 (100) | 4 | 1 | … | 4/4 (100) |
| Glucose, low | 1 | … | … | 1/2 (50) | 1 | 1 | … | 1/4 (25) |
| Phosphate, low | 1 | 1 | … | 2/2 (100) | 4 | 1 | … | 4/4 (100) |
| Platelets, low | … | … | … | … | 1 | … | … | 1/4 (25) |
The instances documented for each AE are shown by grade (G1, G2, and G3). Values in the number affected columns are No. affected/No. of participants (overall prevalence of AEs, %).
Abbreviations: AE, adverse event; eGFR, estimated glomerular filtration rate; IL-2, interleukin 2; LN, lymph node; NK cell, natural killer cell.
aPain includes arm pain, knee pain, neck pain, tenderness at LN biopsy site, LN tenderness, and inguinal LN pain.
bOther clinical AE not identified includes events not covered in the National Institutes of Health Division of AIDS AE grading table. This includes nasal congestion, cough, sweating, pallor, swollen tonsils, lymphadenopathy, feeling of heart racing, dizziness, feeling warm at night, arm swelling, feeling spacey, dark urine, lump at peripheral intravenous site, abdominal swelling, and a pinched shoulder nerve.
In the 2 participants receiving IL-2, the most common clinical AEs were injection site erythema and induration. Other clinical AEs reported with IL-2 were fever and fatigue in both participants and myalgias and chills in 1 participant. One participant reported pain that was judged to be related to the LN biopsy. There were no AEs > grade 2 (Table 2), which is consistent with previous studies of IL-2 in PWH [14].
In the 4 participants receiving N-803, the AE profile was similar to what was reported in a previous study [27]. Most AEs were grade 1 and included both local and systemic AEs. There were no signs or reported symptoms associated with cytokine release syndrome or graft-versus-host disease, which has been associated with administration of cytokines or NK cell infusions.
Most laboratory AEs (Table 2) in both study arms were grade 1. There were 2 grade 3 toxicities reported: a low estimated glomerular filtration rate in 1 participant receiving IL-2 and a low absolute lymphocyte count (ALC) in 1 participant receiving N-803. The grade 3 low ALC was reported in the blood drawn 2 days after the first N-803 dose and the duration was approximately 2 days. Another measure was obtained 2 days later and the ALC corresponded to a grade 2 AE. Then, a third measure 3 days after the previous draw was normal.
Secondary End Point Analyses
Changes in Peripheral Blood T Cells and NK Cells
Administration of IL-2 or N-803 is associated with activation and expansion of T and NK cells. We measured the number of peripheral blood NK cells and CD4 and CD8 T cells at multiple time points after infusion of NK cells and plotted changes in the frequency over time (Figure 2A–C). There was a decrease of CD4 T cells, CD8 T cells, and NK cells immediately after infusion of NK cells and initiation of the cytokine therapy, a rebound to frequencies above baseline by day 7, and a return to normal by day 21. The net increase in all 3 cell types tended to be larger in the participants given IL-2.
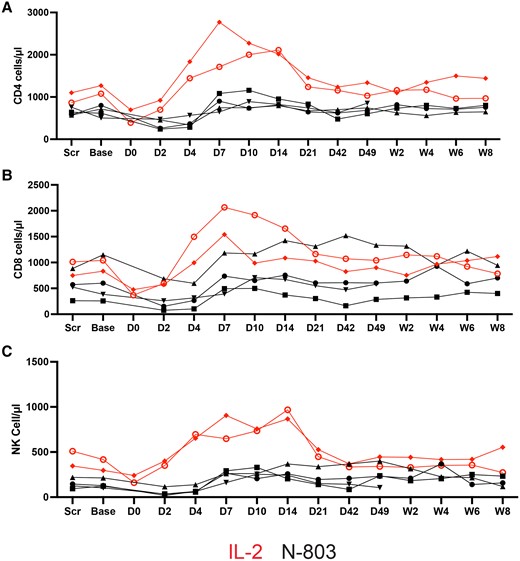
Changes in absolute numbers of (A) CD4, (B) CD8, and (C) NK cells in peripheral blood. The absolute value was determined by multiplying the absolute lymphocyte count by the percentage of lymphocytes that were either CD3+CD4+, CD3+CD8+, or CD3-CD56+ (NK cells). Abbreviations: Base, baseline; D, day; IL-2, interleukin 2; NK cell, natural killer cell; Scr, screen; W, week.
We were interested to know if there were any changes in the size of population of NK cells in gut or LN tissues as a result of cytokine or NK cell therapy. We combined IHC and QIA to measure the frequency of CD56+ NK cells in LN and gut biopsies. An example of an LN, ileum, and rectum section stained with antibodies against CD56 to mark NK cells is shown in Figure 3A–C. We used QIA to determine the frequency of CD56+ cells in the tissues. CD56 will mark NK cells but also a very small population of CD3+ cells. It would be more precise to count CD56+ and CD3− cells using immunofluorescence with antibodies; however, we were not able to do so for technical reasons. Comparing pretreatment frequencies of CD56+ cells to posttreatment did not reveal any differences in LN, ileum, and rectum. However, it should be noted that the follow-up biopsy was always obtained several days after the last cytokine dose was given and it is possible that this approach missed transient T-cell or NK-cell changes in the tissues possibly associated with IL-2 or N-803. We did note significant differences in the frequency of CD56+ cells between LN and the ileum or rectum (Figure 3D).
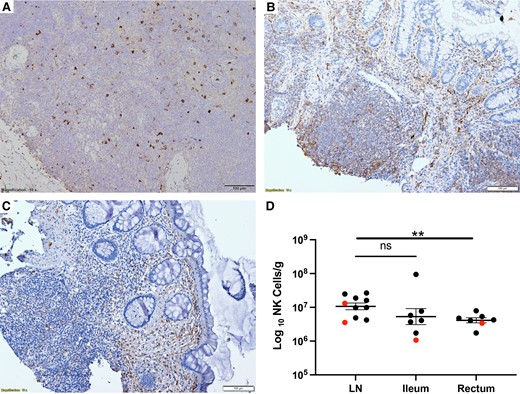
The frequency of CD56+ NK cells in LN, ileum, and rectum obtained one week after the last cytokine infusion. LN (A), ileum (B), and rectum (C) obtained one week after the last cytokine infusion stained with antibodies against CD56 to mark NK cells. Because there was no difference in the baseline and postinfusion frequency of CD56+ cells at each tissue site, we pooled baseline and postinfusion data to compare frequency of cells in each tissue site (D). Results from those receiving IL-2 are marked in red and those receiving N-803 in black. There was no difference between LN and ileum but the frequency in rectum was significantly lower (**P = .01, unpaired t test). Lines represent mean and standard error of the mean. Abbreviations: LN, lymph node; NK cell, natural killer cell; ns, not significant.
Persistence of Transfused NK Cells
When using haploidentical NK cells for treatment of refractory leukemia or solid organ malignancy, it is common practice to pretreat the patient with cyclophosphamide to “make immunologic space” for the transfused cells. Clinical studies have demonstrated that this approach is associated with longer persistence of donor cells in peripheral blood of the recipients. We chose not to pursue a strategy of pretreatment with cyclophosphamide and fludarabine due to the associated toxicity and because PWH on long-term ART have persistent and significant depletion of T cells in the lymphatic tissues [28, 29] (ie, they already have immunologic space available). In the setting of treatment for hematologic malignancy, chimerism studies (identification of donor cells in the recipient) have shown persistence for only 24–48 hours in the absence of lymphodepleting pretreatment but persistence for up to 1 month with high-dose lymphodepletion.
We examined an individual who received NK cells plus IL-2 and 1 who received NK cells plus N-803 by measuring the frequency of cells in peripheral blood that were from the donor, using HLA antibodies that distinguished differences between donor and recipient cells. Figure 4A shows the plot of a participant (2474) who received IL-2, where HLA B7+ cells were detected in PBMCs through day 8 postinfusion. In the participant who received N-803 (2611), the donor was HLA Bw6+ and a measurable population of cells was detected by flow cytometry at least until day 6 (There was not a sufficient number of cells available to examine later time-points). We also used IHC to examine LN and gut tissues obtained at day 21 after NK cell infusion in participant 2474 and identified HLA B7+ cells in those tissues at 28 days after the infusion (Figure 4B and 4C).
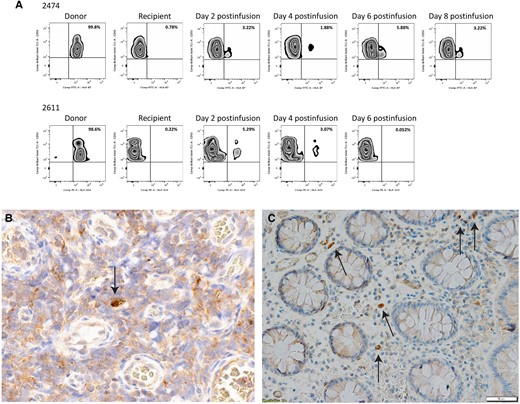
A, Adoptively transferred haploidentical NK cells persist in PBMCs up to 8 days postinfusion in 1 participant who received IL-2 (2474) and 1 who received N-803 (2611). PBMCs from each time point were stained for NK cell markers as well as a donor HLA that was missing in the recipient to look for chimerism. In the participant receiving IL-2, donor cell frequency peaked at day 6 postinfusion. In the participant receiving N-803, donor cell frequency peaked at day 4. The percentage of NK cells that are donor cells is listed in the upper right corner of the graph. Sections from lymph node (B) and rectum (image at 20x magnification) (C) from the IL-2 recipient (2474) obtained at day 21 postinfusion were stained with antibodies directed against HLA-B7, an HLA that was unique to the donor. Arrows show donor NK cells in both tissue sites, with a somewhat greater frequency in the rectum. Image at 20x magnificiation. Abbreviations: FITC, fluorescein isothiocyanate; IL-2, interleukin 2; NK cell, natural killer cell; PBMC, peripheral blood mononuclear cell; PE, phycoerythrin.
Measures of Viral Reservoir in PBMCs and LNs
In the N-803 group, plasma HIV RNA measures were obtained at baseline and days 2, 4, 7, 10, 14, 21, 42, and 49, and again at 2, 4, 6, and 8 weeks after the second biopsy. In the IL-2 group, plasma HIV RNA measures were obtained at baseline, days 2, 4, 6, 8, 10, 14, 21, and 35, and again at 2, 4, 6, and 8 weeks after the second biopsy. Plasma HIV RNA was undetectable at baseline in all participants. We detected small increases in plasma HIV RNA after each N-803 dose in 2 of the 4 participants. In most cases, plasma HIV RNA changed from undetectable to detectable but remained <20 copies/mL. However, 2 participants had 20 and 26 copies/mL of HIV RNA detected on the seventh day after the first drug dose. Plasma HIV RNA was intermittently detected in 1 individual receiving IL-2 but all measures remained < 20 copies/mL.
Next, we measured the frequency of vRNA-positive and vDNA-positive cells in the lymphoid tissues using HIV RNA ISH and DNA ISH (RNAscope and DNAscope; ACD Bio). In previous studies, we have consistently found that in individuals on stable ART without detectable plasma HIV RNA the frequency of vRNA-positive cells in LN was between 1.5 × 10⁴ and 1 × 10⁵ cells/g LN. This corresponds to an average frequency of 70–100 vRNA-positive cells/1 × 106 CD4 T cells [4, 30]. Tissues from LN, ileum, and rectum were cut into multiple 5-µm sections with ISH analysis of 5–10 sections, each separated by at least 20 µm, thereby sampling between 100 and 200 µm of tissue. This procedure to quantify vRNA-positive cells has been extensively validated by us and by and other laboratories [4, 5, 23, 25, 26, 31–34]. As described above, we were able to get both a pre- and postdose LN samples from 4 of the participants. The 2 other participants contributed LN samples at only 1 of the 2 time points. We detected vRNA-positive cells in all 5 LNs obtained at baseline at a mean frequency of 1.2 × 10⁵ (range, 1.9 × 10³–1.6 × 10⁵) cells/g LN tissue. In the 5 LNs obtained at either day 21 (IL-2) or 49 (N-803), the mean frequency was 7.1 × 10⁴ (range, 4.4 × 10⁴–9.9 × 10⁴) cells/g LN tissue. Although statistical analyses were not pursued, a consistent decrease in the frequency of vRNA-positive cells in LNs was noted for the 4 individuals who provided LNs at both baseline and postinfusion time point (Figure 5A). We also measured the frequency of viral vDNA-positive cells in LNs using DNAscope ISH. In contrast to the declines in vRNA+ cells, there was no consistent or evident decline in HIV DNA-positive cells consistent with some expansion of the pool of cells with a defective provirus that was countered by elimination of cells making HIV virions. The mean frequency of HIV DNA-positive cells was 1.7 × 10⁶ cells/g (range, 6.6 × 10⁵–3.9 × 10⁶ cells/g) pre-NK cell infusion and 1.3 × 10⁶ cells/g postinfusion (range, 2.8 × 10⁵–3.0 × 10⁶ cells/g).
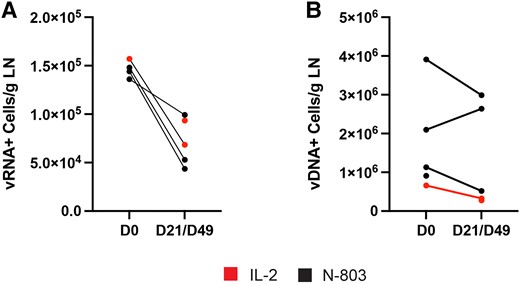
The frequency of (A) vRNA-positive and (B) vDNA-positive cells/g LN is shown. There was a marked and consistent reduction in the frequency of vRNA-positive cells in the 4 participants where we had paired samples but not in the frequency of vDNA-positive cells/g. Abbreviations: D, day; LN, lymph node; vDNA, viral DNA; vRNA, virial RNA.
We were also able to examine rectum and ileum tissues from 4 of the individuals obtained at the same time as the LN biopsy. We found that the mean frequency of vRNA-positive cells in the ileum was 7.5 × 10⁴ cells/g tissue (range, 0–1.7 × 10⁵ cells/g) before therapy and 5.6 × 10³ cells/g tissue (range, 0–1.7 × 10⁴ cells/g) after therapy. In the rectum, the mean frequency of vRNA-positive cells was 1.6 × 10⁴ cells/g tissue (range, 0–1.7 × 10⁴ cells/g) before therapy and 5.3 × 10³ cells/g tissue (range, 0 −1.7 × 10⁴ cells/g) after therapy. Thus, there is some evidence for a reduction of vRNA-positive cells in gastrointestinal tissues as well.
DISCUSSION
Our primary goal in this phase 1 pilot trial was to determine the safety and tolerability of administering haploidentical NK cells to PWH on stable ART without detectable plasma viremia. We found the expected AEs related to administration of IL-2 and N-803 were easily managed. Overall, most clinical and laboratory AEs reported were grade 1. Thus, we found that the administration of haploidentical NK cells followed by cytokine administration using this protocol was safe and well tolerated with expected AEs from N-803 that resolved within 5–7 days.
We measured the frequency of CD56+ cells in tissues before and 1 week after the last cytokine dose. We were interested to know if the overall population of NK cells expanded in tissues because of the potential for cytokine-induced activation. We did not find any significant changes in cell number comparing the baseline to postinfusion. However, we waited at least 1 week after the last infusion before obtaining these samples and it is likely that if there were transient NK-cell increases in the tissues we would have missed it using this approach. This was true for ileum and rectum, although the total number of cells in those tissues was significantly lower than in LN. We were also interested to know if the cells would persist despite not making immunologic room with predose cyclophosphamide and fludarabine, as is typically done in people with a hematologic malignancy. Chimerism studies using flow cytometry to identify the population of donor cells based on the HLA mismatch were conducted in 3 individuals and we found that cells persisted for at least 6–8 days and possibly longer, but we lacked a sufficient sample to test later time points. However, this is similar to cancer patients pretreated with lymphodepleting chemotherapy. In addition, IHC revealed the presence of donor cells in the rectum and LN tissues at day 28 after NK cell infusion in 1 of the participants receiving IL-2. To our knowledge, this is the first time that persistence of donor NK cells has been investigated in lymphatic tissues and we were surprised to find they are capable of persisting for at least 1 month in the absence of lymphodepletion. In this study, we cannot distinguish the contribution of the NK cells alone or added cytokines to any reduction in viral reservoirs, as they are interdependent. However, in xenogeneic mouse models of adoptive transfer of human NK cells, the absence of cytokine support resulted in only transient NK cell persistence. However, coinfusion with IL-2 or IL-15 promotes in vivo persistence for >1 month. This is the main reason why cytokines need to be coadministered with NK cells (as done in our study) or NK-cell genetic engineering of intrinsic cytokine signals, as is being pursued by others [35–37]. Further studies with a larger sample size will be needed to determine differences in reservoir reduction with cytokines alone versus cytokines plus NK cells. It should be noted that several studies indicate that the stimulation of NK cells with IL-15 enhances antibody-dependent cellular cytotoxicity (ADCC) [38–42]. While this needs to be studied further, it suggests that the combination of IL-15, NK cells, and HIV broadly neutralizing antibodies could enhance ADCC, resulting in a greater reduction in HIV reservoirs.
We also found a marked reduction in the frequency of vRNA-positive cells in the LNs and there was a similar decrease in gut tissues but no statistical analyses were presented given the limited number of study participants. These data suggest that providing functional NK cells could be a potential part of a successful strategy to cure HIV. Although it is not practical to consider infusions of haploidentical NK cells on a scale that would benefit the millions of PWH worldwide, this approach does provide the proof of principle for the potential role of these cells in controlling HIV. Several companies are currently studying the effect of NK cells with specific antitumor properties in both hematologic and solid organ malignancies. These cells are commercially manufactured and provided in simple dose packs that are kept frozen until infusion, with no special equipment or processing needed, which allows this approach to be scalable.
This study has limitations. The study population was not diverse as only white men were studied. Also, because this was a safety study with a small sample size that was not powered to fully determine the virologic impact of the intervention, we could not present statistical comparisons for all results. Despite the study limitations, we noted marked reduction in vRNA-positive cells in LNs using HIV RNA ISH. Unfortunately, we did not have sufficient cells from the tissue biopsies to complete confirmatory analyses (eg, intact proviral DNA assay or ultrasensitive measures of P24). Future studies should prioritize additional assessments of the viral reservoir and should ensure there are sufficient cells available to fully assess the functional capacity of NK cells.
Supplementary Data
Supplementary materials are available at The Journal of Infectious Diseases online (http://jid.oxfordjournals.org/). Supplementary materials consist of data provided by the author that are published to benefit the reader. The posted materials are not copyedited. The contents of all supplementary data are the sole responsibility of the authors. Questions or messages regarding errors should be addressed to the author.
Notes
Acknowledgments. The authors thank the study participants who made this study possible.
Author contributions. All authors made significant contributions to this work. J. S. M., S. C., and T. W. S. designed the clinical protocol and, with Jo. R. and A. T. provided oversight for the conduct of the trial. Z. B. D., J. A., G. W., Ja. R., and K. E. provided data analyses. D. M. processed the NK cells after pheresis of the donors. J. T. S. and P. S. S. provided N-803. A. T., S. J., T. W. S., and J. S. M. contributed to identifying participants and following them through the clinical protocol. K. E. oversaw all administrative details related to the study and participated in manuscript preparation. G. J. B. and J. G. C. performed surgery to collect LNs. J. S. M. and T. W. S. prepared the manuscript.
Data availability. Deidentified data are available from the corresponding author upon reasonable request.
Disclaimer. The funders had no role in data collection and analysis, decision to publish, or preparation of the manuscript. The content of this work is solely the responsibility of the authors and does not represent the official views of any institution.
Financial support. This work was supported by the Foundation for AIDS Research (grant number 109496-60-RGRL); the University of Minnesota; and MHealth. Also, this work was assisted by the University of Minnesota Clinical and Translational Science Institute, which is supported by the National Center for Advancing Translational Sciences, National Institutes of Health (grant number UL1TR002494).
References
Author notes
Potential conflicts of interest. J. T. S. and P. S. S. are affiliated with ImmunityBio, which provided N-803 for the trial. Neither of these authors had any influence on study design or data interpretation. All other authors report no potential conflicts.
All authors have submitted the ICMJE Form for Disclosure of Potential Conflicts of Interest. Conflicts that the editors consider relevant to the content of the manuscript have been disclosed.

