


Abstract
The 3′ untranslated regions (UTRs) of Ebola virus (EBOV) mRNAs are enriched in their AU content and therefore represent potential targets for RNA binding proteins targeting AU-rich elements (ARE-BPs). ARE-BPs are known to fine-tune RNA turnover and translational activity. We identified putative AREs within EBOV mRNA 3′ UTRs and assessed whether they might modulate mRNA stability. Using mammalian and zebrafish embryo reporter assays, we show a conserved, ARE-BP-mediated stabilizing effect and increased reporter activity with the tested EBOV 3′ UTRs. When coexpressed with the prototypic ARE-BP tristetraprolin (TTP, ZFP36) that mainly destabilizes its target mRNAs, the EBOV nucleoprotein (NP) 3′ UTR resulted in decreased reporter gene activity. Coexpression of NP with TTP led to reduced NP protein expression and diminished EBOV minigenome activity. In conclusion, the enrichment of AU residues in EBOV 3′ UTRs makes them possible targets for cellular ARE-BPs, leading to modulation of RNA stability and translational activity.
The posttranscriptional regulation of mRNA stability and metabolism is an important aspect of gene expression that provides a means for dynamic fine-tuning of downstream protein expression. The availability and abundance of mRNA transcripts for the host translation machinery is tightly regulated by RNA binding proteins (RBPs) and their associated RNA sequence elements. AU-rich elements (AREs) are cis-acting sequence elements located within the 3′ untranslated region (3′ UTR) of mRNAs and are important components of regulating mRNA half-life. AREs are highly variable but are generally classified based on the distribution, quantity, and overlap of a basic AUUUA motif [1–4]. Class I AREs commonly include instances of the canonical AUUUA motif, class II contain regions of overlapping AUUUA sequences, whereas class III AREs do not contain this pentameric motif, although they are still AU-rich [1, 5]. Many cellular mRNAs, particularly from transiently expressed genes such as cytokines, chemokines, and growth factors, contain AREs in their 3′ UTRs that allow for fine-tuned protein production [3, 6–10]. AREs are recognized by various RBPs that comprise complex regulatory networks and promote mRNA stability or degradation [1, 4]. Tristetraprolin (TTP; ZFP36) is a canonical and well-characterized RBP that binds AREs and targets mRNAs mainly for degradation [8, 11–14]. Human antigen R (HuR; ELAVL1) is another well-studied ARE-BP that promotes mRNA stability and protein translation [4, 11, 15, 16].
Posttranscriptional regulation of mRNA is not only important for cellular RNA metabolism but may also have implications on the replication and pathogenesis of viruses. The presence of viral RNAs in infected cells leaves them prone to recognition by host RBPs, which may negatively or positively impact viral replication. Indeed, multiple ARE-BPs involved in RNA degradation or stabilization, including TTP and HuR, have been shown to interact with viral RNAs, affecting the outcome of viral infection [17–24]. For example, TTP has been shown to bind to human immunodeficiency virus-1 (HIV-1) genomic RNA, which is AU rich, and alters the expression of certain HIV proteins, leading to reduced HIV virion production [17, 23]. As a promoter of mRNA stability, HuR is an attractive cellular target during viral infection, and has been shown to interact with RNAs from a number of different viruses, including classical swine fever virus [18] and Sindbis virus [19], to enhance viral infection. The interaction between viral RNAs and cellular ARE-BPs may also serve as a mechanism to sequester these proteins within viral replication compartments or compete with endogenous mRNAs, thereby modulating the downstream activity of those proteins [25].
The highly pathogenic Ebola virus (EBOV) belongs to the group of nonsegmented, negative-sense RNA viruses. The EBOV genome encodes 7 monocistronic mRNAs that are flanked by unusually long 5′ and 3′ UTRs [26]. Previous work with bicistronic EBOV minigenomes showed that the EBOV 3′ UTRs modulate reporter gene expression [27–29]. Potential mechanisms for these observations include regulation of mRNA synthesis, mRNA stabilization, or mRNA translation. Some mechanistic insight into the role of the filovirus 3′ UTRs in regulating translation was provided by a recent study that showed that editing of the 3′ UTRs of the Marburg virus (MARV) Angola nucleoprotein (NP) mRNA and the EBOV VP40 mRNA by adenosine deaminases acting on RNA 1 (ADAR1) modulated translation [30]. This study also showed that the regulation of translation by MARV 3′ UTRs occurred independently of microRNAs. We have previously shown that numerous RBPs, including ARE-BPs, are sequestered within EBOV inclusions [31]. However, it is not known whether ARE-BPs are involved in modulating EBOV mRNA metabolism.
Here we show that the 3′ UTRs of EBOV mRNAs are enriched in their AU content compared to the open reading frames (ORFs) of the 7 genes and that some of the EBOV 3′ UTRs contain canonical AREs. This prevalence of AU-rich regions suggests that the stability of EBOV mRNAs might be regulated by cellular ARE-BPs. We show that the 3′ UTRs of the EBOV NP, VP35, VP30, and VP24 mRNAs lead to increased 3′ UTR reporter assay activity in both mammalian cells and fish embryos. We further demonstrate that the 3′ UTR of EBOV NP mRNA, which contains 3 canonical class I AREs, can be targeted by TTP, a prototypic ARE binding protein and modulator of RNA stability. TTP overexpression led to downregulation of EBOV NP mRNA and protein expression as well as reduced EBOV minigenome activity. These results demonstrate that EBOV 3′ UTRs can function as targets for cellular RNA stability machinery.
METHODS
The methods used are described in the figure legends and in the Supplementary Methods.
RESULTS
Ebolavirus 3′ UTRs Enhance Reporter Gene Expression
Compared to the 59% AU content of the 19-kb EBOV Mayinga genome, the 3′ UTRs of all viral mRNAs are enriched in their AU content, ranging from 65% to 70.7% (Supplementary Figure 1A and 1B). Moreover, 6 out of the 7 EBOV mRNAs contain putative class I and class III AREs within their 3′ UTRs. These include the mRNAs encoding the nucleocapsid proteins NP, VP35, VP30, and VP24, suggesting they might be targets of ARE-BPs (Figure 1).
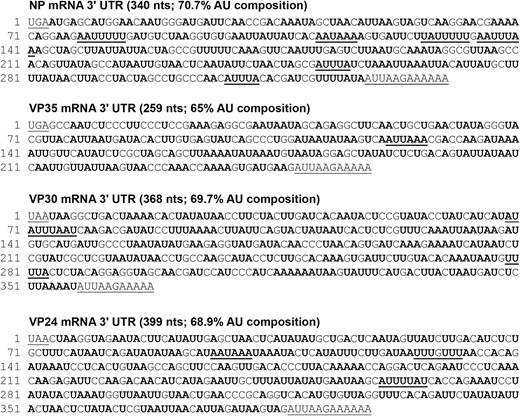
The 3′ UTRs of Ebola virus mRNAs are AU rich. The 3′ UTR sequences of Ebola virus NP, VP35, VP30, and VP24 mRNAs. A and U residues are shown in bold. Potential AREs as defined by the AREsite software (http://nibiru.tbi.univie.ac.at/AREsite2/welcome) are underlined. These include the following motifs: AUUUA, WUUUW, WWUUUWW, WWWUUUWWW WWWWUUUWWWW, WWWWWUUUWWWWW, UUUGUUU, GUUUG, and AWUAAA which are underlined. W = A or U. Abbreviations: ARE, AU-rich elements; nts, nucleotides; UTR, untranslated region.
To first broadly examine whether the NP, VP35, VP30, and VP24 3′ UTRs modulate mRNA stability, we used a luciferase-based reporter assay. The respective EBOV 3′ UTRs were inserted downstream of the firefly luciferase ORF in the pMIR-REPORT plasmid to create luciferase mRNA transcripts containing EBOV-specific viral 3′ UTRs. The pMIR-REPORT plasmid containing the 3′ UTR of the IL-6 mRNA and empty pMIR-REPORT encoding an 83-nucleotide–long 3′ UTR that does not contain any AU-rich sequences (pMIR-REPORTempty) were used as controls. The 3′ UTR of the interleukin 6 (IL-6) mRNA contains AREs and serves as a binding site for numerous ARE-BPs, mediating both degradation and stabilization [32, 33]. While the IL-6 3′ UTR did not have a significant impact on luciferase activity compared to the negative control, there was a 2- to 6-fold increase in luciferase activity in cells transfected with the reporter constructs containing the EBOV 3′ UTRs (Figure 2A). This suggests that the tested EBOV 3′ UTRs might confer stability to their associated mRNAs. While the observed effects were subtle, this is not unexpected as ARE-BPs generally fine-tune protein expression instead of drastically altering expression levels [10, 34]. The IL-6 mRNA is unstable with a half-life of about 30 minutes. The determinants that confer instability are attributed to the 3′ UTR [32]. It was therefore surprising that we did not observe a significant downregulation of reporter gene activity in the cells transfected with the IL-6 3′ UTR construct. Because IL-6 expression is a hallmark of an inflammatory response, it is conceivable that crucial ARE-BP targeting the IL-6 3′ UTR are not expressed under noninflammatory conditions. It could also be a cell type specific effect. Finally, it is possible that the constitutive transcription of the luciferase gene in the reporter assay counteracted the destabilization conferred by the IL-6 3′ UTR. We therefore analyzed the role of the EBOV 3′ UTRs in a reporter system that separates mRNA production from posttranscriptional events including translation.
Ebola virus 3′ UTRs enhance luciferase reporter activity in transfected cells and injected zebrafish embryos. A, Transfection assay. 1.5 × 10⁵ 293T cells were seeded per well of a 12-well plate and transfected 1 day later with 100 ng of pMIR-REPORT firefly luciferase plasmids containing the indicated 3′ UTRs and 100 ng of a pMIR-β-gal expression plasmid as a transfection control. pMIR-REPORTempty containing no added gene-specific 3′ UTR served as the negative control (Empty). Cell lysates were harvested 2 days posttransfection and measured for luciferase and β-gal activity. Luciferase values were normalized to β-gal activity (converted to milliunits), and the normalized luciferase values for the negative control were set to one. The normalized luciferase values for each individual 3′ UTR-luciferase reporter construct were then compared to the negative control, which was set to one. Statistical analysis was performed with the GraphPad Prism software, using a 1-sample t test analysis; n = 5 for all conditions. B, Zebrafish embryo injection assay. A schematic of the assay is depicted on the right. One-cell stage embryos were each injected with 5 pg of mRNA encoding nanoluciferase and the indicated 3′ UTR together with 50 pg of firefly luciferase mRNA. Six hours after injection, embryos were pooled in groups of 7 and collected in lysis buffer. Multiple groups were assayed in 2 injection rounds performed on 2 different days. Nanoluciferase values were normalized to firefly luciferase values and compared to the negative control (empty), which was set to one. Circles and rhombi represent the individual groups of 7 embryos injected with the same mRNAs on 2 different days. Statistical analysis was performed with the GraphPad Prism software, using 1-way ANOVA. NS P value > .05, * P value ≤ .05, ** P value ≤ .01, *** P value ≤ .001, **** P value ≤ .0001. Error bars in A depict standard deviation. Error bars in B depict the standard error of the mean. Abbreviations: β-gal, β-galactosidase; hpi, hours post injection; IL-6, interleukin 6; NP, nucleoprotein; NS, not significant; UTR, untranslated region.
To uncouple mRNA synthesis from posttranscriptional regulation, we used a zebrafish embryo injection model that is widely used to study conserved mechanisms of RNA regulation, including the analysis of 3′ UTRs [35]. This model is based on the injection of defined amounts of in vitro transcribed mRNAs, allowing for comparative analysis of posttranscriptional regulation of mRNA stability and translation (Figure 2B). The 3′ UTRs of NP, VP35, VP30, VP24, IL-6, and pMIR-REPORTempty were cloned into vector pCS2+/Nluc downstream of the nanoluciferase reporter gene. The respective mRNAs were in vitro transcribed, and equal mRNA amounts were injected into 1-cell stage embryos along with a control mRNA for quantification. Similar to the pMIR-REPORT system, the presence of the viral 3′ UTRs led to higher levels of reporter gene activity than the empty control or the IL-6 3′ UTR did. In the embryo injection model, reporter gene activity of the IL-6 3′ UTR sample was significantly downregulated, as expected for a rapidly decaying mRNA (Figure 2B). This is likely due to the binding of destabilizing ARE-BPs to the IL-6 3′ UTR as described previously [33]. Because the profile of reporter gene activity was maintained between the mammalian transfection assay and the zebrafish embryo mRNA injection assay, this suggests that the observed luciferase changes in the transfection assay were mainly driven by posttranscriptional regulation rather than by differences in mRNA synthesis. These results underscore that across species and models, the EBOV 3′ UTRs confer stability to their respective mRNAs, likely through interactions with stabilizing RNA BPs, or competition with destabilizing RNA-BPs. In both systems, we observed the most profound effects for the NP 3′ UTR (4- to 5-fold increase in reporter gene activity). This is in line with a higher number of putative AREs in the NP 3′ UTR, including 3 canonical AUUUA motifs, compared to the VP35, VP30, and VP24 3′ UTRs.
TTP Downregulates NP 3′ UTR Luciferase Activity
We next analyzed if well-characterized ARE-BPs altered the luciferase activity in cells cotransfected with the EBOV 3′ UTR-containing pMIR-REPORT plasmids. To do so, we focused on the effects of 2 prototypic ARE-BPs, TTP, and HuR, known to destabilize and stabilize their targets respectively, in the 3′ UTR-luciferase reporter system [11–13, 34, 36]. 293T cells were transfected with pMIR-REPORT plasmids containing the individual EBOV 3′ UTRs together with or without expression plasmids encoding HuR (Figure 3A) or TTP (Figure 3B). The 3′ UTR of TNFα mRNA is a known target of HuR [37] and was used as a positive control. The IL-10 3′ UTR is not targeted by HuR and served as an additional negative control in this assay [38]. Coexpression of HuR with the EBOV 3′ UTR-luciferase reporters did not increase luciferase activity (Figure 3A). However, luciferase activity driven by the reporter plasmid containing the TNFα 3′ UTR was only increased by about 2-fold in cells cotransfected with the HuR expression plasmid, indicating that the overexpression of HuR did not lead to greatly enhanced mRNA stability (Figure 3A). Transfecting higher amounts of the HuR expression plasmid did not significantly change reporter gene expression of the control 3′ UTR luciferase constructs. As HuR is constitutively expressed in most cell types [36], it is conceivable that the presence of endogenous HuR in these transfected cells might account for the small increase in luciferase activity for the TNF-α 3′ UTR-containing reporter due to HuR saturation. Attempts in our laboratory to knockdown HuR in mammalian cells using siRNAs led to inconclusive results, possibly because HuR may be essential for cell survival [39]. Therefore, it is inconclusive whether HuR mediates any effect on the 3′ UTRs of EBOV mRNAs.
TTP represses NP 3′ UTR-luciferase reporter activity. 293T cells were seeded in 12-well plates at a density of 1.5 × 10⁵ cells per well and transfected 1 day later with individual pMIR-REPORT plasmids containing the indicated 3′ UTR or pMIR-REPORTempty (empty) as a negative control along with 100 ng of pMIR-β-gal as a transfection control. Cells were transfected with 100 ng of the pMIR-REPORT plasmids alone or with an additional expression plasmid encoding HuR, 100 ng (A) or TTP, 25 ng (B). Cell lysates were harvested 2 days posttransfection and measured for luciferase and β-gal activity. Luciferase values were normalized to β-gal activity, which was converted to milliunits. The normalized luciferase values for the individual 3′ UTR pMIR-REPORT constructs in the presence of the indicated ARE-BP were divided by the normalized luciferase values for the individual 3′ UTR pMIR-REPORT constructs in the absence of any ARE-BP. These values were then compared to the negative control, which was set to one; n indicates the number of replicates for each condition. Statistical analysis was performed using the GraphPad Prism software, using their 1-sample t test analysis. NS P value > .05, * P value ≤ .05, ** P value ≤ .01, *** P value ≤ .001, **** P value ≤ .0001. Error bars depict the standard deviation. Abbreviations: ARE-BP, binding proteins targeting AU-rich elements; β-gal, β-galactosidase; HuR, human antigen R; IL, interleukin; NP, nucleoprotein; NS, not significant; TNF-α, tumor necrosis factor-α; TTP, tristetraprolin; UTR, untranslated region.
In contrast to HuR, transfection of higher pCDNA3.1-myc-TTP plasmid amounts led to the nonspecific downregulation of luciferase activity from the construct that did not possess an ARE-containing 3′ UTR (Supplementary Figure 2). However, TTP transfected at lower concentrations still showed a potent negative regulatory effect on specific targets, while making little difference to the negative control. Therefore, low amounts of the pCDNA3.1-myc-TTP plasmid were used to test the effects of EBOV 3′ UTRs on mRNA stability. While coexpression of TTP with the EBOV 3′ UTR constructs did not affect luciferase activity from the VP35, VP30, and VP24 3′ UTR plasmids, the luciferase activity in cells transfected with the reporter plasmid containing the NP 3′ UTR was decreased about 7-fold compared to the empty control (Figure 3B). This decrease in luciferase activity was comparable to what was observed for the reporter plasmid containing the 3′ UTR of IL-10. The IL-6 3′ UTR led to a 26-fold decrease in reporter gene activity. Both IL-10 and IL-6 are well characterized targets of TTP-mediated degradation and undergo rapid turnover within the cell [40, 41]. Together, these data suggest that TTP targets NP specifically and may have a negative regulatory effect on NP expression.
TTP Negatively Regulates NP mRNA and Protein Levels Through the NP 3′ UTR
To explore if the TTP-mediated reduction in reporter gene activity observed for the NP 3′ UTR construct (Figure 3B) correlated with a decrease in mRNA levels, plasmid pMIR-REPORT-NP 3′ UTR or plasmid pTM1-EBOV NP encoding the EBOV NP gene including the NP 3′ UTR were transfected into 293T cells with and without a TTP expression plasmid. One day posttransfection, total cellular RNA was isolated and luciferase and NP mRNA levels, respectively, were quantified by quantitative reverse transcription polymerase chain reaction (qRT-PCR). When TTP was cotransfected with the pMIR-REPORT-NP 3′ UTR plasmid, we observed a 5-fold decrease in luciferase mRNA levels compared to the sample that lacked the TTP plasmid. Similarly, NP mRNA levels were reduced by about 3-fold in the presence of TTP, suggesting that while the NP mRNA was sensitive to reduction in the presence of TTP, the observed effects were subtle (Supplementary Figure 3).
Next, we examined the effects of TTP on NP protein expression. pCAGGS-EBOV NP expression plasmids containing the ORF of the NP gene with the complete NP 3′ UTR (340 nucleotides), a partial NP 3′ UTR (144 nucleotides), or no 3′ UTR (6 nucleotides) were transfected into 293T cells with or without a TTP expression plasmid. Cells were harvested 2 days posttransfection and examined by western blot analysis for NP protein expression (Figure 4A). Cells transfected with the NP expression plasmid containing no 3′ UTR showed little to no reduction in NP protein expression when cotransfected with TTP compared to cells transfected without TTP. However, NP protein amounts were about 4-fold reduced in cells transfected with the NP expression construct containing the complete 3′ UTR when TTP was coexpressed (Figure 4A and 4C). Cells transfected with the NP expression plasmids containing either the complete 3′ UTR or no 3′ UTR showed little to no difference in NP protein expression when enhanced green fluorescent protein (eGFP) was coexpressed instead of TTP. While the protein expression of NP was also reduced in cells transfected with the NP expression plasmid containing a truncated 3′ UTR in the presence of TTP (Figure 4B and 4C), this reduction was not as pronounced as what was observed when cells were cotransfected with TTP and the NP expression plasmid containing a complete 3′ UTR. The truncated sequence spans the first 144 nucleotides of the NP 3′ UTR and contains 4 potential AREs, including a canonical AUUUA motif (Figure 1). There are additional AREs downstream of the truncated sequence, which might explain the intermediate phenotype we observed for this construct. Collectively, these data suggest that TTP targets the 3′ UTR of NP mRNA, which ultimately leads to a reduction in NP protein expression. It is also conceivable that other cis-acting elements within the NP 3′ UTR impact NP mRNA stability, or other ARE binding proteins may be involved.
TTP negatively impacts NP mRNA and protein expression. A, 293T cells were seeded at 3 × 10⁵ cells per well of a 6-well plate and transfected 1 day later with 200 ng pCAGGS expression plasmids encoding the NP open reading frame with either a full-length 3′ UTR (340 nucleotides) or no 3′ UTR (6 nucleotides), in the absence or presence of 25 ng of expression plasmid pCDNA3.1-myc-TTP. As a control, the pCAGGS-NP expression plasmids were cotransfected with 25 ng of a pCAGGS-eGFP expression plasmid instead of TTP. Cells were harvested 2 days posttransfection and analyzed by western blot using antibodies against Ebola virus NP and lamin B. This blot is representative of 3 independent experiments. B, Cells were transfected as described in (A) with a pCAGGS-NP expression plasmid containing a truncated 3′ UTR (144 nts) in the presence or absence of 25 ng of pCDNA3.1-myc-TTP. This blot is representative of 3 independent experiments. C, Quantification of NP bands in the presence and absence of TTP generated in (A) and (B). Protein bands were quantified using Li-COR Image Studio western blot analysis software. NP amount was normalized to lamin B. NP in the absence of TTP was set to 100%. Shown is the percentage of NP expressed in the presence of TTP compared to NP expressed in the absence of TTP. Statistical analysis was performed using GraphPad prism software, using a 1-sample t test. * P value ≤ .05, ** P value ≤ .01, *** P value ≤ .001. Error bars depict the standard deviation. Abbreviations: eGFP, enhanced green fluorescent protein; NP, nucleoprotein; TTP, tristetraprolin; UTR, untranslated region.
TTP Overexpression Reduces EBOV Minigenome Reporter Activity
To analyze whether TTP overexpression impacts NP function during EBOV transcription and genome replication, we used a minigenome system. This assay is based on coexpression of an EBOV minigenome containing a luciferase reporter gene together with the EBOV proteins required for genome replication and transcription, the so-called support proteins (NP, VP35, VP30, polymerase L). If the minigenome is accepted as a template for transcription and replication by the support proteins, the reporter gene will be expressed [42]. For these experiments, we used the pCAGGS-NP construct containing the full-length NP 3′ UTR. The cells were cotransfected with increasing amounts of expression plasmids encoding either TTP or TTP(C124R), a mutant in which 1 of the 2 zinc finger domains mediating RNA binding is mutated. While the TTP(C124R) mutation greatly reduces TTP's interaction with RNA [43], it does not completely abrogate it [44]. We observed a dose-dependent reduction in minigenome-driven luciferase activity with increasing amounts of TTP. This effect was less pronounced with increasing amounts of TTP(C124R) (Figure 5A). Specifically, we observed an 18-fold reduction in minigenome activity when 1 µg of TTP plasmid was added compared to an 8-fold reduction with 1 µg of TTP(C124R). We used western blot data (Figure 5B) to quantify the TTP and TTP(C124R) protein amounts for the 1-µg transfections. The expression rates of TTP and TTP(C124R) were similar, as indicated by the TTP to tubulin ratio of 21.2 compared to the TTP(C124R) to tubulin ratio of 22.5. The reduction in minigenome activity observed with high amounts of TTP plasmid correlated with decreasing amounts of EBOV NP (Figure 5B and 5C). In contrast, the addition of TTP(C124R) plasmid did not affect NP expression (Figure 5B and 5C), which was an unexpected result given the reduction in minigenome activity compared to the minus-TTP control (Figure 5A and 5C). However, because TTP(C124R) has residual RNA binding activity, it is conceivable that it binds to mRNA targets we have not tested here but are nevertheless important for minigenome functionality. Taken together, our data show that overexpression of TTP strongly impairs EBOV minigenome activity. While this inhibition correlates with a reduction in NP expression, other viral or cellular factors essential for EBOV genome replication and transcription might also be targeted by overexpressed TTP.
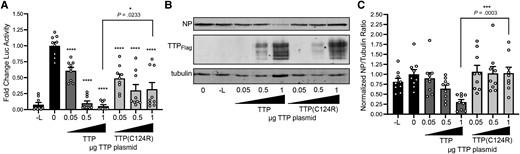
TTP negatively impacts EBOV minigenome activity. A, 293T cells were seeded in 12-well plates at a density of 1.5 × 10⁵ cells per well and transfected 1 day later with EBOV minigenome plasmid 3E5E-Fluc, pCAGGS plasmids encoding EBOV NP with a full-length 3′ UTR, VP35, VP30, and L along with pCAGGS expressing T7 RNA polymerase and pMIR β-gal. pCDNA3.1-1xFlag-TTP or pCDNA3.1-1xFlag-TTP(C124R) were cotransfected in increasing quantities, as indicated. Three days posttransfection, cells were lysed and luciferase and β-gal activity was determined. Luciferase values were normalized to β-gal activity, and the normalized luciferase values for the positive control (0 = + L, no TTP plasmids) were set to one. As a negative control, the L plasmid was replaced by a plasmid encoding a fluorescent protein (− L). Data are from 3 independent experiments (each performed in triplicate). Statistical analysis was performed using GraphPad prism software, using a 1-sample t test. B, Cell lysates prepared in (A) were analyzed by western blot using antibodies against EBOV NP, FLAG, and tubulin. The shown blot is representative of 3 independent experiments (each performed in triplicate). C, Quantification of NP bands in the presence and absence of TTP or TTP(C124R) generated in (B). Protein bands were quantified using Li-COR Image Studio western blot analysis software. Shown is the NP to tubulin ratio. NP amount of the positive control (0 = + L, no TTP plasmids) was set to 1. Statistical analysis was performed using GraphPad prism software, using a 1-sample t test. * P value ≤ .05, ** P value ≤ .01, *** P value ≤ .001, **** P value ≤ .0001. Error bars depict the standard error of the mean. Abbreviations: β-gal, β-galactosidase; EBOV, Ebola virus; NP, nucleoprotein; TTP, tristetraprolin; UTR, untranslated region.
DISCUSSION
In summary, we have shown that the AU-rich 3′ UTRs of EBOV mRNAs might be subject to regulation by cellular ARE-BPs. In our assays, we observed the most pronounced effects for the 3′ UTR of the NP mRNA in both increasing reporter gene activity (Figure 2) and showing responsiveness to TTP (Figure 3B). In contrast to the other tested EBOV 3′ UTRs, the NP 3′ UTR contains 3 canonical AREs (Figure 1), which might explain why this region is prone to interaction with ARE-BPs including TTP. This does not exclude that the other EBOV 3′ UTRs might be targeted by other ARE-BPs. It should be noted that TTP and HuR were used as well-studied, prototypic ARE-BPs in our assay to explore if the AU-rich EBOV 3′ UTRs can be targeted by ARE-BPs. More work needs to be done to determine whether the EBOV NP mRNA is an authentic TTP target. Similar to many other ARE-BPs, HuR and TTP are key regulators of the type I interferon and nuclear factor-κB (NFκB)-induced temporal expression of cytokines and chemokines during an inflammatory response, and are upregulated in immune cells such as monocytes and macrophages upon activation [3, 9–12]. Macrophages are also primary target cells of EBOV infection and thought to be the major drivers of the elevated inflammatory response observed in EBOV infection [45, 46]. Therefore, it would be interesting to examine the posttranscriptional regulation of EBOV mRNAs in the context of an inflammatory environment when crucial ARE-BPs are upregulated. Furthermore, as NP plays a critical role in the EBOV life cycle, the ability of TTP or potentially other ARE-BPs to target NP for degradation may disrupt several essential viral processes. Among many functions, NP encapsidates the viral genome, is critical for formation of viral inclusion bodies, and associates with other viral proteins to promote replication and transcription [47]. We have previously shown that multiple ARE-BPs form distinct aggregates within EBOV inclusions, which suggests that there might be a complex interplay between viral mRNAs and cellular ARE-BPs that affects multiple key points in the EBOV life cycle [31]. Further studies need to be done to better understand the role of ARE-BPs in EBOV infection.
With exception of the minigenome system, the observed effects mediated by the EBOV 3′ UTRs were subtle across the performed assays (2- to 7-fold). This is in line with the function of ARE-BPs to fine-tune mRNA abundance in response to cell stress such as acute or chronic inflammation, or cancer [3, 7–12, 16, 32, 34]. However, it is also conceivable that in our test systems, the EBOV 3′ UTRs are not authentic targets of the naturally expressed or overexpressed ARE-BPs, which might explain the moderate observed effects. Future work will include RNA-protein binding assays to gain comprehensive insight into the RBP landscape in EBOV infection.
Limitations of our assays include constitutive mRNA synthesis in the mammalian reporter assay that could conceal subtle posttranscriptional regulatory events, specifically destabilization of mRNA. We therefore included the zebrafish embryo injection model in our studies that allowed us to study posttranscriptional regulation independently of mRNA synthesis. Indeed, the expected mRNA destabilization attributed to the IL-6 3′ UTRs was clearly observed in the fish embryo system, whereas it was not observed in the mammalian transfection assay. This shows that the fish embryo injection system is not only an innovative technique for studying embryonic development but can also be used to study posttranscriptional regulation of viral mRNAs, which we aim to pursue in future studies.
Supplementary Data
Supplementary materials are available at The Journal of Infectious Diseases online. Consisting of data provided by the authors to benefit the reader, the posted materials are not copyedited and are the sole responsibility of the authors, so questions or comments should be addressed to the corresponding author.
Notes
Author contributions. E. V. N., S. J. R., D. C., and E. M. designed the experiments. E. V. N., S. J. R., J. O., A. J. H., and D. C. performed the experiments and analyzed the data. E. K. , A. O. G., S. M. L., and D. J. D. designed, cloned, and prepared plasmids. E. V. N. wrote the first draft of the manuscript. E. M., E. V. N., S. J. R., and J. O. edited the manuscript. E. V. N., S. J. R., D. C., J. O., and E. M. generated the figures.
Acknowledgments. The authors thank Rahm Gummuluru, Heinz Feldmann, Gene Olinger, Matt Jones, and Nancy Kedersha for providing material including cells, antibodies, viral RNA, and plasmid DNA; and Dmitry Kretov and Imrat for their assistance with zebrafish embryo preparation. This paper includes results of the doctoral thesis submitted by E. V. N. to the Boston University Chobanian and Avedisian School of Medicine in 2016.
Financial support. This work was supported by the National Institute of Allergy and Infectious Diseases of the National Institutes of Health (grant numbers R01AI133486 to E. M., R01GM130935 to D. C., and R35GM146769 to S. M. L.); and the Howard Hughes Medical Institute Emerging Pathogens Initiative (to D. C. and E. M.).
Supplement sponsorship. This article appears as part of the supplement “10th International Symposium on Filoviruses.”
References
Author notes
Presented in part: 6th International Filovirus Symposium, Galveston, TX, USA, 30 March 2 April 2014; International Graduate Student Conference in Immunology Marseille, France, 29–31 August 2013.
E. V. N. and S. J. R. contributed equally to the study.
Potential conflicts of interest. All authors: No reported conflicts of interest. All authors have submitted the ICMJE forms for disclosure of potential conflicts of interest. Conflicts that the editors consider relevant to the content of the manuscript have been disclosed.

