


Abstract
Testing and contact tracing (CT) can interrupt transmission chains of SARS-CoV-2. Whole-genome sequencing (WGS) can potentially strengthen these investigations and provide insights on transmission.
We included all laboratory-confirmed COVID-19 cases diagnosed between 4 June and 26 July 2021, in a Swiss canton. We defined CT clusters based on epidemiological links reported in the CT data and genomic clusters as sequences with no single-nucleotide polymorphism (SNP) differences between any 2 pairs of sequences being compared. We assessed the agreement between CT clusters and genomic clusters.
Of 359 COVID-19 cases, 213 were sequenced. Overall, agreement between CT and genomic clusters was low (Cohen's κ = 0.13). Of 24 CT clusters with ≥2 sequenced samples, 9 (37.5%) were also linked based on genomic sequencing but in 4 of these, WGS found additional cases in other CT clusters. Household was most often reported source of infection (n = 101 [28.1%]) and home addresses coincided well with CT clusters: In 44 of 54 CT clusters containing ≥2 cases (81.5%), all cases in the cluster had the same reported home address. However, only a quarter of household transmission was confirmed by WGS (6 of 26 genomic clusters [23.1%]). A sensitivity analysis using ≤1-SNP differences to define genomic clusters resulted in similar results.
WGS data supplemented epidemiological CT data, supported the detection of potential additional clusters missed by CT, and identified misclassified transmissions and sources of infection. Household transmission was overestimated by CT.
Introduction
Severe acute respiratory syndrome coronavirus 2 (SARS-CoV-2) is a highly contagious respiratory virus, the causative agent of the coronavirus disease 2019 (COVID-19) pandemic, and a global public health threat. As of July 2021, there have been >560 million confirmed SARS-CoV-2 infections globally and 6.4 million deaths have been attributed to COVID-19 [1]. In Switzerland, almost 4 million COVID-19 cases have been confirmed and about 14 000 people have died from COVID-19 [2]. In the absence of effective and safe vaccines until the end of 2020, the pandemic could be fought using only nonpharmaceutical interventions (e.g., ban of events and gatherings, wearing masks, social distancing), extensive testing of symptomatic and asymptomatic persons, and consistent contact tracing (CT) to isolate and quarantine cases and contacts, respectively, and to identify and interrupt transmission chains.
The advancements of high-throughput sequencing technologies and their widespread accessibility have enabled the monitoring of SARS-CoV-2 mutations and variants [3, 4]. By comparing SARS-CoV-2 whole-genome sequences, mutations can be identified and used to provide high-resolution insights that are not captured by CT-based epidemiological investigations [5], such as transmission dynamics and viral evolution, possibly even in real-time [6–8], and can be further used to evaluate the effectiveness of implemented public health interventions [9]. Genomic data and phylogenetic analysis have been used to investigate the impact of superspreading events [10], monitoring the introduction and spread of new cases and variants by returning travelers [11–13] and transmission chains in high-incidence settings [14]. However, the implementation of routine genomic surveillance is logistically challenging, requiring a comprehensive sequencing infrastructure and coherent integration with the CT system [8], and it is unknown how well routine CT using epidemiological links between cases performs compared with genomic analyses. In this study we compared population-based CT and viral whole-genome sequencing (WGS) data from patients with COVID-19 in a Swiss canton during a 7-week period, just before the start of the fourth epidemic wave and the nationwide spread of the Delta variant.
METHODS
Study Design, Patient Data and Samples
All laboratory-confirmed COVID-19 cases (antigen or polymerase chain reaction [PCR] positive) diagnosed between 4 June and 26 July 2021 in the canton of Solothurn (approximately 280 000 inhabitants) were included for CT and for analysis in this study. CT measures, including data collection and isolation/quarantine requirements, were based on the Epidemics Act law and in line with the recommendations by the Federal Office of Public Health: persons testing positive were routinely contacted by the CT team (Cantonal Physician's Office) for structured, in-depth telephone interviews shortly after diagnosis and during follow-up until the end of isolation on the 10th day. Collected data included sociodemographic information, place of residence, workplace or school, symptoms, potential source of infection (self-reported), activities, visited places, and people in close contact before the positive test result. The latter were themselves contacted by the CT team to impose a quarantine of 10 days and—if they did test positive at some later stage—for the in-depth telephone interviews and identification of further close contacts. CT was supported by a partially automated workflow to ensure that accurate and complete data on all positively tested persons and links to their contacts were entered in the electronic cantonal CT database.
Per order of the Cantonal Physician's Office, WGS was done for all persons with positive PCR results for SARS-CoV-2. All persons testing positive with rapid antigen tests were recommended to provide an additional sample for PCR testing and genome sequencing. WGS was performed at laboratories participating in the National Genomics Surveillance Project [5], according to published protocols described in detail elsewhere [5, 15]. Sequences were stored at the international Global Initiative on Sharing Avian Influenza Data (GISAID; https://www.gisaid.org/) [16].
Definitions
Cases were defined as persons tested SARS-CoV-2 PCR positive by rapid-antigen or PCR test. Contacts of a case were defined as people in close contact with the case (<1.5 m for >15 minutes) without adequate protection, such as wearing a face mask, in the last 48 hours before symptom onset or diagnosis if asymptomatic, as recommended by the Federal Office of Public Health [2]. Contacts who tested SARS-CoV-2 positive during their quarantine time were defined as secondary cases. Cases not reported as a contact of another case at the time of the positive test were defined as initial cases.
We differentiated between CT clusters (and networks) and genomic clusters: CT clusters and networks were based on established links between cases and contacts through the CT data. Networks included cases and all contacts, regardless of whether or not a contact became a secondary case, while CT clusters included only initial and secondary cases. Genomic clusters were defined as SARS-CoV-2 genome sequences with no single-nucleotide polymorphism (SNP) differences between any 2 pairs of sequences being compared. To evaluate clustering concordance between CT and WGS, we also assessed the effects of defining genomic clusters based on 1–5 SNP differences between any 2 pairs of sequences.
Analyses
SARS-CoV-2 genome sequences were analyzed using Pangolin (version 3.1.2) to infer the lineage of each sequence. Multiple sequence alignments were generated with multiple alignment program for amino acid or nucleotide sequences (MAFFT) and subjected to maximum-likelihood phylogenetic reconstruction using IQ-TREE 2 software [5, 17]. A distance matrix was generated using the aligned reads based on the number of nucleotide differences and the resulting distance matrix was used to generate a minimum spanning tree [18]. The displayed minimum spanning tree graph was preprocessed with igraph software (version 1.2.10) and generated using ggnetworks software (version 0.5.10) (https://github.com/briatte/ggnetwork).
We used descriptive statistics to report baseline data for cases and contacts. We investigated the trends in the proportion of cases with available sequences, the contribution of different SARS-CoV-2 variants, and sizes of CT networks and clusters over time. We estimated the serial interval for COVID-19 using CT clusters, by extracting all pairs of initial and secondary cases and used the mean time between their positive test results as a proxy for the serial interval. Within genomic clusters, all cases were linked and there was no obvious initial case since we did not know the specific transmission chain within a genomic cluster. To estimate the serial interval of COVID-19 using genomic clusters, we therefore defined potential sources of infection for a given case as all other cases in the same cluster with test dates no later than the test date for that patient. With this, we estimated a range for the serial interval, based on the average minimum and maximum time differences between test dates for a case and the potential sources of infection.
We examined the agreement between CT and genomic data based on the total number of cases in the CT cluster, the number of sequences available, and sequence identities within the CT clusters. We visually compared CT and genomic clusters and examined to what extent additional information collected during CT (metadata, including place of residence, workplace, school, and self-reported source of infection) corresponded with CT and genomic clusters. In a sensitivity analysis, we checked the change in agreement between CT and genomic data when using a more relaxed definition of a genomic cluster, allowing for a 1-SNP difference between a pair of sequences. In addition, we quantified the agreement between CT and genomic clusters (interrater reliability) for each week of the study period using Cohen's κ statistic [19] with a threshold of 0–5 SNP differences between 2 sequences defining a genomic cluster. All analyses were done using the software packages Stata (version 16.1) and R (version 4.1.3).
Data Availability
The genome assembly sequences were deposited to the European Nucleotide Archive, and project and sample accession numbers are listed in Supplementary Table 1.
Ethics Statement
The Ethics Committee of Northwestern and Central Switzerland approved this study (EKNZ; reference no. 2021-02240).
RESULTS
Over the course of the study period (6 June to 29 July 2021), 359 SARS-CoV-2 cases and 460 contacts were recorded in the canton of Solothurn (Table 1). Most cases—289 (80.5%)—were initial cases, while 70 (19.5%) were secondary cases. Of all cases, 213 (59.3%) had WGS data available, with a lower proportion of sequenced cases at the beginning and end of the study period (Table 1 and Figure 1A). Sex and age distributions were similar across cases and contacts and among sequenced and nonsequenced cases (Table 1). Most cases who were contacted reported their household as the most likely source of infection (28.1%), followed by travel (15.6%) and work (11.7%) (Table 1). The study period captured the spread of the Delta variant with the Delta variant dominating from the end of July onward (Figure 1B).
![Severe acute respiratory syndrome coronavirus 2 (SARS-CoV-2) pandemic in the canton of Solothurn, Switzerland, between 4 June and 26 July 2022. A, Weekly number of coronavirus disease 2019 (COVID-19) cases reported to the public health authorities and the proportions of samples with available sequences. B, SARS-CoV-2 variant composition among samples with available sequences. C, Mean weekly size (95% confidence interval [CI]) of case-contact networks (cases with their secondary cases or contacts). D, Mean weekly size (95% CI) of contact tracing (CT) clusters (primary and secondary cases). Red numbers indicate the number of networks/clusters used to estimate the weekly mean; dashed lines, overall means for the whole study period.](https://oup.silverchair-cdn.com/oup/backfile/Content_public/Journal/jid/228/3/10.1093_infdis_jiad074/1/m_jiad074f1.jpeg?Expires=1750037550&Signature=4s5QEss6O9VJY6~pIem0hs3aLEy6V9xJjTuFTHNWWGl~fRLITbIZuGBekfXYR1~N5lHmeFxQFlN6~E0BexcvEWylvBZMAopwt~INIwqKL7k0RbVEY2Vg4btrDN9NoGN-YogpKyyN3RPZyvF3J8Wk94aGlZ~oeB~g7rWTllYtSUZbE2ZX~Woqe27eujqV9dpbx7wcmmgBAUuFvGHqmJ108J0qwbYyj2IaXt3aB3PPgcouZl6fpqgIqWbWfIuW3qpaBf8rLzH3F6QlurzWGOX3wQaehVxKqbTkaZH6HXc5HDAVBK1siRYqrZpK5wrc9PW1Q8XzC1BxU1wtB6cYU5z2fw__&Key-Pair-Id=APKAIE5G5CRDK6RD3PGA)
Severe acute respiratory syndrome coronavirus 2 (SARS-CoV-2) pandemic in the canton of Solothurn, Switzerland, between 4 June and 26 July 2022. A, Weekly number of coronavirus disease 2019 (COVID-19) cases reported to the public health authorities and the proportions of samples with available sequences. B, SARS-CoV-2 variant composition among samples with available sequences. C, Mean weekly size (95% confidence interval [CI]) of case-contact networks (cases with their secondary cases or contacts). D, Mean weekly size (95% CI) of contact tracing (CT) clusters (primary and secondary cases). Red numbers indicate the number of networks/clusters used to estimate the weekly mean; dashed lines, overall means for the whole study period.
Characteristics of Cases and Contacts Included in Analysis
| Characteristic | Cases, No. (%)a | Contacts, No. (%)a | ||
|---|---|---|---|---|
| Overall | Sequenced | Not Sequenced | ||
| Total | 359 (100) | 213 (100) | 146 (100) | 460 (100) |
| Initial cases | 289 (80.5) | 176 (82.6) | 113 (77.4) | … |
| Secondary cases | 70 (19.5) | 37 (17.4) | 33 (22.6) | … |
| Sex | ||||
| Female | 164 (45.7) | 95 (44.6) | 69 (47.3) | 224 (48.7) |
| Male | 189 (52.6) | 115 (54.0) | 74 (50.7) | 226 (49.1) |
| Other | 6 (1.7) | 3 (1.4) | 3 (2.1) | 10 (2.2) |
| Age, median (IQR), years | 31 (21–46) | 31 (21–44) | 33 (21–48) | 29 (15–49) |
| Exposure | ||||
| Household | 101 (28.1) | 61 (28.6) | 40 (27.4) | … |
| Travel | 56 (15.6) | 40 (18.8) | 16 (11.0) | … |
| Work | 70 (19.5) | 27 (12.7) | 15 (10.3) | … |
| Store/public Transport | 35 (9.7) | 14 (6.6) | 21 (14.4) | … |
| Restaurant/bar/club | 22 (6.1) | 17 (8.0) | 5 (3.4) | … |
| School/nursery | 18 (5.0) | 10 (4.7) | 8 (5.5) | … |
| Healthcare | 12 (3.3) | 7 (3.3) | 5 (3.4) | … |
| Event | 9 (2.5) | 5 (2.3) | 4 (2.7) | … |
| Other/unknown | 64 (17.8) | 32 (15.0) | 32 (21.9) | … |
| Vaccinated | 55 (15.3) | 41 (19.2) | 14 (9.6) | … |
Data represent no. (%) of cases or contacts unless otherwise specified. IQR: interquartile range
CT Clusters
Overall, the data from CT identified 289 different CT networks and clusters. Both CT network and CT cluster sizes did not change substantially over time, although there was a slight decrease in the weekly average network size toward the end of the study (Figure 1C and 1D). The mean CT network size was 2.83 (range, 1–20), and the mean CT cluster size, 1.24 (1–5). Based on CT linkages, 112 of 289 CT networks (38.8%) consisted of an initial case with no reported contact (network size, 1 case), while 58 of 289 CT networks (20%) consisted of a single case and a single contact (network size, 2; Supplementary Figure 1). Based on 70 links between initial and secondary cases from CT clusters, we estimated an average serial interval of 4.4 days (95% confidence interval [CI], 3.7–5.0 days). If we restricted the 70 CT links to those confirmed by genomic sequencing, the estimate of the serial interval was similar, with an average of 4.8 days (95% CI, 2.9–6.6 days).
Genomic Clusters
Alpha and Delta variants clearly separated into clades on the minimum spanning tree (Figure 2). In total, 160 genomic clusters were obtained using no SNP differences as the threshold to define clusters. Of these, 133 (83.2%) were singleton genomic clusters, and 27 (16.9%) included >1 case (Supplementary Table 2). Based on 53 links within genomic clusters, we estimated an average minimum serial interval of 2.5 days (95% CI 1.7–3.2 days) and an average maximum serial interval of 5.1 days (3.9–6.3 days). Most genomic clusters occurred within a short time frame, but the largest genomic cluster (8 cases) spanned 19 days.
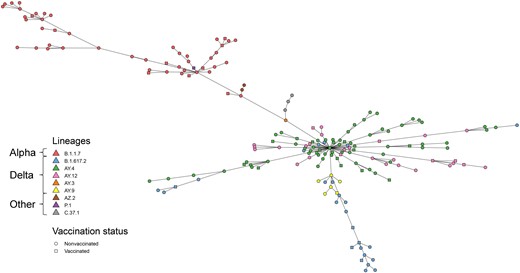
Minimum spanning tree of genomic differences among severe acute respiratory syndrome coronavirus 2 sequences. Pangolin lineages and vaccination status are indicated by different colors and shapes, respectively.
Comparing CT and Genomic Clusters
Of 289 CT clusters, 106 (36.7%) had no cases with available SARS-CoV-2 sequences available, 25 (8.7%) were partially sequenced, containing ≥1 case with an available SARS-CoV-2 sequence, and 158 (54.7%) were fully sequenced. However, many of the fully sequenced clusters were single-case CT clusters (Table 2 and Supplementary Figure 2). Of 24 CT clusters that had >1 case and contained ≥2 sequenced samples, 9 (37.5%) were also linked based on genomic sequencing (“correct” CT linkage), whereas 15 CT clusters contained different sequences (“incorrect” CT linkage). For 4 of the 9 correct CT clusters, the same sequence was found outside the CT cluster (“incomplete” CT linkage), and for the remaining 5 correct CT clusters the sequence was not found outside the CT cluster (“complete” CT linkage; Table 2 and Figures 3 and 4 and Supplementary Figure 2). Of 159 CT clusters with only 1 sequence available, 107 (67%) were complete, the sequence not being identified elsewhere (Figure 3).
![Agreement between contact tracing (CT) linkage and genomic sequencing. Dots on the left represent CT clusters with ≥1 sequence available, and stars indicate singleton clusters. Dots on the right represent the different genomic clusters (ie, unique sequences). A line connects a CT cluster to a genomic cluster if the sequence was found within the CT cluster. For CT clusters with >1 sequence available within a cluster, linkage could be correct and complete (all sequences were the same and the sequence was not found outside the cluster [green]), correct and incomplete (all sequences were the same but the sequence was found outside the cluster [blue]), or incorrect (the sequences were different [red]). If only 1 sequence was available in a cluster, the cluster could either be complete (unique sequence that was not found elsewhere [orange]) or incomplete (other cases with the same sequence existed but the links were missed [gray]).](https://oup.silverchair-cdn.com/oup/backfile/Content_public/Journal/jid/228/3/10.1093_infdis_jiad074/1/m_jiad074f3.jpeg?Expires=1750037550&Signature=0I2NEl-N2hJV0gbMRa52bhb9b-apwafw3Hhs5-VH7ZMVEs~z3VXFXchmhqSyXFKmOl7yOIDYGWryRWAnphrzUa6l08zdB7WOx9pGr62W15sNKWnVF4YEnhMobLBnoIDM0OmxtLImf8ZHedWpnSsPsp1M8Jsf4YxdzZuwGeKKe905AnjV2LHfEy8EIW2RB-CDjATj2PMAzihhM5NvNGmMMXvbA1CoHGidFRTgPKJ7qEW7O~upNUgn8KjjMANUmYJhAjZt92WD7tIlUKXiohto38KgsmDMGIZd79E0a~lIZagxOkqWnwiT1eViVzph6oRea0Q0Ug2W3K8ur~csqx2S9w__&Key-Pair-Id=APKAIE5G5CRDK6RD3PGA)
Agreement between contact tracing (CT) linkage and genomic sequencing. Dots on the left represent CT clusters with ≥1 sequence available, and stars indicate singleton clusters. Dots on the right represent the different genomic clusters (ie, unique sequences). A line connects a CT cluster to a genomic cluster if the sequence was found within the CT cluster. For CT clusters with >1 sequence available within a cluster, linkage could be correct and complete (all sequences were the same and the sequence was not found outside the cluster [green]), correct and incomplete (all sequences were the same but the sequence was found outside the cluster [blue]), or incorrect (the sequences were different [red]). If only 1 sequence was available in a cluster, the cluster could either be complete (unique sequence that was not found elsewhere [orange]) or incomplete (other cases with the same sequence existed but the links were missed [gray]).
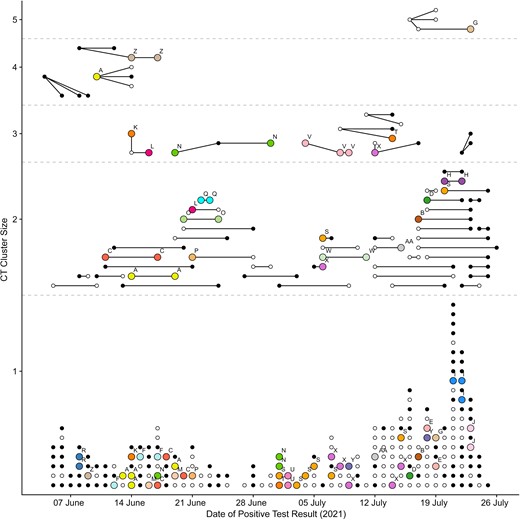
Comparison of contact tracing (CT) and genomic clusters. Dots represent individual cases, and lines represent links between initial and secondary cases reported to the CT team. The resulting CT clusters (dots connected by lines) are shown by size and date of positive test. Colors (and letters above cases) correspond to cases matched by sequencing (same genomic cluster). White dots are cases belonging to a single-case genomic cluster (a unique sequence not found for any other case); black dots, cases for which no sequencing was available.
Comparison of Contact Tracing Clusters to Genomic Clusters
| CT Cluster Size (Total No. of Cases) | No. of Cases Per Cluster With Available Sequencing | No. of Distinct Sequences in Single CT Cluster | |||
|---|---|---|---|---|---|
| 1 | 2 | 3 | 5 | ||
| 1 | 1 | 140 | … | … | … |
| 2 | 1 | 19 | … | … | … |
| 2 | 2 | 6a | 9b | … | … |
| 3 | 2 | 1a | 3b | … | … |
| 3 | 3 | 1a | 0 | 1b | … |
| 4 | 2 | 1a | 0 | … | … |
| 4 | 3 | 0 | 0 | 1b | … |
| 5 | 5 | 0 | 0 | 0 | 1b |
Abbreviation: CT, contact tracing.
A match, in which all cases in a CT cluster were also linked by genomic sequencing.
A “mismatch,” in which the cases in a unique CT cluster belonged to different genomic clusters.
When we relaxed our definition of a genomic cluster, allowing for up to 1 SNP difference between any 2 pairs of sequences, the number of genomic clusters decreased from 160 to 135. The more relaxed threshold led to slightly fewer incorrect CT linkages (11 instead of 15 CT clusters) and conversely slightly more correct CT linkages (13 instead of 9). However, it also led to a much larger proportion (>50%) of CT clusters being incomplete (Supplementary Figure 3). This trade-off was reflected in Cohen's κ statistic, which showed that the agreement between the CT and genomic clusters throughout was low for all SNP thresholds (average, 0.13–0.10) with high uncertainty (Supplementary Figure 4).
Comparing CT and Genomic Clusters Based on Reported Household, Workplace, and Other Potential Sources of Infection
When we compared clusters with the additional meta-data collected during CT, place of residence (both complete home address and zip code) showed poor agreement for genomic clustering but better agreement for CT clustering, and persons with the same home address were more commonly found in CT clusters than in genomic clusters (Figure 5 and Supplementary Figures 5 and 6); of 54 CT clusters with ≥2 cases, only 5 (9.3%) did not include cases with the same home address. The remaining 49 CT clusters (90.7%) included ≥2 cases with the same home address, with 44 (81.5%) being single-home-address clusters. However, looking at the genomic data of the 44 single-home-address CT clusters, we found that 10 of 15 CT clusters (66.7%) with >1 sequence available were misevaluated according to genomic data (the sequences within single-home-address CT cluster were different) and only 5 (33.3%) were confirmed by genomic data. Looking at genomic clusters with ≥2 cases, most did not include any cases with the same home address (15 of 26 clusters [57.7%]). The remaining 11 clusters (42.3%) included ≥2 cases with the same home address, but only 6 (23.1%) were single-home-address clusters, and persons with the same home addresses were often present in multiple different genomic clusters (Figure 5). Using the ≤1-SNP threshold to define genomic clusters, 8 (25%) of 32 were single-home-address clusters. In the 4 largest CT clusters, 76.5% of all cases (13 of 17) and 92.3% of secondary cases (12 of 13) reported their household as the most likely source of infection. However, the most likely source of infection in genomic clusters was more varied: in only 1 of the 3 largest genomic clusters, most cases reported the same location—namely, school—as the most likely source of infection (Supplementary Figure 7). For the other 2 clusters, an average of 4.5 different exposures were reported.
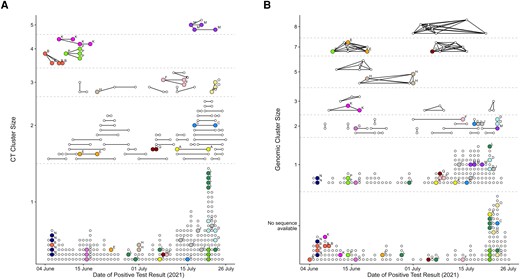
Comparison of contact tracing (CT) (A) and genomic (B) clusters for persons in the same household (defined by the same home address). A, CT clusters with cases (dots) connected by lines if a link was reported to the CT team. B, Genomic clusters with cases (dots) connected by lines if they shared the same genomic sequence (0 SNP difference). Colors (and letters above cases) show which cases have the same reported home address (street name and number). For better visibility, only home addresses that were reported for ≥3 cases are shown. In addition, in 55 cases the same home address was reported for exactly 2 cases (Supplementary Figure 6).
Workplace and school showed poor agreement with both CT and genomic clustering (Supplementary Figures 5 and 8). Of 31 CT clusters including ≥2 cases with a reported work address, most (26 clusters [83.9%]) were distinct-workplace clusters, in which all cases reported a different work address, and only 5 clusters (16.1%) included cases with the same workplace. For genomic clusters these numbers were similar, with 14 of 16 distinct-workplace clusters (87.5%) and only 2 clusters (12.5%) including cases with the same work address. We observed similar results for schools (Supplementary Figure 8).
DISCUSSION
Comparing CT and sequencing data from patients with COVID-19 shows an overall low agreement and that WGS can provide additional links between cases that CT did not necessarily capture. The potential source of infection is difficult to identify based on CT data, and household transmissions are less supported in genomic clusters. Including data from cases in the entire canton of Solothurn, spanning a 7-week period before the start of the fourth epidemic wave, provided a comprehensive picture of the epidemiological situation in the general population of the canton of Solothurn and extended our analysis beyond an outbreak investigation in a limited setting. By comparing CT data with population-based sequencing data, we expanded our analysis beyond self-reported contacts to more objective WGS data.
Routine CT relies on complete and correct recall of contact events by cases, the correctness of information given by the interviewed person, and the willingness of the population to cooperate with the CT team during the interviews [20–22]. In our study specifically, additional CT information, such as workplace or school address, was not disclosed for many cases. The limitations of routine CT might be particularly true in the context of highly transmissible infectious disease such as SARS-CoV-2 and during a pandemic with strict measures with substantial economic and social consequences [23]. We were also limited to cases within the canton of Solothurn and might have missed cases in clusters if the transmission chain included people living outside Solothurn. This is likely in Switzerland, where it is common for people to work in a canton different from the one they live in or to visit friends and relatives living in another canton.
The limitations of WGS sequencing in this study include the facts that the analysis of sequencing information was done retrospectively and the sequencing of cases was incomplete. Some clinical specimens were no longer available, or sequencing was technically not possible owing to too low viral loads, with the consequence that many CT clusters were not fully sequenced. This resulted in a relatively small number of cases, highlighting the need for large databases to overcome the technical and logistical challenges of WGS to target a higher proportion of sequenced results and achieve larger overlapping data sets.
In addition to the limitations of CT and WGS, the introduction of a new Delta SARS-CoV-2 variant, with changed characteristics [24] such as increased transmissibility, may also have affected the agreement between CT and genomic data. However, the average size of case-contact networks and CT clusters did not change substantially during the study period, and we did not find higher agreement between CT and genomic clusters at the beginning of our study, when the Alpha variant dominated. Because we did not see substantial changes, we used the time between positive test results as a proxy to estimate the serial interval of COVID-19 transmissions across the study period, and while the time between positive results based on CT data may not have been true transmission chains, the estimated serial interval based on genomic clusters was similar to that based on CT clusters. These estimates also matched the serial interval of COVID-19 determined in current literature, which is 4–8 days [25].
In our data almost a third of CT clusters were incomplete, with identical sequences found across multiple CT clusters. These potentially missed links by CT would need to be further investigated to be confirmed. WGS data for COVID-19 cases in a hospital outbreak in Portugal [6] showed that transmission events were mostly driven through healthcare workers rather than between patients within the same room. Similar studies used WGS data to confirm or dispute presumed transmissions and investigate sources of infections in hospital outbreaks and even the local population [7, 8, 26, 27]. Multiple efforts have showed the added value of real-time or near-real-time genomic sequencing of SARS-CoV-2 in investigating community outbreaks, identifying transmission chains, and clarifying probable sources of infection, albeit requiring a comprehensive sequencing infrastructure and coherent integration with the CT system [10, 13, 14, 28, 29].
There was poor agreement when matching additionally collected information, such as home addresses or self-reported sources of infection, with observed genomic clusters and large CT clusters more likely to correspond with patient self-reported sources of infection than large genomic clusters. These will be biased toward households and workplaces, where people spend more time and are more likely to know of a COVID-19 case than in public places, such as restaurants or hospitals. However, households and workplaces do not necessarily reflect exposures with the highest transmission risk. A meta-analysis of SARS-CoV-2 household transmissions estimated the household secondary attack rate as 19% [30]. In our data, genomic sequencing showed that cases from the same households were often distributed among several genomic clusters, indicating that infections may have occurred elsewhere. This is similar to what has been seen in investigations of tuberculosis transmissions, an infection similarly transmitted through aerosols and for which household transmissions have a smaller contribution to the overall population transmission, even in settings highly endemic for tuberculosis [31–33].
Overall, the overestimation of household transmissions by CT data alone requires further investigation as this could influence future CT procedures, which focus more on identifying multiple sources of infection rather than quarantine of household members. Despite low to moderate agreement between CT and genomic clusters in our data, at a population level, CT is an effective public health measure [21, 34, 35], especially when combined with isolation and physical distancing measures [36]. Effective CT does entail a high logistic burden, particularly as case numbers increase [21]. Here surveillance-based sequencing can be invaluable in better understanding and explaining transmissions clusters and, beyond that, offers additional potential in identifying outbreaks more rapidly and can guide efficient viral containment strategies and prospective preventive measures [6–8, 28, 29] when implemented in real time.
Supplementary Data
Supplementary materials are available at The Journal of Infectious Diseases online. Consisting of data provided by the authors to benefit the reader, the posted materials are not copyedited and are the sole responsibility of the authors, so questions or comments should be addressed to the corresponding author.
Notes
Acknowledgments. We thank all persons who contributed data to this study. We are indebted to the contact tracing team of the canton of Solothurn, Switzerland, for their diligent daily work. We also thank the diagnostic laboratories in Switzerland for analyzing the genomes.
Author contributions. Conception and design: C. M. and L. F. Contact tracing data collection: C. M., B. K. D., and L. F. Genomic data collection: L. B., C. M., B. K. D., A. R., and L. F. Statistical analysis: N. A., T. S., L. B., and A. R. Genomic analysis: L. B. and A. R. Writing of first manuscript draft: N. A., T. S., A. R., and L. F. Revision of manuscript based on comments from all authors: N. A., T. S., L. B., B. K. D., A. R., and L. F. All authors reviewed and approved the final version of the manuscript.
Financial support. This work was supported by the Institute of Social and Preventive Medicine (ISPM) and the Institute of Infectious Diseases (IFIK) of the University of Bern. TS and LF are supported by the National Institute of Allergy and Infectious Diseases (NIAID) through grant no. 5U01-AI069924-05. NA was supported by funding from the Swiss National Science Foundation (grant no. P500PM_203010).
References
Author notes
N. A. and T. S. contributed equally to this work.
A. R. and L. F. contributed equally to this work.
Potential conflicts of interest. All authors: No reported conflicts. All authors have submitted the ICMJE Form for Disclosure of Potential Conflicts of Interest. Conflicts that the editors consider relevant to the content of the manuscript have been disclosed.

