


Abstract
This prospective study assesses symptoms 3 months after severe acute respiratory syndrome coronavirus 2 (SARS-CoV-2) infection compared to test-negative and population controls, and the effect of vaccination prior to infection.
Participants enrolled after a positive (cases) or negative (test-negative controls) SARS-CoV-2 test, or after invitation from the general population (population controls). After 3 months, participants indicated presence of 41 symptoms and severity of 4 symptoms. Permutation tests were used to select symptoms significantly elevated in cases compared to controls and to compare symptoms between cases that were vaccinated or unvaccinated prior to infection.
In total, 9166 cases, 1698 symptomatic but test-negative controls, and 3708 population controls enrolled. At 3 months, 13 symptoms, and severity of fatigue, cognitive impairment, and dyspnea were significantly elevated incases compared to controls. Of cases, 48.5% reported ≥1 significantly elevated symptom compared to 29.8% of test-negative controls and 26.0% of population controls. Effect of vaccination could be determined for cases aged <65 years, and was significantly protective for loss of smell and taste but not for other symptoms.
Three months after SARS-CoV-2 infection, almost half of cases report symptoms, which was higher than background prevalence and test-negative prevalence. Vaccination prior to infection was protective against loss of smell and taste in cases aged <65 years.
INTRODUCTION
A subgroup of coronavirus disease 2019 (COVID-19) survivors report ongoing and debilitating health problems months after mild or severe acute infection [1], which cause an increasing burden to society and health care systems [2]. More information is needed about duration and prevalence and about how COVID-19 vaccination affects these symptoms, here referred to as post–COVID-19 condition (PCC).
Commonly reported ongoing symptoms after COVID-19 include fatigue, shortness of breath, myalgia, and cognitive problems [3], but there is also a wide range of other symptoms involving multiple organ systems [1]. Lack of a uniform case definition has greatly hampered interpreting prevalence estimates of long-term symptoms after COVID-19. Estimates vary largely due to different designs, study populations, and symptoms assessed [4–6] and, so far, few studies on long-term symptoms after COVID-19 include severity using validated cutoff scores [7]. Vaccination for severe acute respiratory syndrome coronavirus 2 (SARS-CoV-2) prior to infection positively affects illness severity in cases of break through infections [8]. Severity of acute disease is associated with development of PCC [4, 9] and correspondingly it is hypothesized that vaccination prior to infection has a protective effect on development of long-term symptoms due to COVID-19.
Ideally, to define a symptom as related to COVID-19 a causal relation between this symptom and infection with SARS-CoV-2 is assessed. Lockdowns can affect mood and health in both the infected and uninfected. Therefore, there is a need for studies that assess to what extent symptoms after COVID-19 exceed background prevalence in the general population, as well as prevalence in symptomatic test-negative controls for SARS-CoV-2 [10]. Comparing prevalence of long-term symptoms that present in COVID-19 cases to the prevalence in both these control groups can help to identify a set of long-term symptoms that are associated with, or even specific to, COVID-19.
In this prospective cohort study we assessed to what extent prevalence and severity of long-term symptoms in mostly nonhospitalized COVID-19 cases exceeded the background prevalence and prevalence in people with acute symptoms who tested negative for SARS-CoV-2. Additionally, we evaluated the possible protective effect of vaccination prior to infection on long-term symptoms in COVID-19 cases.
METHODS
Design, Participants, and Inclusion
Data were collected in the context of the Dutch prospective Long COVID Study. Details on the study design are described in the study protocol [11]. In this article we report on COVID-19 cases aged 18 years or older 3 months after a positive SARS-CoV-2 test who joined the study between 19 May 2021 and 13 December 2021. Cases (included within 7 days after a positive polymerase chain reaction [PCR] or antigen SARS-COV-2 test) were recruited from 3 sources as defined in the study protocol [11]. To control for background prevalence of long-term symptoms in individuals without suspected or confirmed COVID-19, 2 control groups were included. One group consisted of test-negative adults, who were included within 7 days after a negative SARS-CoV-2 test and indicated the presence of symptoms as reason to perform the test (test-negative controls) to exclude tests for personal reasons such as travel; the other control group consisted of adults randomly invited by direct mail from the Dutch population (population controls). Controls with a history of confirmed SARS-CoV-2 infection or a suspected infection that had not been ruled out with a negative test were excluded from the analyses. This relied on participants taking a test following COVID-19 symptoms or contact. Moreover, it was assumed that asymptomatic controls either did not have a history of COVID-19 or did not suffer from long-term symptoms resulting from COVID-19. Vaccination of controls within the study period was not taken into account as a possible driver of long-term symptoms. All participants were asked to voluntarily self-register online on the study's website (https://longcovid.rivm.nl). All participants received a questionnaire at baseline (T0) and a follow-up questionnaire after 3 months (T3).
Outcomes
Our primary outcome was the prevalence of having at least 1 of the significantly elevated symptoms in cases compared to the controls. Secondary outcomes were the severity of the symptoms fatigue, dyspnea, pain, and cognitive impairment assessed with validated cutoff scores, and the difference in prevalence and severity of significantly elevated symptoms between cases that were or were not vaccinated at baseline.
For 41 symptoms, participants indicated its presence, and for fatigue, pain, cognitive impairment, and dyspnea symptom severity was also assessed. To assess fatigue severity we used the subscale fatigue of the Checklist Individual Strength (CIS) [12, 13]; for severity of cognitive impairment the Cognitive Failure Questionnaire (CFQ) [14, 15]; for pain severity the bodily pain subscale of the RAND SF-36 Health Status Inventory (SF-36) [16–18]; and for dyspnea severity the modified Medical Research Council (mMRC) scale [19]. The mMRC assessed the level of exercise-related dyspnea in people experiencing breathing difficulties to some extend and was only reported for participants who self-reported dyspnea. Clinically relevant severity of 1 of the 4 symptoms was assessed using cutoffs based on previously published normal scores for fatigue (CIS, subscale fatigue, score ≥35) [12, 13], cognitive impairment (CFQ, self-reported cognitive impairment, score ≥44) [14, 15], pain (SF-36, subscale bodily pain, score ≤55) [16–18], or dyspnea (mMRC, score ≥1) [19].
At baseline, data were collected on demographics, vaccination status, general health status, comorbidities (adapted from Treatment Inventory of Costs in Patients with Psychiatric disorders (TiC-P [20]) and on the use of health care and medication. Participants were categorized as being fully vaccinated, partially vaccinated, or unvaccinated at baseline (Supplementary Methods).
Statistical Analyses
Statistical procedures and sample size calculations were predefined in a published study protocol [11]. Descriptive statistics were used for participant characteristics, vaccination status, and to describe acute disease. The prevalence of all symptoms and the severity of fatigue, cognitive impairment, pain, and dyspnea were analyzed at T0 and T3, and compared between cases and the control groups. We considered all 41 symptoms reported at T3 in cases and controls. Symptoms with a significantly higher prevalence (Benjamini-Hochberg adjusted P value (PBH) < .05) in cases compared to both the test-negative controls and the population controls at T3 were regarded as possibly PCC related. We subsequently report on the primary outcome: prevalence of participants with at least 1 of the significantly elevated symptoms in cases compared to the controls.
Our primary analysis was based on a complete case analysis, that is, including only participants that completed both T0 and T3 surveys, without any missing data points as discussed in the study protocol [11]. As a sensitivity analysis, we used 4 additional scenarios to substitute missing data at T3, and included the symptoms significantly elevated in the primary analysis to assess alternative prevalence of at least 1 of these symptoms in cases and controls (specified in Supplementary Methods).
To assess the effect of vaccination, we used the symptoms significantly elevated in cases at T3, and compared the prevalence in fully vaccinated cases versus cases that were partially vaccinated or unvaccinated at the time of their positive SARS-CoV-2 test. A subgroup analysis was performed with cases that were infected when ≥ 85% of infections were due to the Delta variant in the Netherlands (from 4 July 2021 to 13 December 2021) to preclude impact of different virus variants and other possible bias due to period of inclusion.
For all comparisons of prevalence between study groups we used permutation tests stratified for the predefined confounders age, sex, level of education, and number of comorbidities (specified in Supplementary Methods), which are non-COVID factors possibly associated with the outcomes and might differ between the cases and controls. Subsequently, indirect standardization of symptom prevalence was performed with the cases as reference using the same confounders as for the permutation tests (Supplementary Methods). We identified statistical significance using 2-sided 5% significance levels, controlling differences for multiple testing according to the Benjamini-Hochberg procedure [21], reporting on adjusted P values. Analyses were performed with R version 4.1.0 (packages listed in Supplementary Methods).
Ethics Approval
The Utrecht Medical Ethics Committee declared in February 2021 that the Medical Research Involving Human Subjects Act does not apply to this study as it is survey based (protocol number 21-124/C).
RESULTS
Up to 13 December 2021, 14 572 participants were enrolled in the study as cases (n = 9116), test-negative controls (n = 1698), or population controls (n = 3708) (Figure 1). Overall response rate at T3 for these 3 groups of participants was 71.3% (10 389/14 572); 72.1% (6614/9166) for the cases, 78.3% (1330/1698) for the test-negative controls, and 65.9% (2445/3708) for the population controls.
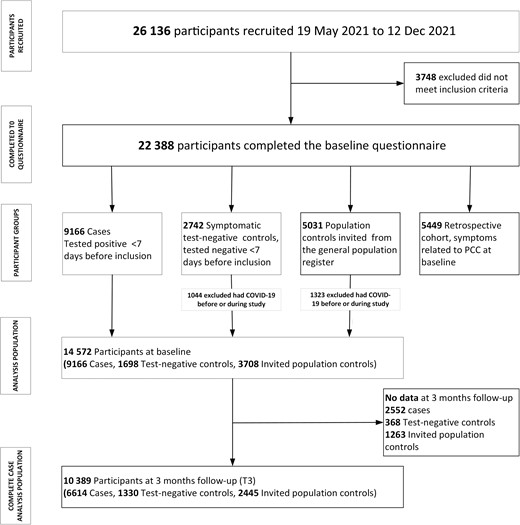
Flowchart of study participants and groups included in the study. Abbreviations: COVID-19, coronavirus disease 2019; PCC, post–COVID-19 condition.
Baseline characteristics of the cases and controls are shown in Table 1 and Supplementary Table 1 shows the characteristics of the complete case study population that completed both T0 and T3 (complete cases). A total of 13 symptoms were significantly elevated in cases compared to both control groups (PBH < .05) in the complete case scenario (Figure 2). The prevalence in cases of fatigue (31.1%), loss of smell (12.0%), dyspnea (16.4%), difficulty concentrating (15.0%), and difficulties in busy environment (13.1%) showed the largest absolute difference between cases and both control groups. Fatigue (CIS score ≥ 35), cognitive problems (CFQ score ≥ 44) and dyspnea (mMRC score ≥ 1) at a clinically relevant severity level also had a significantly higher prevalence compared to controls (PBH < .05; Supplementary Table 2 and Figure 3). The complete case subgroup analysis focusing on the Delta variant in the Netherlands (cases n = 6440, test-negative controls n = 1165, population controls n = 2415) did not alter the results (data not shown).
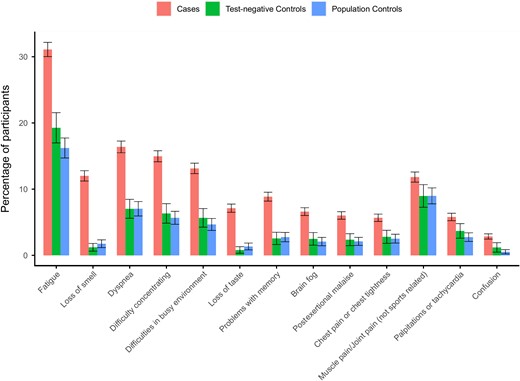
Standardized prevalence (95% confidence intervals) of the 13 symptoms at 3 months that were significantly elevated (Benjamini-Hochberg adjusted P value < .05) between cases and both control groups using complete case analysis without substituting for missing values at 3 months. Symptoms are ranked by the absolute difference in prevalence between cases and test-negative controls.
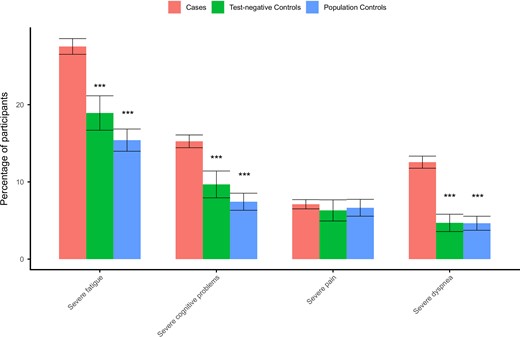
Standardized prevalence (95% confidence intervals) of severity score cutoff values in cases and both control groups using complete case analysis without substituting for missing values at 3 months: severe fatigue, Checklist Individual Strength, subscale fatigue ≥35; severe cognitive problems, Cognitive Failure Questionnaire ≥ 44; severe pain, SF-36 subscale bodily pain ≤55; and severe dyspnea, modified Medical Research Council dyspnea scale ≥1. ***Benjamini-Hochberg adjusted P value <.001 compared to cases.
Demographics and Acute Illness at Baseline
| Characteristic | Cases | Test-Negative Controls | Population Controls |
|---|---|---|---|
| n | 9116 | 1698 | 3708 |
| Age, median (IQR) | 49.0 (37–61) | 55.3 (41–65) | 52.2 (40–60) |
| Sex, % (n) | |||
| ȃFemale | 63.7 (5810) | 65.7 (1115) | 67.1 (2487) |
| ȃMale | 36.0 (3286) | 33.9 (576) | 32.8 (1215) |
| ȃOther | 0.2 (20) | 0.4 (7) | 0.1 (6) |
| Pregnancy, % (n) | 2.4 (70) | 1.3 (5) | 4.4 (42) |
| BMI, mean (SD) | 25.71 (4.64) | 25.94 (4.79) | 25.76 (4.58) |
| Smoking, % (n) | |||
| ȃCurrent smoker | 5.3 (484) | 8.2 (139) | 7.4 (273) |
| ȃFormer smoker | 24.5 (2231) | 29.7 (505) | 20.1 (747) |
| ȃNever smoker | 66.6 (6075) | 58.5 (994) | 70.0 (2595) |
| Level of education, % (n) | |||
| ȃLow | 3.3 (303) | 2.1 (36) | 5.6 (208) |
| ȃMedian | 37.2 (3388) | 26.9 (456) | 40.9 (1515) |
| ȃHigh | 59.5 (5425) | 71.0 (1206) | 53.5 (1985) |
| History of COVID-19, % (n) | 9.4 (860) | 0.0 (0) | 0.0 (0) |
| No. of comorbidities, % (n) | |||
| 0 | 48.4 (4413) | 40.2 (682) | 54.0 (2004) |
| ȃ1–2 | 41.6 (3792) | 43.8 (743) | 36.4 (1350) |
| ȃ>2 | 10.0 (911) | 16.1 (273) | 9.5 (354) |
| Respiratory disease, % (n) | 16.5 (1507) | 21.0 (356) | 10.9 (403) |
| Hypertension, % (n) | 10.8 (989) | 14.7 (249) | 10.0 (370) |
| Diabetes, % (n) | 2.8 (256) | 3.1 (53) | 3.2 (120) |
| Cardiovascular disease, % (n) | 1.8 (163) | 2.7 (45) | 1.5 (54) |
| Use of health care, % (n) | 10.7 (977) | 12.2 (207) | 6.0 (224) |
| Medication use, % (n) | 77.1 (7032) | 69.8 (1185) | 21.8 (808) |
| Admitted to hospital, % (n) | 0.1 (10) | 0.2 (3) | 0.6 (9) |
| Vaccination status at T0, % (n) | |||
| ȃFully vaccinated | 72.3 (6466) | 76.7 (1294) | 87.0 (3166) |
| ȃPartially vaccinated | 9.7 (868) | 5.9 (99) | 3.2 (116) |
| ȃUnvaccinated | 17.9 (1604) | 17.4 (294) | 9.8 (357) |
Abbreviations: BMI, body mass index; COVID-19, coronavirus disease 2019; IQR, interquartile range.
Figure 4 shows that in the complete case scenario, almost half (48.5%) of cases reported at least 1 of the 13 significantly elevated symptoms, compared to 29.8% of test-negative controls and 26.0% of population controls. The difference between cases and both control groups persisted in the 4 alternative substitution scenarios, although in the best case scenario the symptom prevalence in both cases and controls was considerably lower (Supplementary Figure 1). Symptoms in cases related to cognition (concentration problems, difficulties in a busy environment, brain fog and confusion, and severe cognitive impairment) more often had an onset after baseline, whereas other symptoms more often persisted from baseline onwards (Supplementary Figure 2).
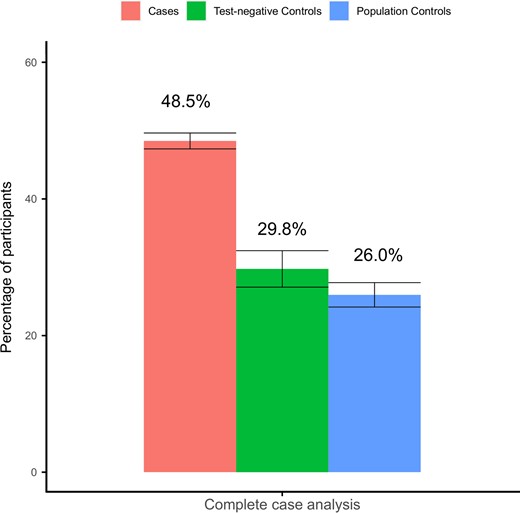
Standardized prevalence of at least 1 of the significantly elevated symptoms at 3 months in cases compared to controls in the complete case analysis without substituting for missing values.
As a result of the timing of recruitment and the vaccination strategy in the Netherlands, which initially targeted the older population, we recruited only a small number of unvaccinated cases that were ≥65 years of age, and the analysis on vaccination effect prior to infection could only be performed on cases that were aged <65 years. Supplementary Figure 3 shows that cases <65 years old that were fully vaccinated had a significantly lower prevalence of loss of smell and loss of taste. Other symptoms did not significantly differ between fully, partially, or unvaccinated cases in all included cases, and in the subgroup analysis focusing on the Delta variant only (data not shown). Prevalence of at least 1 of the significantly elevated symptoms in cases was 51.7%, 56.6%, and 50.0%, respectively, in fully vaccinated, partially vaccinated, and unvaccinated cases (Supplementary Figure 4). Differences in baseline characteristics between fully vaccinated, partially vaccinated, and unvaccinated cases, type of vaccination, and effect of vaccination prior to infection on symptoms at T0 are described in the Supplementary Results (Supplementary Table 3 and Supplementary Figure 5). Among the elevated symptoms, at T0, fatigue, difficulties in a busy environment, chest pain or chest tightness, muscle pain/joint pain, and confusion were significantly decreased in fully vaccinated compared to unvaccinated participants (Supplementary Figure 5).
DISCUSSION
In this large observational prospective cohort study, almost half of the COVID-19 cases (48.5%) reported at least 1 of the possibly PCC-related symptoms 3 months after SARS-CoV-2 infection, which was approximately 1.5–2 times higher than the background prevalence in the general population (26.0%) and in individuals that likely had another respiratory infection (29.8%). Only 13 out of 41 considered symptoms were increased in cases compared to controls. Fatigue (31.1%), loss of smell (12.0%), dyspnea (16.4%), concentration difficulties (15.0%), and difficulties in a busy environment (13.1%) showed the largest difference in prevalence between cases and controls. Severe fatigue, severe cognitive impairment, and severe dyspnea were increased in the cases as well. In cases that were fully vaccinated for SARS-CoV-2 prior to infection, prevalence of loss of smell and loss of taste 3 months after infection was lower compared to unvaccinated cases (only assessed for the subgroup <65 years of age).
Our finding that 48.5% of COVID-19 cases had at least 1 possibly PCC-related symptom 3 months after the infection is within the range of reported pooled estimates at 3 months in literature ranging from 29% to 55% [22–24]. However, studies included in pooled estimates are highly heterogeneous with regard to which symptoms were studied, the number of symptoms studied, and the included study population. The significantly elevated symptoms in our study are consistent with the World Health Organization (WHO) definition that claims common PCC symptoms include, but are not limited to, fatigue, shortness of breath, and cognitive dysfunction [3]. In a nonhospitalized population, fatigue was reported by up to 63% of cases [4, 9, 25], dyspnea or shortness of breath by up to 40% [9, 22, 26, 27], and cognitive symptoms such as word-finding difficulties, brain fog, and concentration problems by up to 40% [4, 22, 27], with a follow-up time ranging from 1 to 12 months. Some of the long-term symptoms after COVID-19 reported in the literature, including general malaise, headache, cough, and diarrhea [10, 22, 28], were commonly reported in cases in our study, but did not show significant higher prevalence in cases compared to the control groups. These symptoms may therefore be due to other causes such as other infections or comorbidities. The observed differences between cases and controls indicate that COVID-19 cases are much more likely to report long-term symptoms than people without COVID-19 and also much more likely than people with acute symptoms that test negative for COVID-19 who likely have another respiratory infection.
The impact of COVID-19 thus clearly exceeds the background prevalence, but also the impact of other respiratory infections. The differences in prevalence between the controls indicate that the prevalence of long-term symptoms after other circulating pathogens is much less common compared to symptoms after COVID-19.
Cognitive symptoms such as brain fog, confusion, and concentration difficulties were shown to more often have a later onset after infection compared to other possible PCC symptoms. One study found a positive correlation between severity of cognitive impairment and time since infection [29]. It remains unclear whether these symptoms are underrecognized as such by patients in the acute phase, or whether the cognitive impairment becomes apparent or develops only once patients start resuming their usual activities after a period of disease.
The group of unvaccinated cases was small, and included few people aged ≥ 65 years; therefore, the vaccination effect was only assessed for cases aged <65 years. Vaccination had a protective effect on loss of smell and taste at 3 months. Vaccination had no effect on the prevalence of other symptoms or on the overall prevalence of at least 1 possible PCC-related symptom. Unlike most of the other possible PCC-related symptoms, loss of smell and taste showed a very low background prevalence in controls (below 2%), indicating that the vast majority of these 2 symptoms in cases is very likely caused by COVID-19. For most other symptoms the background prevalence was substantial and for some our analysis may not have been sensitive enough to address the actual vaccination effect. In addition, those vaccinated could have risk factors (for example immune-compromised conditions) that increase the likelihood of a (symptomatic) breakthrough infection as well as the risk for development of long-lasting symptoms [30]. Although we did control for comorbidities, we cannot exclude the impact of other such risk factors in our study design. Despite this limitation, and also that data on the effect of vaccination prior to infection on long-term symptoms were gathered from observational studies, the majority of currently available studies do find a decreased prevalence of long-terms symptoms [31–34].
The circulating strains during the study period were Alpha and Delta, but the majority of the cases were included when Delta was predominant (≥ 85%). At the end of our inclusion period, Delta was rapidly replaced by Omicron as the dominant variant in the Netherlands. Although it is unlikely that many in our sample have been miscategorized, subsequent analysis by others does reveal a lower probability of PCC following Omicron [35]. We hope to analyze this potential difference between Delta and Omicron ourselves in the future, correcting for reinfections and booster vaccinations. Furthermore, our study may have missed participants with no or only minimal acute symptoms at baseline, because they may have been less likely to do a SARS-CoV-2 test. As severity of acute symptoms is reported to be a risk factor for long-term symptoms after COVID-19 [4, 6], this may have led to an overestimation of prevalence of possible PCC-related symptoms after infection if all (including asymptomatic) infections were taken into account. Even though we recruited participants nationwide and from the general population, our study population includes more women, people with a high level of education, and people born outside the Netherlands, and fewer current smokers than in the overall Dutch population. At 3 months after inclusion, some symptoms such as fever, cough, and a sore throat were more often reported in controls compared to cases. There was an elevation in influenza cases from March 2022 in the Netherlands, possibly resulting in a relatively high background prevalence of these symptoms in controls 3 months after inclusion.
A major strength of our study is that we included a large number of both COVID-19 cases as well as 2 control groups with a prospective follow-up. The effect of possibly unnoticed SARS-CoV-2 infections on the controls groups was at most modest, because population controls were excluded if they experienced symptoms possibly due to a SARS-CoV-2 infection, and regarding test-negative controls the applied tests in the Netherlands had high sensitivity. The control groups therefore enabled comparison of long-term symptoms in COVID-19 cases with the background prevalence, as well as with the prevalence of symptoms likely due to other respiratory infections. We expect to have prevented recall bias by including participants shortly after testing for COVID-19. Moreover, recruiting from test sites enabled inclusion of COVID-19 cases that were not hospitalized in the acute phase of the disease, which is the case for the vast majority of infections, and thus more representative for the impact of COVID-19 at the population level.
This study also has limitations. First, data collection only comprised self-reported information without clinical evaluation of symptoms. However, because of this design we were able to use validated questionnaires with population normal scores, and control groups to correct for the background prevalence. Due to the self-reported results we were not able to preclude possible alternative causes of the reported symptoms. Instead, we addressed symptoms that were significantly elevated in cases compared to controls, in contrast to the WHO definition of PCC, which stipulates an exclusion of alternative causes. Moreover, response on the follow-up survey at 3 months was 71% and it could be that the 29% missing at T3 were, to some extent, the more severely ill participants, or conversely the participants more likely to have no symptoms. Therefore, we applied alternative scenarios to substitute the missing values, which showed a limited influence of dropouts on the robustness of our conclusion based on the complete case analysis. In our analysis we opted for a cross-sectional design, as it focused on symptoms at T3, independent of the duration. Once follow-up has largely completed a 12-month period, we will perform longitudinal analyses with 3-month intervals that will take into account to what extent symptoms consistently persist more than 3 months after infection. Finally, in our study period, 2 different variants circulated in the Netherlands (Alpha and Delta). We were not able to look at the impact of the variant at an individual level, but we performed a subgroup analysis on period of inclusion, which did not affect results considering the prevalence of long-term symptoms in cases or on symptom prevalence in vaccinated compared to unvaccinated cases.
CONCLUSIONS
Three months after infection with SARS-CoV-2 almost half of all COVID-19 cases still experienced at least 1 symptom, which is approximately 1.5–2 times higher prevalence than in individuals that likely had another respiratory infection and the background prevalence. Moreover, fatigue, cognitive impairment, and dyspnea were more often severe in the cases compared to controls. As these symptoms were significantly elevated in cases compared to controls they are potentially related to PCC. Knowledge on what long-term symptoms are associated with PCC is highly relevant to target possible treatment strategies, for clinical decision-making, and for interventional studies to improve long-term outcomes. The substantial background prevalence in the general population further illustrates the challenge in clinical practice to assess whether, for individual patients, the reported long-term symptoms after COVID-19 are due to SARS-CoV-2 infection or other causes. Vaccination prior to infection in our study population, mostly infected with the Delta variant, protected against loss of smell or taste, but not other long-term symptoms in COVID-19 cases.
Supplementary Data
Supplementary materials are available at The Journal of Infectious Diseases online. Consisting of data provided by the authors to benefit the reader, the posted materials are not copyedited and are the sole responsibility of the authors, so questions or comments should be addressed to the corresponding author.
Notes
Acknowledgment. We thank Caroline van den Ende for structural updating of literature on post–COVID-19 condition.
Author contributions. T. M., A. H., C. W., and E. F. conceptualized the study. E. M., C. W., K. L., H. K., and A. W. designed the study protocol and statistical analysis. T. M., E. M., K. L., and J. S. analyzed the data. T. M., E. M., K. L., S. B., A. T., A. H., E. F., and C. W. contributed to the data interpretation. T. M. coordinated the data collection and drafted the manuscript. All authors reviewed and edited revisions of the manuscript, had full access to all the data in the study, and had final responsibility for the decision to submit for publication.
Disclaimer. The Dutch Ministry of Health, Welfare and Sport did not have a role in the design of this study, its execution, analyses, and interpretation of results.
Financial support. This work was supported by the Dutch Ministry of Health, Welfare and Sport and executed by the National Institute for Public Health and the Environment.
References
Author notes
A. J. H., E. F., and C. C. W. contributed equally to the study.
Potential conflicts of interest. All authors: No reported conflicts of interest. All authors have submitted the ICMJE Form for Disclosure of Potential Conflicts of Interest. Conflicts that the editors consider relevant to the content of the manuscript have been disclosed.

