


Abstract
Severe acute respiratory syndrome coronavirus 2 (SARS-CoV-2) reverse-transcription polymerase chain reaction (RT-PCR) provides a highly variable cycle threshold (Ct) value that cannot distinguish viral infectivity. Subgenomic ribonucleic acid (sgRNA) has been used to monitor active replication. Given the importance of long RT-PCR positivity and the need for work reincorporation and discontinuing isolation, we studied the functionality of normalized viral loads (NVLs) for patient monitoring and sgRNA for viral infectivity detection.
The NVLs measured through the Nucleocapsid and RNA-dependent-RNA-polymerase genes and sgRNA RT-PCRs were performed in 2 consecutive swabs from 84 healthcare workers.
The NVLs provided similar and accurate quantities of both genes of SARS-CoV-2 at 2 different timepoints of infection, overcoming Ct-value and swab collection variability. Among SARS-CoV-2-positive samples, 51.19% were sgRNA-positive in the 1st RT-PCR and 5.95% in the 2nd RT-PCR. All sgRNA-positive samples had >4 log10 RNA copies/1000 cells, whereas samples with ≤1 log10 NVLs were sgRNA-negative. Although NVLs were positive until 29 days after symptom onset, 84.1% of sgRNA-positive samples were from the first 7 days, which correlated with viral culture viability. Multivariate analyses showed that sgRNA, NVLs, and days of symptoms were significantly associated (P < .001).
The NVLs and sgRNA are 2 rapid accessible techniques that could be easily implemented in routine hospital practice providing a useful proxy for viral infectivity and
coronavirus disease 2019 patient follow-up.
Severe acute respiratory syndrome coronavirus 2 (SARS-CoV-2) is a ribonucleic acid (RNA) virus that emerged in Wuhan, China at the end of 2019 and spread rapidly worldwide with 10%–15% of severe courses and 2.2% of associated mortality [1, 2]. The main method for SARS-CoV-2 diagnosis is reverse transcription-polymerase chain reaction (RT-PCR). This technique provides a cycle threshold (Ct) value, which is inversely related to viral load, such that every increase in a Ct value of 3.3 corresponds to an approximate 10-fold reduction of RNA amounts. This value has been used to aid in interpretation and clinical decision making [3]. However, Ct values are not directly comparable across assays [4] and do not reflect the true viral load, which requires standardization using reference curves. Moreover, further variations may occur due to differences in specimen collection quality and reaction conditions [5]. Sample quality should be verified by cell quantification and normalization of viral loads to complement the RT-PCR results in the diagnosis [6].
Severe acute respiratory syndrome coronavirus 2 RT-PCR can remain positive for several weeks after clinical recovery in sicker patients, as well as in asymptomatic and mild ill individuals, leading to prolonged isolation and long work leave [7]. Higher viral load peaks have been found during the first week of the infectious process generally coinciding with the pre- or asymptomatic period, when most transmissions have been described [8]. However, the duration of infectivity after the onset of clinical symptoms remains uncertain.
Viral culture is the gold standard technique for viral viability. Recent studies have shown efficient transmission of SARS-CoV-2 to contact-infected hamsters, and the results have been correlated with the detection of infectious virus by culture but not by RT-PCR viral loads alone [9]. Virus culture might be a good surrogate for transmissibility; however, high biosafety laboratory equipment and the long-term response limit the usefulness of this technique.
Viral subgenomic RNAs (sgRNA) in coronaviruses are only transcribed in infected cells and are poorly incorporated into mature virions, indicating the presence of actively infected cells in the samples [10, 11]. Severe acute respiratory syndrome coronavirus 2 sgRNA has been used as a surrogate indicator of active virus replication with a limit of sensitivity of 0.4% of genomic RNA, showing active replication in throat swabs during the first 5 days of symptoms [12], which, however, should be verified with viral culture.
Understanding the duration of SARS-CoV-2 infectivity is crucial for discontinuing isolation, healthcare worker (HCW) reincorporation, particularly in hospitals facing staff shortages, and saving testing supplies of repeated RT-PCRs. Therefore, strategies aiming at an early diagnosis of infected HCWs, preventing nosocomial infections, and deciding work reincorporation policies are still needed.
The main objective of this study was to provide 2 tools for improving clinical decision making and work reincorporation in coronavirus disease 2019 (COVID-19) patients: (1) normalized viral loads (NVLs) for patient monitoring; and (2) sgRNA as a surrogate marker of active replication for discontinuing isolation and work reincorporation in a cohort of HCWs.
MATERIAL AND METHODS
Study Population
According to hospital protocol, RT-PCR screening for SARS-CoV-2 was performed weekly by the Prevention Service on every HCW working in COVID-19 areas in the Hospital Clinic of Barcelona and also in those HCWs with self-reported symptoms suspicious of COVID-19. Every infected HCW was followed by the Home Hospital Unit, with medical and nurse assessment by phone/video calls, home visits, and day-hospital visits if needed for further testing.
This study is based on the prospective cohort of infected HCW from the Hospital Clinic of Barcelona from the first diagnosis of COVID-19 (February 25, 2020) until the of May 25, 2020 [13]. Only patients with 2 consecutive positive SARS-CoV-2 RT-PCR results were included in the analysis. Work reinstatement was decided by the Human Resources and Work Health Department according to governmental protocols.
Laboratory Testing
Inactivation and Extraction of Samples
All samples were inactivated with 1:1 volume of Cobas Omni Lys (Roche, Basilea, Germany), and total nucleic acid was extracted using MagNA Pure Compact (Mannheim, Germany). Throat/nasopharyngeal swabs and elutes were aliquoted and stored at −80°C.
Ribonucleic Acid Reverse-Transcription Polymerase Chain Reaction Quantification and Normalization of Severe Acute Respiratory Syndrome Coronavirus 2
Severe acute respiratory syndrome coronavirus 2 RT-PCR of the Nucleocapsid (N) and the RNA-dependent RNA polymerase (RdRp) genes were used to quantify the number of RNA copies per PCR using the SARS-COV-2 R-GENE kit (bioMérieux, Marcy l’Étoile, France) following the manufacturer’s instructions. This test has a sensitivity limit of 380 copies/mL. Viral load was quantified in RNA copies per PCR using a standard curve made with AMPLIRUN SARS-CoV-2 RNA CONTROL (Vircell, Granada, Spain). Nasopharyngeal swab quality was checked by the CELL Control r-gene kit (bioMérieux, Marcy l’Étoile, France) that provides a quantified plasmid with the HPRT1 housekeeping gene for cellular quantification. Samples with <100 cells/PCR were discarded. Viral loads were normalized according to cellular quantification as the number of RNA copies per 1000 cells. Extraction and both amplifications were checked with positive and negative controls for each reaction.
Reverse-Transcription Polymerase Chain Reaction for Subgenomic Ribonucleic Acid Detection for Severe Acute Respiratory Syndrome Coronavirus 2
All samples were tested for the presence of Envelope (E) sgRNA using the leader-specific primer described by Wölfel et al [12] as well as primers and probes targeting sequences downstream of the start codons of the E gene [14]. Reverse-transcription PCR of E genomic RNA was performed only in sgRNA-positive samples to estimate the amount of sgRNA through 2(Ct sgRNA − Ct gRNA) [12]. Reverse-transcription PCRs were performed using the SuperScript III Platinum One-Step RT-PCR kit (Invitrogen) with 400 nM primer concentration and 200 nM probe concentration. Cycling involved 15 minutes at 50°C for reverse transcription, 3 minutes at 95°C for Taq activation and 45 cycles of 10 seconds at 95°C, 15 seconds at 60°C (where the fluorescence was quantified), and 5 seconds at 72°C in the thermocycler StepOne (Applied Biosystems).
Severe Acute Respiratory Syndrome Coronavirus 2 Serology
Specific anti-SARS-CoV-2 immunoglobulin G (IgG) was determined using the qualitative Elecsys Anti-SARS-CoV-2 immunoassay (Roche, Basilea, United Kingdom).
Statistical Analysis
We report the number and percentage of patients for categorical variables and the median (first quartile; third quartile) for continuous variables. Categorical variables were compared using the χ 2 or Fisher exact test, whereas 2 groups of continuous variables were compared using the nonparametric Mann-Whitney U test. Spearman’s correlation coefficient was used to measure the relationship between 2 continuous variables. RdRp RNA copies/1000 cells and N RNA copies/1000 cells were log10 transformed for normalization before analysis. Linear regression analyses were also used to examine the associations between continuous clinical parameters and RdRp RNA copies/1000cells, N RNA copies/1000 cells and sgRNA; whereas logistic regression analyses were performed to determine the relationship between dichotomous clinical parameters and RdRp RNA copies/1000 cells, N RNA copies/1000 cells and sgRNA. Continuous clinical parameters refers to days of symptoms, age, etc. Dichotomous parameters are gender, comorbidities, treatment, X ray check requirement, etc. The associations were further assessed with regression models adjusting for age, sex, and comorbidities. The effect sizes of association were shown as regression coefficients and 95% confidence intervals (CIs) for continuous parameters and odds ratios and 95% CIs for dichotomous parameters. The level of significance was set at 0.05 (2-tailed). All analyses were performed using IBM SPSS Version 26.0 (IBM Corp., Armonk, NY).
Ethical Approval
The study protocol was evaluated and approved by the Ethical Board of the Hospital Clínic of Barcelona (HCB/2020/0444). The informed consent waiver was provided due to the state of infectious disease emergency. Admission to the Home Hospitalization program was voluntary, as was every medical procedure performed.
RESULTS
Clinical Description
A total of 93 HCWs were selected for having 2 consecutive positive SARS-CoV-2 RT-PCRs with at least a 7-day gap between tests. Assays could not be performed in 9 subjects due to lack of samples, negative RT-PCR repetition, or no clinical data collected. The 84 HCWs analyzed had a median age of 33.5 (interquartile range [IQR], 27–50.5) years and 58 (69%) of them were females. Clinical characteristics are shown in Table 1.
Clinical Description of SARS-CoV-2-Infected Healthcare Workers Cohort
| Characteristics | Value |
|---|---|
| Age, years (median, IQR) | 33.5 (27–50.5) |
| Female, sex, n (%) | 58 (69%) |
| Current smokers, n (%) | 3 (3.6%) |
| Comorbiditiesa, n (%) | 12 (14.3%) |
| Clinical Features | |
| Symptomatic at diagnosis, n (%) | 74 (88.1%) |
| Days from symptoms onset until 1st PCR (median, IQR) | 3 (1–6) |
| Days from symptoms onset until 2nd PCR (median, IQR) | 15 (14–19) |
| Symptoms, n (%) | 77 (91.7%) |
| Cough, n (%) | 56 (66.7%) |
| Fever, n (%) | 23 (27.4%) |
| Dyspnea, n (%) | 10 (11.9%) |
| Hyposmia/anosmia, n (%) | 35 (41.7%) |
| Dysgeusia, n (%) | 26 (31%) |
| Gastrointestinal disorders, n (%) | 17 (20.2%) |
| Asymptomatic, n (%) | 7 (8.3%) |
| Treatment, n (%) | 5 (6%) |
| Serology SARS-CoV-2 IgG | |
| Positive, n (%) | 80 (98.8%) |
| Negative, n (%) | 1 (1.2%) |
| Days from symptom onset until positive serology (median, IQR) | 44 (36–52) |
Abbreviations: IgG, immunoglobulin G; IQR, interquartile range; n, number of patients; PCR, polymerase chain reaction; SARS-CoV-2, severe acute respiratory syndrome coronavirus 2.
aComorbidities include dyslipidemia, hypertension, chronic lung disease, ischemic heart disease, chronic kidney disease, and neoplasm.
The SARS-CoV-2 infection in this cohort of HCWs was detected by routine hospital screening in 33.8%, due to symptom reporting in 64.6%, and by direct contact in 1.5%. Symptoms were reported at some point during the infection in 91.7% of the total study population, with 89.3% being symptomatic at the time of diagnosis. Only 7 (8.3%) patients remained asymptomatic.
One month after the HCW screening started, specific anti-SARS-CoV-2 IgG serology was performed. All participants presented positive serology, except 1 that remained negative even 43 days after the first detection. Serology was not performed in 3 subjects.
During follow-up, 6 (7%) patients required chest x-ray, 3 presented bilateral infiltrates, and 3 were normal. Five (6%) subjects required treatment according to the local guidelines at that time (azithromycin, hydroxychloroquine, lopinavir/ritonavir, and prednisone). None of the HCWs in the present study required oxygen supplementation or hospital admission.
Microbiologic Results
A total of 168 nasopharyngeal/throat swabs from the 84 patients were selected to quantify viral loads based on the N and the RdRp genes and normalized per 1000 cells by RT-PCR. All samples were SARS-CoV-2 positive for at least 1 of the target genes and had >100 cells per swab to be considered.
The RT-PCR Ct values and NVLs of the N and RdRp genes of the 1st and 2nd samples are shown in Table 2. Results demonstrated that Ct values were very variable when testing different genes in the 2nd RT-PCR, whereas NVL results provided similar results for the RdRp and N genes in the 1st and 2nd detections.
RT-PCR Ct Values and Normalized Viral Loads of the SARS-CoV-2 RdRp and N Genes
| RdRp Gene | N Gene | |||
|---|---|---|---|---|
| Assay | Ct Valuea | NVLb | Ct Valuea | NVLb |
| 1st RT-PCR | 26.58 (22.36–28.99) | 2.52E + 03 (4.23E + 02; 7.96E + 04) | 26.65 (22.07–32.52) | 4.00E + 03 (1.38E + 02; 1.24E + 05) |
| 2nd RT-PCR | 29.99 (27.63–31.95) | 7.55E + 01 (1.85E + 01; 2.45E + 02) | 34.25 (30.77–35.56) | 1.61E + 01 (7.37E + 00; 4.05E + 01) |
| Subtraction | 3.71 (0.34–7.62) | 1.78 log10 (0.59; 3.15) | 5.71 (1.32–11.05) | 2.1 log10 (0.95; 3.74) |
Abbreviations: Ct, cycle threshold; N, nucleocapsid; NVL, normalized viral loads; RdRp, ribonucleic acid (RNA)-dependent RNA polymerase; RT-PCR, reverse-transcription polymerase chain reaction; SARS-CoV-2, severe acute respiratory syndrome coronavirus 2.
aMedian (interquartile range).
bMedian of RNA copies/1000 cells (interquartile range).
NOTE: Subtraction indicates the difference of the 2nd PCR minus the 1st PCR values.
Subgenomic RNA RT-PCR was performed in the 168 samples as an indicator of active replication. The results showed that sgRNA was positive in 43 (51.19%) HCWs in the 1st RT-PCR and in 5 (5.95%) in the 2nd, after a 12-day interval (IQR, 11–16). Subgenomic RNA results were compared with N and RdRp RT-PCR Ct values and NVL (RNA copies/1000 cells) in linear and logarithmic scales demonstrating a highly significant correlation with both parameters (Table 3). All samples with N and RdRp RT-PCR Ct values <24.38 were sgRNA positive, whereas samples with Ct values >27.85 were sgRNA negative. In relation to NVL, all samples with >4 log10 RNA copies/1000 cells were sgRNA positive, 1–3 log10 samples were variable, and ≤1 log10 samples were sgRNA negative (Figure 1).
Association Between Subgenomic RNA and N and RdRp RT-PCR Ct Values and Normalized Viral Loads of the 1st and 2nd RT-PCR
| Detection | Gene | Variable | Total | Negative sgRNA | Positive sgRNA | P Value |
|---|---|---|---|---|---|---|
| 1st RT-PCR | N | n | 81 | 38 | 43 | |
| Ct valuea | 26.65 (22.07–32.52) | 32.66 (30.23–34.53) | 22.54 (17.94–25.09) | <.001 | ||
| NVLb | 4000 (138.05–124 130.88) | 123.28 (39.63– 633.64) | 119 915.25 (20 997.88–380 403.46) | <.001 | ||
| Log10 NVLb | 3.6 (2.14–5.09) | 2.09 (1.6–2.8) | 5.08 (4.32–5.58) | <.001 | ||
| RdRp | n | 84 | 41 | 43 | ||
| Ct valuea | 26.58 (22.36–28.99) | 28.97 (27.85–29.95) | 22.41 (18.78–24.3) | <.001 | ||
| NVLb | 2520.51 (423.06–79 624.99) | 396.11 (113.5–1435) | 79024 (13 571.43–383 915.02) | <.001 | ||
| Log10 NVLb | 3.4 (2.63–4.9) | 2.6 (2.05–3.16) | 4.9 (4.13–5.58) | <.001 | ||
| 2nd RT-PCR | N | n | 79 | 74 | 5 | |
| Ct valuea | 34.25 (30.77–35.56) | 34.46 (31.88–35.63) | 29.07 (27.5–30.07) | .010 | ||
| NVLb | 16.16 (7.37–40.53) | 15.36 (7.14–32.29) | 1502.86 (477.19–2624.29) | .001 | ||
| Log10 NVLb | 1.21 (0.87–1.61) | 1.19 (0.85–1.51) | 3.18 (2.68–3.42) | .001 | ||
| RdRp | n | 84 | 79 | 5 | ||
| Ct valuea | 29.99 (27.63–31.95) | 30.06 (27.71–31.98) | 27.32 (25.68–30.1) | .135 | ||
| NVLb | 75.55 (18.47–245.64) | 73 (15.51–236) | 1247 (25.7–2914.29) | .123 | ||
| Log10 NVLb | 1.88 (1.26–2.39) | 1.86 (1.19–2.37) | 3.1 (1.41–3.46) | .123 |
Abbreviations: Ct, cycle threshold; n, number of samples; NVL, normalized viral loads; RdRp, ribonucleic acid (RNA)-dependent RNA polymerase; RT-PCR, reverse-transcription polymerase chain reaction; sgRNA, subgenomic RNA.
aMedian (interquartile range).
bMedian (interquartile range) of linear (RNA copies/1000 cells) and logarithmic scales (log10 RNA copies/1000 cells).
NOTE: P values obtained from the Mann-Whitney test. P < .05 are indicated in bold.
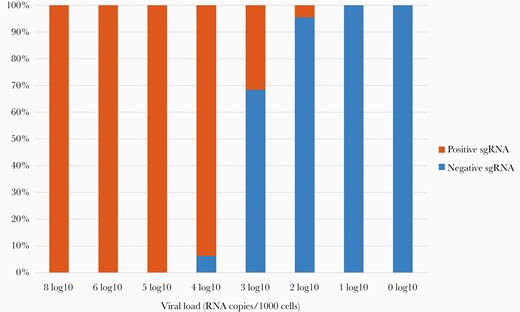
Subgenomic ribonucleic acid (sgRNA) detection compared with normalized viral loads. Normalized viral loads were quantified as log10 RNA copies per 1000 cells. Subgenomic RNA was qualitatively determined as positive or negative by reverse-transcription polymerase chain reaction. The 1st and 2nd sample determinations of each patient are shown.
Microbiologic and Clinical Variables Association
Normalized viral loads of the 74 HCWs symptomatic at diagnosis were compared with days after symptom onset (Figure 2A). Normalized viral loads of the N and RdRp genes decreased over time. The SARS-CoV-2 samples remained positive until 29 days after symptom onset and only 1 sample 38 days afterwards.
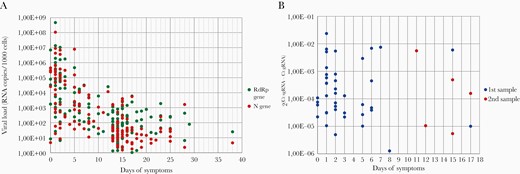
Normalized severe acute respiratory syndrome coronavirus 2 N and RdRp viral loads and subgenomic ribonucleic acid (sgRNA) of the first and second detection compared with days of symptoms. (A) Viral loads were measured by reverse-transcription polymerase chain reaction and normalized to RNA copies per 1000 cells. Quantification was performed with the RNA-dependent RNA polymerase (RdRp) and Nucleocapsid (N) genes in each specimen. (B) Subgenomic RNA transcripts in relation to genomic RNA cycle threshold (Ct) values are expressed as 2(Ct sgRNA − Ct gRNA) and plotted against days of symptoms.
Results showed that sgRNA was positive in 3 asymptomatic HCWs in the 1st RT-PCR and in 1 subject who presented symptoms after the 1st RT-PCR. Of the rest of positive sgRNA samples, 84.1% were from ≤7 days after symptom onset, and this percentage declined over infection-time, as shown in Figure 2B. Dividing the presence of sgRNA by different intervals of days of symptoms, the highest proportion of sgRNA detection was in samples from ≤7 days, being only 7 samples sgRNA-positive from the 7th day onwards (Table 4). Statistical analyses showed that all 3 parameters (sgRNA, RdRp, and N NVL) were significantly associated with days of symptoms (see Supplementary Table 1).
Subgenomic RNA of the 1st and 2nd RT-PCR Results Divided by Intervals of Days After Symptom Onset
| Days of Symptoms | Positive sgRNA | Negative sgRNA | Total |
|---|---|---|---|
| 1–5 | 34 (68%) | 16 (32%) | 50 |
| 6–7 | 3 (37.5%) | 5 (62.5%) | 8 |
| 8–10 | 1 (10%) | 9 (90%) | 10 |
| 11–14 | 2 (5.9%) | 32 (94.1%) | 34 |
| >14 | 4 (8.7%) | 42 (91.3%) | 46 |
| Days of Symptoms | Positive sgRNA | Negative sgRNA | Total |
|---|---|---|---|
| 1–5 | 34 (68%) | 16 (32%) | 50 |
| 6–7 | 3 (37.5%) | 5 (62.5%) | 8 |
| 8–10 | 1 (10%) | 9 (90%) | 10 |
| 11–14 | 2 (5.9%) | 32 (94.1%) | 34 |
| >14 | 4 (8.7%) | 42 (91.3%) | 46 |
Abbreviations: RNA, ribonucleic acid; RT-PCR, reverse-transcription polymerase chain reaction; sgRNA, subgenomic RNA.
Univariant and multivariant analyses of microbiological results and the remaining clinical data were carried out to determine potential risk factors (see Supplementary Table 2). Only significant associations (P < .05) with a 95% CI were presented (Table 5). The only 2 symptoms that individually correlated with SARS-CoV-2 viral load in the first detection were fever and gastrointestinal disorders (GIDs). Each symptom appeared in patients with viral loads ≈2 log10 higher and positive sgRNA in the case of fever. In contrast, dysgeusia was associated with lower NVL in the 2nd detection.
Significant Associations Between Normalized SARS-CoV-2 Viral Loads and Subgenomic RNA With Categorical Variables in the Total Study Population
| Symptom | Variable | Statistic | Total | No | Yes | P Value |
|---|---|---|---|---|---|---|
| Fever | n | n | 81 | 58 | 23 | .002 |
| Log10 NVLa—1st RT-PCR | Median (IQR) | 3.6 (2.14–5.09) | 3.19 (2.08–4.54) | 5.18 (2.71–5.8) | ||
| Positive sgRNA | n (%) | 43 (51.2%) | 26 (46.6%) | 17 (73.9%) | .011 | |
| Negative sgRNA | n (%) | 41 (48.8%) | 35 (57.4%) | 6 (26.1%) | ||
| GID | n | n | 81 | 65 | 17 | .007 |
| Log10 NVLa—1st RT-PCR | Median (IQR) | 3.6 (2.14–5.09) | 3.2 (2.08–4.79) | 5.03 (3.26–5.82) | ||
| Positive sgRNA | n (%) | 43 (51.2%) | 31 (46.3%) | 12 (70.6%) | .073 | |
| Negative sgRNA | n (%) | 41 (48.8%) | 36 (53.7%) | 5 (29.4%) | ||
| Dysgeusia | n | n | 84 | 58 | 26 | .006 |
| Log10 NVLa—2nd RT-PCR | Median (IQR) | 1.88 (1.26–2.39) | 2.04 (1.56–2.51) | 1.44 (0.81–1.91) | ||
| Positive sgRNA | n (%) | 5 (6%) | 5 (8.6%) | 0 (0%) | .318 | |
| Negative sgRNA | N (%) | 79 (94%) | 53 (91.4%) | 26 (100%) |
Abbreviations: GID, gastrointestinal disorders; IQR, interquartile range; n, number of samples; NVL, normalized viral loads; RT-PCR, reverse-transcription polymerase chain reaction; SARS-CoV-2, severe acute respiratory syndrome coronavirus 2; sgRNA, subgenomic RNA.
aLog10 RNA copies/1000 cells.
NOTE: P values obtained from the Mann-Whitney test. P < .05 are indicated in bold.
Discussion
This study presents 2 tools for improving clinical decision making and work reincorporation after SARS-CoV-2 infection: (1) NVLs that provide robust and precise SARS-CoV-2 RNA measurements that overcome Ct values and respiratory sample collection variations; and (2) sgRNA as a possible surrogate marker of active viral replication, because it presented a significant association with NVL and days after symptom onset.
The Ct values have been used as a prognostic indicator for clinical decision making [15]; however, they could vary significantly between and within methods [16]. The College of American Pathologists surveyed more than 700 laboratories and demonstrated that different methods using identical control material varied by as much as 14.0 cycles and by up to 12.0 cycle differences within a single gene target using a single method [17]. Therefore, Ct values do not have a linear relation with viral loads, and the dispersion of the measurements is understated. The use of reference standard curves is recommended to calibrate every target and primer/probe design to provide accurate viral load determination for patient follow-up.
Nasopharyngeal/throat swabs also have an intrinsic variability that depends on the operator and the tolerance of the patients [18]. Therefore, swab collection quality of every sample must be checked to avoid false-negative results and provide reliable values. Our results demonstrate that NVLs showed robust and similar quantities of SARS-CoV-2 of the N and RdRp genes at 2 different timepoints of the infection in 84 HCWs. Normalization overcame the limitations of Ct value and sample collection variability, providing more accurate values that can guide the monitoring of patients and treatment management.
The gold standard to determine viral infective capacity is viral culture; however, this requires high biosafety laboratories, fresh samples, and long time for response. Severe acute respiratory syndrome coronavirus 2 culture and sgRNA have been used to detect replication-competent virus longitudinally in respiratory samples [12], presenting a high association between the 2 techniques [19].
Our study aimed to determine the potential utility of sgRNA for monitoring actively replicating virus in the context of HCWs to improve work reincorporation policies. Our findings showed sgRNA was mainly detectable in specimens collected ≤7 days after symptom onset. This result is in correlation with several culture studies describing SARS-CoV-2 culture recovery from respiratory specimens obtained 1–9 days after onset in patients with mild to moderate disease [20, 21]. Our results also showed that after 7 days of symptoms only 7 patients presented sgRNA, indicating that a reduction of isolation protocols should be evaluated to ensure adherence and to vacate COVID-19 hospital isolation rooms.
Subgenomic RNA was also compared with Ct values and NVLs obtained by RT-PCR standardized for the N and RdRp genes. Both genes were tested simultaneously together with the cellular quantification by multiplex RT-PCR always using the same procedure and thermocycler. This explains why sgRNA results significantly correlated with Ct values in this assay and should be standardized in every laboratory before using. To achieve less sample and technique variability, it is more optimal to use NVLs. Considering the significant association between samples with ≥4 log10 RNA copies being sgRNA-positive and <1 log10 being sgRNA-negative, a viral load cut point between 1 and 3 log10 RNA copies/1000 cells could be set to request sgRNA detection.
A correlation between chest x-rays, comorbidities, or serology with NVLs or sgRNA has not previously been reported, but our multivariant analysis showed they are not significantly correlated. Our results confirmed that fever and GID are the only 2 clinical parameters associated with higher viral loads and replication-competent virus (sgRNA positivity) in the case of fever. Furthermore, dysgeusia is likely to be a delayed symptom associated with lower copies of the virus and a tendency to less replicative capacity. No other COVID-19-related symptoms, gender, or age were significantly correlated with SARS-CoV-2 viral load, in accordance with previous reports [15].
In spite of satisfactory sgRNA results, further viral culture studies are required to verify the association of sgRNA with viral replicative capacity and to define the timing of infectivity. In addition, the study population analyzed was not wide enough and did not include immunocompromised or severely ill patients, in whom NVL and sgRNA should be tested to improve patient monitoring and infection control in the hospital setting, and to verify treatment efficacy.
Conclusions
Normalized viral loads and sgRNA detection are 2 rapid and accessible techniques that can be easily implemented in routine hospital practice, providing a useful proxy for infectivity and patient follow-up. These tools can overcome the obstacles of Ct values, inadequately used in clinical specimens to establish criteria for active infection and transmission, the costs of high biosafety laboratory equipment and long-term of response limitation of viral culture. Subgenomic RNA RT-PCR can provide essential information for safe work reincorporation of infected workers, patient assessment, discontinuing isolation precautions, and optimization of vaccines and treatment approaches.
Supplementary Data
Supplementary materials are available at The Journal of Infectious Diseases online. Supplementary materials consist of data provided by the author that are published to benefit the reader. The posted materials are not copyedited. The contents of all supplementary data are the sole responsibility of the authors. Questions or messages regarding errors should be addressed to the author.
Notes
Presented in part: ECCVID Conference of Coronavirus Disease (oral session), September 23–25, 2020. https://www.escmid.org/fileadmin/src/media/PDFs/1Dates_Events/ECCVID/TOP_abstracts/Abstract_00504.pdf
Acknowledgments. We thank Albert Gabarrus from the Fundació Clínic per la Recerca Biomèdica (FCRB), Hospital Clínic of Barcelona (Spain) for his contribution to statistical analysis and Donna Pringle for her contribution to English language editing.
Potential conflicts of interest. All authors: no reported conflicts. All authors have submitted the ICMJE Form for Disclosure of Conflicts of Interest.

