


Abstract
Inflammation persists among persons with human immunodeficiency virus (PWH) despite effective antiretroviral therapy and may contribute to T-cell dysfunction. Alcohol use is prevalent among PWH and promotes intestinal leak, dysbiosis, and a proinflammatory milieu. Whether alcohol use is associated with T-cell late differentiation remains to be investigated.
Data and samples from PWH (N = 359 of 365) enrolled in the New Orleans Alcohol Use in HIV Study were used. Alcohol use was assessed by self-report (Alcohol Use Disorders Identification Test; lifetime alcohol exposure; 30-day Alcohol Timeline Followback) and phosphatidylethanol (PEth) quantitation. In a subset of participants, fecal bacterial content was assessed by ribosomal 16S marker gene deep sequencing and quantitative polymerase chain reaction. Intestinal leak was assessed by fecal-to-plasma α-1-antitrypsin (A1AT) enzyme-linked immunosorbent assay ratio. Peripheral T-cell populations were quantified by flow cytometry.
Alcohol Use Disorder Identification Test scores were positively associated with activated-senescent, exhausted, and terminal effector memory CD45RA+CD8+ but not CD4+ T cells (cells/μL) after confounder adjustment (P < .050). Phosphatidylethanol was positively associated with A1AT (P < .050). The PEth and activated-senescent CD8+ were associated with bacterial β-diversity (P < .050) and positively associated with the relative abundance of coabundant Prevotellaceae members (q < .100).
Alcohol use among PWH is associated with CD8+ T-cell late differentiation, intestinal leak, and dysbiosis. Alcohol-associated dysbiosis is implicated in CD8+ T-cell senescence.
Despite suppression of circulating virus with antiretroviral therapy (ART), elevated levels of inflammatory mediators have been observed among persons with human immunodeficiency virus (PWH) compared with the general population [1]. This persistent inflammatory state likely contributes to cellular senescence and increases the risk for geriatric comorbidity such as cardiovascular disease, osteoporosis, and cancer [1, 2]. In the era of effective ART, health behaviors may occupy a greater role in precocious aging in PWH. Among these, alcohol use is prevalent within the PWH population [3] and is associated with end-organ damage, immune dysfunction [4], and ultimately frailty [5, 6].
The gastrointestinal mucosa is an early target of human immunodeficiency virus (HIV). Human immunodeficiency virus infection diminishes the integrity of the intestinal epithelial barrier, promoting leak of microbial products to distant host tissues [7]. Byproducts, such as lipopolysaccharide, are broadly inflammatory and stimulate T-cell activation and HLA-DR/CD38 surface expression [8, 9]. Chronic activation leads to T-cell exhaustion and/or senescence [10, 11]. Intestinal dysbiosis, a state of altered composition and function of the gut microbiota, has been identified among PWH [12] and may directly contribute to immune cell activation [13]. In preclinical and human studies, alcohol exposure induces epithelial leak, translocation of microbial products, and dysbiosis [14–16]. Behavioral factors, such as male-male sexual preference, have also been linked to dysbiosis and immune activation among PWH [17].
Previous work in rhesus macaques showed that chronic binge alcohol administration (CBA) activates CD8+ T cells and increases proliferation in the intestinal mucosa [18]. In simian immunodeficiency virus-infected primates, CBA increases senescent CD8+ T cells, potentially due to replicative expansion [18]. Translating these finding to PWH, Alcohol Use Disorders Identification Test (AUDIT) scores positively correlated with activated-senescent CD8+ T cells in a small pilot study [18].
Considering that, among PWH, intestinal inflammatory signaling may accelerate T-cell differentiation, we proposed a model in which alcohol use and associated intestinal dysbiosis increases translocation of microbial products, leading to mucosal T-cell activation and replicative senescence [19]. Senescent T cells may then directly contribute to systemic inflammatory signaling [20], defective host defense [21], and multimorbidity and frailty in PWH.
This study tested the hypothesis that alcohol exposure among PWH is positively associated with absolute numbers of late-differentiated CD8+ or CD4+ T cells and inversely with naive cells. We further tested the hypothesis that alcohol use positively associates with intestinal leak and dysbiosis. In post hoc analyses, we explored associations between leak, dysbiosis, and T cells. Based on these results, we selected 2 structural equations to identify potential mediators of alcohol-associated CD8+ senescence.
MATERIALS AND METHODS
Study Participants
Participants were enrollees of the New Orleans Alcohol Use in HIV (NOAH) Study baseline sample, as previously described [6, 19]. In brief, NOAH consists of PWH in-care at HIV outpatient clinics. Inclusion criteria were age ≥18 years and documented HIV seropositive status. Exclusion criteria were acute illness in preceding 6 weeks, pregnancy, or alcohol intoxication at time of study visit. Participation was permitted after resolution of exclusion criteria. All participants provided written informed consent in accordance with LSU Health Sciences Center-New Orleans Institutional Review Board approval.
Alcohol and Other Substance Use Assessments
Risk for an alcohol use disorder (AUD) was assessed by the AUDIT [22]. Lifetime total-grams alcohol exposure (LAE) and 30-day exposure were determined by self-report using a modified Lifetime Drinking History and the Alcohol Timeline Followback (TLFB), respectively, as described previously [6]. Phosphatidylethanol (PEth) was measured as a recent alcohol exposure biomarker [23] from dried, whole-blood spots as described [6].
Current smoke-tobacco use and pack-years were collected. Days in the past month and total years of other substance use were assessed using the Addiction Severity Index, as previously reported [6].
Viral Load and T Cells
Plasma HIV viral load and whole blood CD4+ and CD8+ T-cell absolute concentrations were quantified by the University Medical Center Laboratory Services (New Orleans, LA).
Peripheral Blood Mononuclear Cell Collection and Immunophenotyping
Peripheral blood mononuclear cells (PBMCs) were harvested from whole blood by Ficoll-Paque Plus centrifugation (GE Healthcare no. 17-1440-03, Chicago, IL). Peripheral blood mononuclear cells were washed 3 times in RPMI before cryopreservation in Cryo-Safe media.
Frozen PBMCs were thawed at 37°C before antibody staining for cell surface markers and live/dead. Cells were paraformaldehyde-fixed before flow cytometry quantitation on the LSRII platform (BD Immunocytometry Systems, San Jose, CA).
Activated, activated-senescence, exhausted, terminal effector memory cells re-expressing CD45RA (TEMRA), and naive CD8+ T cells were gated as CD3+CD8+CD4−CD38+HLADR+, CD3+CD8+CD4−CD38+HLADR+CD28−, CD3+CD8+ CD4−CD28−PD-1+TIGIT+, CD3+CD8+CD4−CD45RA+CCR7− CD28−CD95+, and CD3+CD8+CD4−CD45RA+CCR7+CD28+CD95−, respectively, and activated, effector memory, TEMRA, and naive CD4+ T cells were gated as CD3+CD8−CD4+CD38+HLADR+, CD3+CD8−CD4+CCR7−CD45RA−, CD3+CD8−CD4+CD45RA+CCR7−CD28−CD95+, and CD3+CD8−CD4+CCR7+CD45RA+, respectively, in FACSDiva by the Analytical Laboratory Core of the LSUHSC Comprehensive Alcohol Research Center.
Absolute cells/microliter were calculated from the product between the percentage of target T-cell count to parent CD8+ or CD4+ T-cell count in PBMCs and the aforementioned absolute CD8+ or CD4+ T-cell concentrations measured in whole blood.
Fecal Sample Collection
All participants were provided with a stool collection kit with visual and printed instructions. Fecal samples were frozen at or below −20°C until processing. Frozen samples were thawed at 4°C and homogenized in ice-cold phosphate-buffered saline (PBS) by vortex at a 1-gram to 2-mL feces-to-PBS ratio. Macroscopic particles were removed by single-ply gauze filtering before aliquoting and cryopreservation at −80°C.
Intestinal Barrier Compromise
Intestinal epithelial injury was assessed by intestinal fatty acid-binding protein (iFABP) [24] enzyme-linked immunosorbent assay (ELISA) (no. HK406; Hycult Biotech, Ugden, Netherlands) in plasma samples diluted 1:2 with provided diluent before plating onto capture 96-well plates. The primary measure of intestinal leak was fecal α-1-antitrypsin (A1AT) protein [24] normalized to plasma levels. α-1-antitrypsin was measured by ELISA (Bethyl Laboratories, Montgomery, TX) in fecal and plasma samples diluted 1:12 500 [25] and 1:300 000, respectively. Leak was secondarily assessed by soluble CD14 (sCD14) ELISA (no. HK320; Hycult Biotech) in plasma samples diluted 1:350. Optical density was measured on an xMark Microplate Absorbance Spectrophotometer (Bio-Rad, Hercules, CA). Marker concentrations were calculated by logistic regression on a 5-point standard curve using Microplate Manager Software v6 (Bio-Rad) or the drc R package.
Fecal Microbiota Characterization
Thawed aliquots of fecal samples were bead-homogenized for 4 minutes before RNase treatment and deoxyribonucleic acid (DNA) purification via the DNA Stool Miniprep (QIAGEN). The ribosomal 16S V4 hypervariable region was amplified by polymerase chain reaction (PCR) from purified, equimolar DNA using the modified-515F/806R [26, 27] primers. Deep sequencing was performed on the Illumina MiSeq V2 platform. Raw sequences are available under PRJNA604280 in the NCBI Sequence Read Archive database.
Sequenced 16S amplicons were trimmed of primers using cutadapt and denoised into amplicon sequence variants (ASV) using DADA2 [28]. The ASVs were taxonomically classified to the genus level using IDTAXA [29] and the SILVA SSU r132 database [30].
Total bacterial burden was estimated using quantitative PCR (qPCR) with previously published U16SRT-F/-R primers [31]. Real-time qPCR was performed by Bio-Rad CFX-96 using the SsoAdvanced Universal SYBR mastermix (Bio-Rad). Standard curves were generated on each qPCR plate by serial dilution of a synthetic Escherichia coli 16S DNA standard (Integrated DNA Technologies, Coralville, IA) (Supplementary File 1).
Statistical Analysis
Two sets of covariates (a base and extended set) were tested to assess the influence of confounding variables. In the base model, adjustments were made for chronological age, body mass index, self-reported sex, African American race, male-male sexual preference, ART adherence >90% of doses, detectable HIV viral load (>20 copies/mL), hepatitis C coinfection, and antibiotic use in the preceding 4 months. Extended models adjusted for the base model covariates plus current smoke-tobacco use, pack-years, days of substance use in the past month, and total years of substance use [6]. In extended models where alcohol variables were not predictors of interest, the TLFB and LAE variables were added as potential confounders. Random-effect terms were specified for plate-to-plate batch effects.
The Generalized Additive Models of Location, Scale, and Shape [32] gamlss package in the R statistical environment was used throughout this work. Only the location parameter was modeled against covariates. Positive-skew distributions were specified for nonnegative outcome variables. Likelihood ratio test P values were reported.
Significant association between covariates and Generalized UniFrac [33] distances was tested by permutational analysis of variance via PermanovaG in GUniFrac using 100 000 permutations. Sequencing depth was modeled as a covariate. PermanovaG omnibus test P values were reported [33].
A coabundance network of bacterial genera was generated by Sparse Inverse Co-variance Estimation for Ecological Association Inference [34] and Weighted Gene Correlation Network Analysis [35]. Geometric Mean of Pairwise Ratios (GMPR) [36] normalization was performed before module clustering.
Significant associations between covariates, bacterial genera, and coabundant genera relative abundances were identified using the DESeq2 [37] likelihood-ratio test and quantreg quantile regression, respectively in R. Geometric mean of pairwise ratio size-factors were used in DESeq2.
Structural equation modeling of β-diversity was performed using MedTest [38]. Tests of simple mediation were performed via non-parametric, bias-corrected bootstrap [39]. P < .050 or Benjamini and Hochberg false discovery rate [40] q < .100 were considered statistically significant. See the Supplementary Methods for additional information.
RESULTS
Cohort Summary and Characteristics
Alcohol use data and whole blood samples were cocollected in 359 of 365 participants within the NOAH Study [19]. This subset comprises primarily virally suppressed, middle-aged African American males who exhibited a relatively high ART adherence rate (Table 1). A majority of males reported a sexual preference for men (Table 1).
Cohort Summary: New Orleans Alcohol Use in HIV Study
| Female (N = 108) | Male (N = 251) | Total (N = 359) | |||||
|---|---|---|---|---|---|---|---|
| Variable | Median or % | IQR | Median or % | IQR | Median or % | IQR | P a |
| Demographic | |||||||
| Age (years) | 50 | 14 | 51 | 15 | 51 | 15 | .707 |
| African American race, % | 87 | 82 | 84 | .357 | |||
| MSM, % | 51 | 36 | .662 | ||||
| Body mass index (kg/m2) | 29 | 10 | 25 | 7 | 26 | 7 | <.001 |
| HIV | |||||||
| Viral loadb (copies/mL) | 0 | 59 | 0 | 39 | 0 | 45 | .539 |
| <20, % | 67 | 70 | 69 | .759 | |||
| 20–200, % | 13 | 16 | 15 | .653 | |||
| 200–1 000 000, % | 20 | 14 | 16 | .281 | |||
| ART adherence > 90%, % | 81 | 86 | 84 | .400 | |||
| Hepatitis C coinfection, % | 20 | 16 | 17 | .386 | |||
| Recent antibiotic usec, % | 37 | 22 | 26 | .004 | |||
| Alcohol Use | |||||||
| AUDIT (score) | 4 | 11 | 7 | 11 | 6 | 11 | .004 |
| Lifetime (g) | 62 179 | 291 802 | 213 955 | 470 016 | 174 298 | 435 826 | <.001 |
| 30-day (g) | 84 | 399 | 224 | 915 | 168 | 754 | .004 |
| PEthd (ng/μL, N = 352) | 14 | 89 | 49 | 240 | 34 | 179 | <.001 |
| Smoke-Tobacco Use | |||||||
| Current, % | 52 | 64 | 60 | .038 | |||
| Pack-years in ever smokers | 7 | 18 | 9 | 20 | 8 | 20 | .039 |
| Other Substance Use | |||||||
| 30-day (days) | 0 | 9 | 0 | 6 | 0 | 6 | .662 |
| Lifetime (years) | 16 | 33 | 16 | 27 | 16 | 31 | .557 |
| CD8+ T Cells (cells/μL, N = 335) | |||||||
| Total | 683 | 404 | 759 | 422 | 730 | 429 | .115 |
| Naive | 157 | 128 | 139 | 127 | 144 | 129 | .752 |
| Activated | 28 | 22 | 27 | 34 | 28 | 30 | .890 |
| Activated-senescent | 13 | 17 | 13 | 21 | 13 | 20 | .508 |
| Exhausted | 4 | 8 | 3 | 8 | 3 | 8 | .441 |
| TEMRA | 71 | 63 | 62 | 69 | 64 | 65 | .954 |
| CD4+ T cells (cells/μL) | |||||||
| Total | 548 | 378 | 484 | 340 | 505 | 365 | .456 |
| Naive | 161 | 165 | 152 | 180 | 156 | 178 | .635 |
| Activated | 9 | 7 | 9 | 7 | 9 | 7 | .410 |
| Effector memory | 217 | 154 | 191 | 132 | 199 | 142 | .187 |
| TEMRA | 1 | 4 | 1 | 4 | 1 | 4 | .996 |
| Gut Injury/Leak | |||||||
| iFABP (pg/mL) | 688 | 916 | 876 | 790 | 841 | 819 | .062 |
| A1AT (fecal/plasma, N = 261) | 1.4 × 10⁻⁶ | 1.7 × 10⁻⁶ | 1.3 × 10⁻⁶ | 1.5 × 10⁻⁶ | 1.3 × 10⁻⁶ | 1.5 × 10⁻⁶ | .362 |
| sCD14 (ng/mL) | 3553 | 2996 | 3432 | 2931 | 3467 | 2967 | .476 |
Abbreviations: A1AT, α-1-antitrypsin; ART, antiretroviral therapy; AUDIT, Alcohol Use Disorder Identification Test; iFABP, intestinal fatty acid-binding protein; HIV, human immunodeficiency virus; IQR, interquartile range; MSM, men who have sex with men; PEth, phosphatidylethanol; sCD14, soluble CD14; TEMRA, terminal effector memory cell re-expressing CD45RA.
aWilcoxon signed-rank or χ 2 test P values where variables were tested for association with sex. Bold indicates P < .050.
bValues beneath the limit of detection (<20 copies/mL) were set to zero.
cUsed in the preceding 4 months.
dValues beneath the limit of detection (<8 ng/μL) were set to zero.
In general, alcohol and smoke-tobacco use were significantly greater among males than females. Peripheral T-cell and intestinal injury or leak levels were similar across sex (Table 1). No alcohol use variable was significantly associated with detectable viral load (P > .130, data not shown).
Alcohol Use Among Persons With Human Immunodeficiency Virus Is Associated With CD8+ but Not CD4+ T-Cell Populations
Alcohol use disorder identification test scores were positively associated with activated-senescent CD8+ T-cell levels in the extended (β = 0.014, P = .015) covariate model and exhausted and TEMRA CD8+ in the base [(β = 0.026, P = .001) and (β = 0.011, P = .014)] and extended (β = 0.034, P < .001) and (β = 0.012, P = .013)] models (Table 2).
Alcohol Use Is Associated With Peripheral CD8+ or CD4+ T-Cell Populations (Cells/μL) Among Persons With HIV: The New Orleans Alcohol Use in HIV Studya
| Base | Extended | |||||
|---|---|---|---|---|---|---|
| Exposure | T Cell | Outcome | β | P | β | P |
| AUDIT | ||||||
| CD8 | ||||||
| Naive | −0.001 | .829 | −0.002 | .664 | ||
| Activated | 0.004 | .388 | 0.006 | .152 | ||
| Activated-senescent | 0.010 | .068 | 0.014 | .015 | ||
| Exhausted | 0.026 | .001 | 0.034 | <.001 | ||
| TEMRA | 0.011 | .014 | 0.012 | .013 | ||
| CD4 | ||||||
| Naive | 0.001 | .862 | <.001 | .990 | ||
| Activated | 0.002 | .579 | 0.003 | .539 | ||
| Effector memory | −0.003 | .391 | −0.005 | .220 | ||
| TEMRA | 0.002 | .849 | <.001 | .992 | ||
| LAE | ||||||
| CD8 | ||||||
| Naive | 0.001 | .366 | 0.001 | .689 | ||
| Activated | −0.001 | .629 | 0.001 | .421 | ||
| Activated-senescent | −0.001 | .562 | 0.001 | .520 | ||
| Exhausted | 0.004 | .116 | 0.010 | <.001 | ||
| TEMRA | 0.001 | .463 | 0.001 | .539 | ||
| CD4 | ||||||
| Naive | <.001 | .842 | −0.001 | .827 | ||
| Activated | 0.001 | .347 | 0.002 | .186 | ||
| Effector memory | <.001 | .870 | −0.001 | .615 | ||
| TEMRA | −0.001 | .709 | −0.003 | .433 | ||
| TLFB | ||||||
| CD8 | ||||||
| Naive | −0.010 | .489 | −0.020 | .183 | ||
| Activated | 0.003 | .793 | −0.002 | .866 | ||
| Activated-senescent | 0.015 | .358 | 0.014 | .403 | ||
| Exhausted | 0.039 | .149 | 0.025 | .345 | ||
| TEMRA | 0.003 | .840 | 0.005 | .730 | ||
| CD4 | ||||||
| Naive | 0.006 | .762 | −0.011 | .626 | ||
| Activated | −0.007 | .587 | −0.016 | .232 | ||
| Effector Memory | −0.013 | .249 | −0.016 | .162 | ||
| TEMRA | 0.030 | .357 | 0.027 | .434 | ||
| PEth | ||||||
| CD8 | ||||||
| Naive | −0.017 | .309 | −0.023 | .170 | ||
| Activated | 0.020 | .170 | 0.010 | .480 | ||
| Activated-senescent | 0.047 | .010 | 0.039 | .034 | ||
| Exhausted | 0.084 | .005 | 0.061 | .042 | ||
| TEMRA | 0.007 | .650 | 0.009 | .603 | ||
| CD4 | ||||||
| Naive | 0.026 | .283 | 0.021 | .407 | ||
| Activated | 0.006 | .696 | 0.001 | .955 | ||
| Effector memory | −0.007 | .588 | −0.007 | .595 | ||
| TEMRA | 0.024 | .524 | 0.028 | .459 | ||
Abbreviations: AUDIT, Alcohol Use Disorder Identification Test; HIV, human immunodeficiency virus; LAE, lifetime alcohol exposure; PEth, phosphatidylethanol; TEMRA, terminal effector memory cell re-expressing CD45RA; TLFB, 30-day Alcohol Timeline Followback.
aLifetime alcohol exposure, 30-day TLFB, and PEth were rank-, loge(x + 1)-, and loge(x + 1)-transformed, respectively, before statistical linear modeling as predictors. T-cell outcome variables were positively translated by their minimum, nonzero observed value before modeling. TLFB and LAE were modeled together as covariates. PEth and LAE were modeled as covariates in separate models. Lifetime Alcohol Exposure associations made in the former model are presented. Statistically significant slope (β)-coefficients (P < .050) between exposures and T-cell subtypes are in bold. Complete cases ranged from N = 323–332.
In a separate analysis, rank-percentile LAE and loge 30-day total-grams alcohol exposure as measured by TLFB were modeled as covariates. Lifetime total-grams alcohol exposure was positively associated with exhausted CD8+ T cells in the extended (β = 0.010, P ≤ .001) model (Table 2). The TLFB failed to associate with any CD8+ T-cell population (Table 2).
In a repeat analysis, TLFB was replaced by PEth concentration. Phosphatidylethanol was positively associated with activated-senescent and exhausted CD8+ in the base (β = 0.047, P = .010 and β = 0.084, P = .005) and extended (β = 0.039, P = .034 and β = 0.061, P = .042) models (Table 2). Naive and activated CD8+ and each CD4+ T-cell population were not significantly associated with alcohol exposure (Table 2).
Among participants with undetectable HIV, AUDIT was positively associated with exhausted CD8+ T cell in the base (β = 0.024, P = .010) and extended (β = 0.030, P = .002) models (Supplementary Table 1). The LAE and PEth were positively associated with exhausted CD8+ in the extended (β = 0.012, P = .001) and base (β = 0.071, P = .036) models, respectively (Supplementary Table 1). Phosphatidylethanol was positively associated with activated-senescent CD8+ T cells in the base (β = 0.043, P = .034) model (Supplementary Table 1). No associations were observed among those with detectable HIV (Supplementary Table 1).
Alcohol Use and T Cells in Persons With Human Immunodeficiency Virus Are Associated With Intestinal Injury and Leak
Increasing TLFB was inversely associated with plasma iFABP concentration in the base (β = −0.029, P = .043) model (Table 3). Phosphatidylethanol was positively associated with fecal-to-plasma A1AT ratio in the base (β = 0.035, P = .016) and extended (β = 0.039, P = .012) models (Table 3). Alcohol Use Disorders Identification Test and LAE were not significantly associated with intestinal injury or leak markers (Table 3).
Alcohol Use Is Associated With Circulating Markers of Gut Injury and Leak Among Persons With HIV: The New Orleans Alcohol Use in HIV Studya
| Base | Extended | ||||
|---|---|---|---|---|---|
| Exposure | Marker | β | P | β | P |
| AUDIT | |||||
| iFABP | 0.003 | .645 | 0.001 | .838 | |
| A1AT | −0.001 | .840 | −0.001 | .887 | |
| sCD14 | 0.001 | .822 | 0.002 | .781 | |
| LAE | |||||
| iFABP | 0.001 | .461 | 0.001 | .639 | |
| A1AT | −0.001 | .331 | −0.002 | .323 | |
| sCD14 | −0.001 | .297 | −0.001 | .335 | |
| TLFB | |||||
| iFABP | −0.029 | .043 | −0.026 | .075 | |
| A1AT | 0.013 | .327 | 0.015 | .292 | |
| sCD14 | 0.002 | .894 | 0.003 | .881 | |
| PEth | |||||
| iFABP | −0.020 | .260 | −0.021 | .242 | |
| A1AT | 0.035 | .016 | 0.039 | .012 | |
| sCD14 | 0.012 | .338 | 0.011 | .391 | |
Abbreviations: A1AT: α-1-antitrypsin fecal-to-plasma ratio; AUDIT, Alcohol Use Disorder Identification Test; HIV, human immunodeficiency virus; iFABP, intestinal fatty acid-binding protein; LAE, lifetime alcohol exposure; PEth, phosphatidylethanol; sCD14, soluble CD14; TLFB, 30-day Alcohol Timeline Followback.
aLifetime alcohol exposure, 30-day TLFB, and PEth were rank-, loge(x + 1)-, and loge(x + 1)-transformed, respectively, before statistical linear modeling as predictors. TLFB and LAE were modeled together as covariates. PEth and LAE were also modeled as covariates in separate models. LAE associations made in the former model are presented. Statistically significant slope (β)-coefficients (P < .050) between exposures and gut injury or leak marker levels are in bold. Complete cases ranged from N = 250–352.
Naive CD8+ T cells were inversely associated with sCD14 levels in the base (β = −0.073, P = .023) and extended (β = −0.069, P = .034) models, whereas activated CD8+ were positively associated with sCD14 in the base (β = 0.081, P = .046) and extended (β = 0.081, P = .049) models (Supplementary Table 2).
Naive CD4+ T cells were positively associated with A1AT levels in the base (β = 0.075, P = .015) and extended (β = 0.074, P = .019) models and inversely associated with sCD14 in the base (β = −0.042, P = .041) and extended (β = −0.043, P = .040) models (Supplementary Table 2). Effector memory CD4+ were inversely associated with sCD14 in the base (β = −0.089, P = .022) and extended (β = −0.083, P = .032) models (Supplementary Table 2). No other T-cell population was significantly associated with intestinal injury or leak markers (Supplementary Table 2).
Alcohol Use and T Cells but Not Intestinal Injury or Leak Are Associated With Changes in Intestinal Bacterial Community Structure
No alcohol use measure was significantly associated with fecal bacterial burden as estimated by qPCR in the base and extended models (Table 4). In contrast, activated and activated-senescent CD8+ T-cell levels were positively associated with fecal bacterial burden in the base (β = 0.246, P = .014 and β = 0.227, P = .006) and extended (β = 0.224, P = .026 and β = 0.217, P = .008) models (Supplementary Table 3). Activated CD4+ T cells were positively associated with bacterial burden in the base (β = 0.270, P = .012) and extended (β = 0.294, P = .007) models (Supplementary Table 3).
Alcohol Use Is Associated With Fecal Bacterial Dysbiosis Among Persons With HIV: The New Orleans Alcohol Use in HIV Study
| Base | Extended | ||||
|---|---|---|---|---|---|
| Exposure | Marker | β or Fmax | P | β or Fmax | P |
| AUDIT | |||||
| Bacterial burden | 0.009 | .193 | 0.009 | .225 | |
| α-diversitya | 0.005 | .070 | 0.005 | .100 | |
| β-diversityb | 2.211 | .094 | 2.218 | .081 | |
| LAE | |||||
| Bacterial burden | −0.004 | .234 | −0.004 | .150 | |
| α-diversity | 0.001 | .117 | 0.001 | .211 | |
| β-diversity | 1.685 | .204 | 1.034 | .594 | |
| TLFB | |||||
| Bacterial burden | 0.041 | .094 | 0.046 | .073 | |
| α-diversity | −0.002 | .837 | 0.001 | .926 | |
| β-diversity | 1.921 | .041 | 1.576 | .121 | |
| PEth | |||||
| Bacterial burden | 0.042 | .138 | 0.036 | .242 | |
| α-diversity | <.001 | .997 | 0.002 | .825 | |
| β-diversity | 3.539 | .003 | 2.988 | .007 | |
Abbreviations: AUDIT, alcohol use disorder identification test; HIV, human immunodeficiency virus; LAE, lifetime alcohol exposure; PEth, phosphatidylethanol; TLFB, 30-day Alcohol Timeline Followback.
NOTES: Lifetime alcohol exposure, 30-day TLFB, and PEth were rank-, loge(x + 1)-, and loge(x + 1)-transformed, respectively, before statistical linear modeling as predictors. TLFB and LAE were modeled together as covariates. PEth and LAE were modeled as covariates in separate models. LAE associations made in the former model are presented. Sequencing depth was accounted for as a covariate in α- and β-diversity regression models. Statistically significant slope (β)-coefficients (P < .050) between exposures and bacterial burden or α-diversity are bolded. Statistically significant F-statistics (omnibus P < .050) between exposures and β-diversity are bolded. Fmax is the largest F statistic factored into the PermanovaG omnibus test of Generalized UniFrac-estimated β-diversity. Complete cases ranged from N = 247–261.
aα-diversity is the estimated total number of unique 16S amplicon sequence variants in a sample.
bβ-diversity is the between-sample difference in phylogenetic composition.
Fecal bacterial α- and β-diversities were assessed by ribosomal 16S marker gene deep sequencing. Fecal α-diversity was estimated as the total number of denoised, unique sequence variants observed per sample. No alcohol exposure or T-cell population was significantly associated with fecal α-diversity (Table 4 and Supplementary Table 3).
Fecal bacterial β-diversity, a measure of between-sample dissimilarity in phylogenetic composition, was estimated by the Generalized UniFrac distance metric between all pairs of samples. Phosphatidylethanol concentration, activated-senescent CD8+, and effector memory CD4+ T cells were significantly associated with β-diversity in the base (Fmax = 3.539, P = .003, Fmax = 2.863, P = .023, and Fmax = 3.536, P = .011, respectively) and extended (Fmax = 2.988, P = .007, Fmax = 2.984, P = .019, and Fmax = 3.268, P = .014, respectively) models (Table 4 and Supplementary Table 3). The TLFB and naive CD4+ were also associated with β-diversity in the base (Fmax = 1.921, P = .041) and extended (Fmax = 2.549, P = .042) models, respectively (Table 4 and Supplementary Table 3).
Finally, sCD14 was significantly associated with bacterial β-diversity in the base (Fmax = 4.169, P = .004) and extended (Fmax = 3.907, P = .007) models (Supplementary Table 4). No other alcohol, T-cell, intestinal injury, or leak variable was significantly associated with intestinal bacterial β-diversity (Table 4 and Supplementary Tables 3 and 4).
Alcohol Use, T Cells, Intestinal Injury, and Leak Among Persons With Human Immunodeficiency Virus Are Associated With the Relative Abundance of Coabundant Genus-Level Subcommunities
Bacterial genera were clustered into groups or modules according to their tendency to be positively associated with each other. In total, 14 modules ranging in size from 2 to 11 members were identified, comprising a network of inferred positive coabundance relationships (Figure 1A).
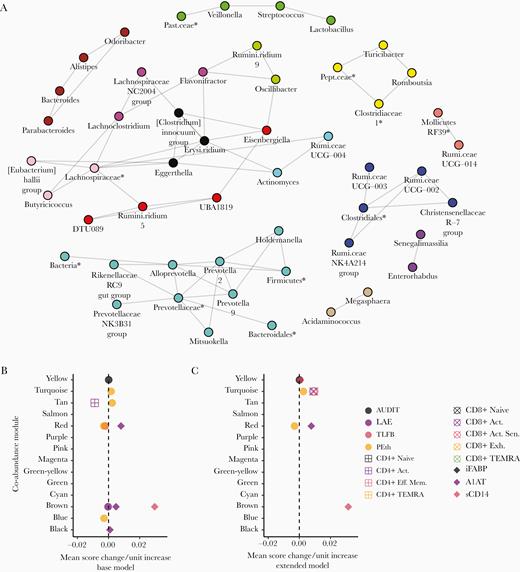
Modular, coabundant bacterial genera are associated with alcohol use, T-cell populations, intestinal injury, and leak; the New Orleans Alcohol Use in HIV Study. (A) A coabundance network of positively-associated bacterial genera inferred by Sparse Inverse Covariance Estimation for Ecological Association Inference is plotted above. Individual modules detected by Weighted-gene Co-abundance Network Analysis are indicated by colors. (B and C) The associations between bacterial genus-level module abundance scores and participant Alcohol Use Disorder Identification Test (AUDIT) score, lifetime alcohol exposure (LAE), 30-day total-grams Alcohol Timeline Followback (TLFB), whole blood phosphatidylethanol (PEth) concentration, activated (Act.), activated-senescent (Act. Sen.), exhausted (Exh.), terminal effector memory (Eff. Mem.) re-expressing CD45RA (TEMRA), Eff. Mem. T-cell levels, intestinal fatty acid-binding protein (iFABP), α-1-antitrypsin (A1AT) fecal-to-plasma ratio, and soluble CD14 (sCD14) are plotted above. Each point represents the magnitude of the slope between a unit change in predictor variable and the mean 1st principle component score of a module of bacterial genera. Each slope value was adjusted for the base (B) or extended (C) covariate models. Only associations meeting statistical significance after multiple comparisons adjustment by false discovery rate are plotted (q < .100). Expanded result tables are provided in Supplementary File 2. *, Amplicon sequence variants lacking a reliable genus assignment are labeled with the nearest reliable taxon. Erysi.ridium, Erysipelatoclostridium; Past.ceae, Pasteurellaceae; Pept.ceae, Peptostreptococcaceae; Rumi.ceae, Ruminococcaceae; Rumini.ridium, Ruminiclostridium.
Alcohol use disorder identification test score was significantly (q < .100) positively associated with the relative abundance score of the yellow module, consisting of Turicibacter, Romboutsia, Clostridiaceae-1, and an unclassified Peptostreptococcaceae ASV, in the base and extended models (Figure 1B and C).
Lifetime total grams-alcohol exposure was inversely associated with the brown module, comprising Parabacteroides, Bacteroides, Alistipes, and Odoribacter genera, in the base model (Figure 1B). Phosphatidylethanol was positively associated with the turquoise module, consisting of the Alloprevotella, Prevotella-2, Prevotella-9, Prevotellaceae NK3B31 group, Holdemanella, Rikenellaceae RC9 gut group, and Mitsuokella genera and unclassified ASVs in the Prevotellaceae, Bacteroidales, Firmicutes, and Bacteria clades, in the base model (Figure 1A and B). Phosphatidylethanol, activated, and activated-senescent CD8+ T cells were all positively associated with the turquoise module in the extended model (Figure 1C).
Phosphatidylethanol was inversely associated with the red module, comprising Eisenbergiella,DTU089, Ruminiclostridium-5, and UBA1819, in both covariate models (Figure 1A–C). The red module was also positively associated with A1AT in both models and inversely with TLFB in the base model (Figure 1B and C).
Phosphatidylethanol was inversely associated with the blue module, which included the Ruminococcaceae UCG-003, UCG-002, NK4A214 group, and Christensenellaceae R-7 group genera as well as an ASV in the Clostridiales family, in the base model (Figure 1A and B).
Phosphatidylethanol was positively associated and activated CD4+ T cells were inversely associated with the tan module, comprising the Acidaminococcus and Megasphaera, in the base model (Figure 1A and B). α-1-antitrypsin was positively associated with the brown and black module, which consisted of Clostridium innocuum, Erysipelatoclostridium, and Eggerthella, in the base model (Figure 1A and B).
Soluble CD14 level was positively associated with the yellow module in the extended model and the brown module in both models (Figure 1B and C). Tests of association with the individual relative abundances of bacterial genera revealed similar associations with alcohol, T cells, and markers of gut injury and leak as above (Supplementary Figure 1 and File 3).
Intestinal Bacterial Dysbiosis Accounts for Recent Alcohol Use-Associated Increases in Activated-Senescent CD8+ T Cells
β-diversity and the abundance score of the Prevotellaceae-dominated, turquoise module were each associated with both PEth and activated-senescent CD8+ T-cell levels. In post-hoc analyses, β-diversity and the turquoise module were tested as mediators of the positive association between PEth and activated-senescent CD8+ T-cell levels. Both were found to be significant mediators in the extended (P = .043 and 95% confidence interval <.001–0.016, respectively; data not shown) covariate model only.
DISCUSSION
In this study, we investigated the potential association between alcohol exposure and markers of T-cell dysfunction among PWH. We used diverse alcohol measures to capture the breadth of observable alcohol use behavior. In the NOAH baseline cohort, these measures correlate incompletely with each other [41], offering information on distinct exposure domains.
These domains were more discretely defined by their differing associations with peripheral T-cell populations. It is notable that increasing risk for an AUD as measured by the AUDIT was uniquely associated with higher levels of activated-senescent, exhausted, and TEMRA CD8+ T cells. The AUDIT is a composite index of quantity/frequency alcohol exposure and AUD-related psychosocial symptoms. Although latent correlation with LAE or PEth might explain the association with activated-senescent and exhausted CD8+ T cells, TEMRA CD8+ were exclusively associated with the AUDIT, potentially reflecting a correlation between this subtype and clinical symptoms of AUD. The AUDIT appears to associate with TEMRA CD8+ in the general population as well [42]. Additional studies are needed to link TEMRA CD8+ T cells to the pathogenesis of substance use disorders. CD8+ TEMRA engage in the proinflammatory senescence-associated secretory phenotype [20], and a role for peripheral immune activation has been proposed in the psychopathology of AUD [43].
Increasing LAE was associated with greater exhausted CD8+ T-cell levels after adjustment for recent alcohol use. These data suggest a potential role for accumulated alcohol exposure in pathological changes to the CD8+ T-cell compartment. If distant-past exposure influences CD8+ T-cell differentiation later in life, then intervention in excess of simple alcohol cessation, such as PD-1 receptor blockade, may be necessary to fully restore immune cell homeostasis in PWH with a history of lifelong alcohol use [44].
Recent alcohol use as measured by the TLFB failed to associate with T cells in contrast to PEth. Cumulative, short-term alcohol use may lack the efficiency of an endogenous biomarker, such as PEth, to model other endogenous phenomena subject to individual host physiology.
After omitting participants with a detectable HIV viral load, a subset of the associations observed between AUDIT, LAE, and PEth and CD8+ T cells persisted. These results link alcohol use to greater CD8+ T-cell late differentiation among PWH who are virally suppressed.
No alcohol use measure was significantly associated with peripheral CD4+ T-cell levels. This finding is supported indirectly by previous studies. In rhesus macaques, alcohol induces greater turnover in intestinal CD8+ T cells over CD4+ [45], which may translate in PWH who consume alcohol to a propensity for CD8+ T-cell late differentiation over CD4+. Moreover, in vitro HLA-DR and CD38 surface coexpression is greater on CD8+ T cells compared with CD4+ in response to lipopolysaccharide challenge [9]. Future study is needed to sufficiently rule out alcohol-associated changes in CD4+ T cells.
Participant PEth was positively associated with the A1AT fecal-to-plasma ratio, suggesting that intestinal barrier compromise may accompany recent alcohol use. In contrast, iFABP and sCD14 levels failed to positively associate with any alcohol use measure. This may be explained, in part, by a faster clearance rate of plasma markers [44] relative to fecal A1AT, which is stabilized by intrinsic antiprotease activity [24] and the comparatively slower excretion rate of human feces. However, no consistent association was observed between A1AT and the tested T-cell populations. These findings suggest that increasing intestinal injury or leak alone may be insufficient to exacerbate CD8+ late differentiation, pointing to a potentially critical role for intestinal dysbiosis in the development of these changes.
Both PEth and activated-senescent CD8+ levels were significantly associated with fecal bacterial β-diversity after covariate adjustment, which included men who have sex with men (MSM) status. Moreover, both were positively associated with coabundant members of the Prevotellaceae bacterial family after adjustment. Prevotella species are elevated in relative abundance in the intestinal microbiota of PWH over HIV-uninfected controls [46] and particularly so among MSM [17]. Prevotella have also been shown to positively correlate with the number of colonic activated CD8+ T cells [13] in PWH, and Prevotella metabolites induce HIV proliferation from infected CD4+ T cells in vitro [47]. Whether products of Prevotella metabolism exert a deleterious effect (ie, senescence induction) on CD8+ T cells remains to be tested. The exploratory mediation analyses performed herein offer some evidence in support of a model whereby alcohol-associated relative expansion in intestinal Prevotella exacerbates peripheral CD8+ T-cell senescence.
The findings presented in this work are subject to limitations. T-cell populations were defined by cell-surface markers as opposed to functional parameters, such as cell replicative capacity or the senescence-associated secretory phenotype [20]. Intestinal injury and leak may be directly measured via urinary detection of orally administered, nonabsorbable agents [48]. Intestinal dysbiosis may be more specifically defined by measurement of in vitro T-cell response to anaerobically subcultured fecal samples. In addition, controlling for hepatitis C virus viral load, other chronic viral infections (ie, cytomegalovirus), differences in diet, and ART regimen would strengthen these analyses. Finally, previous work has shown that alcoholic cirrhosis is associated with intestinal dysbiosis [49]. The results presented in this work did not account for differences in liver function although the effect of liver disease may be limited to the naive T-cell population [42].
CONCLUSIONS
In summary, alcohol use among PWH is associated with markers of CD8+ T-cell late differentiation, intestinal leak, and dysbiosis. Whether targeted reversal of alcohol-associated dysbiosis restores CD8+ T-cell homeostasis warrants further investigation. We suspect that control of CD8+ T-cell late differentiation would ameliorate the risk for HIV-related geriatric comorbidities and improve HIV outcomes.
Supplementary Data
Supplementary materials are available at The Journal of Infectious Diseases online. Consisting of data provided by the authors to benefit the reader, the posted materials are not copyedited and are the sole responsibility of the authors, so questions or comments should be addressed to the corresponding author.
Notes
Acknowledgments. We are indebted to the faculty, staff, and participants of the New Orleans Alcohol Use in HIV Study without whom this work would not be possible.
Financial support. This work was funded by the National Institute on Alcohol Abuse and Alcoholism (P60AA009803, R21AA027199, T32AA007577, and F30AA026527) and National Institute of General Medical Sciences (U54GM104940).
Potential conflicts of interest. All authors: No reported conflicts of interest. All authors have submitted the ICMJE Form for Disclosure of Potential Conflicts of Interest.
Presented in part: Gordon Research Conference on Alcohol-induced End Organ Diseases, March 2019, Ventura, CA.
References

