


Abstract
Identifying people with HIV (PWH) at risk for chronic kidney disease, cardiovascular events, and death is crucial. We evaluated biomarkers to predict all-cause mortality and cardiovascular events, and measured glomerular filtration rate (mGFR) slope.
Biomarkers were measured at enrollment. Baseline and 5-year mGFR were measured by plasma iohexol clearance. Outcomes were a composite criterion of all-cause mortality and/or cardiovascular events, and mGFR slope.
Of 168 subjects, 146 (87.4%) had undetectable HIV load. Median follow-up was 59.1 months (interquartile range, 56.2–62.1). At baseline, mean age was 49.5 years (± 9.8) and mean mGFR 98.9 mL/min/1.73m2 (± 20.6). Seventeen deaths and 10 cardiovascular events occurred during 5-year follow-up. Baseline mGFR was not associated with mortality/cardiovascular events. In multivariable analysis, cystatin C (hazard ratio [HR], 5.978; 95% confidence interval [CI], 2.774–12.88; P < .0001) and urine albumin to creatinine ratio (uACR) at inclusion (HR, 1.002; 95% CI, 1.001–1.004; P < .001) were associated with mortality/cardiovascular events. Area under receiver operating curve of cystatin C was 0.67 (95% CI, .55–.79) for mortality/cardiovascular event prediction. Biomarkers were not associated with GFR slope.
uACR and cystatin C predict all-cause mortality and/or cardiovascular events in PWH independently of mGFR.
Antiretroviral therapies (ART) have dramatically reduced mortality due to human immunodeficiency virus (HIV) infection that progressed to a long-term chronic illness for the majority of patients. Thus, the prevention and treatment of comorbidities have come to the forefront in the care of persons with HIV (PWH). It was estimated, from the national Dutch ATHENA cohort, that in 2030 around one-third of HIV-positive patients will have at least 3 comorbidities [1]. In another study, HIV-positive patients had a significantly higher mean number of age-associated noncommunicable comorbidities compared to HIV-negative controls [2]. Among these comorbidities, chronic kidney disease (CKD) is significantly more prevalent in PWH than in HIV-negative individuals [2]. The prevalence of CKD in PWH ranges from 1% to 48% among different cohorts, the greatest prevalence being observed among black Africans [3]. There is a large spectrum of CKD in PWH, including specific and nonspecific HIV-related causes. Specific causes have been described, such as HIV-associated nephropathies (HIVAN; particularly in patient with at-risk alleles of apolipoprotein-1 [APOL-1]), HIV-immune complex diseases, and ART-related nephrotoxicity [4]. Nonspecific causes are mainly represented by diabetic nephropathy, hepatitis C virus-related glomerulopathies, cyoglobulinemia, nephroangiosclerosis, and other conditions [5]. With the frequent use of ART, the spectrum of CKD in PWH is changing with a decrease in the incidence of HIVAN [6, 7]. CKD is associated with poor outcomes in PWH. Deterioration in renal function (ie, decrease in estimated glomerular filtration rate [GFR]) is associated with an increase in mortality and morbidity in PWH due to AIDS and non-AIDS events [8, 9].
Early diagnosis of CKD in PWH is crucial but challenging [4]. Various kidney biomarkers have been evaluated to predict GFR decline, cardiovascular events, and all-cause mortality in the general population and in PWH [4]. In PWH, kidney injury molecule-1 (KIM-1), neutrophil gelatinase associated lipocalin (NGAL), and α-1-microglobulin (α1m) were evaluated in PWH to predict CKD [10]. Increased level of serum cystatin C, urinary interleukin-18 (IL-18), NGAL, N-acetyl-β-d-glucosaminidase (NAG), KIM-1, liver fatty acid-binding protein, and albuminuria were also associated with all-cause mortality in PWH [11, 12]. Most of the studies were conducted in the United States and included high proportions of African Americans and of women [10, 12]. Serum cystatin C has also been evaluated for GFR estimation in PWH [13, 14]. Nephrocheck (a composite of 2 proteins, tissue metalloproteinase inhibitor 2 and IGF-binding protein 7) is considered to be a highly promising biomarker to predict acute kidney injury and outcomes [15]. Data on Nephrocheck for predicting adverse events in chronic medical conditions are scarce. However, TIMP2 and IGFBP7 elevations in acute kidney injury are probably due to increased filtration, decreased tubule reabsorption, and proximal tubule cell leakage [16]. Due to the high proportion of tubular lesions in PWH, we hypothesized that Nephrocheck may be an interesting biomarker to predict GFR decline in PWH and adverse outcomes.
We hypothesized that kidney biomarkers—serum cystatin C, urine albumin to creatinine ratio (uACR), NAG, KIM-1, IL-18, α1m, and Nephrocheck—may predict all-cause mortality and/or cardiovascular events and GFR decline in a PWH cohort of mainly European descent. Our primary objective was to evaluate kidney biomarkers to predict all-cause mortality and/or cardiovascular events in PWH. Our secondary objective was to evaluate biomarkers to predict decline in GFR. As GFR estimates lack accuracy in PWH, we obtained measured GFR (mGFR) with a gold standard method, that is plasma iohexol clearance [14].
METHODS
Study Population
Subjects were recruited from the Department of Infectious Diseases of the University Hospital of Saint-Etienne, France, between 2010 and 2012. Eligible subjects were >18 years old with confirmed HIV status. Exclusion criteria were pregnancy, history of iohexol allergy, thyroid dysfunction, recent acute kidney injury (≤3 months), and current treatment with metformin, steroids, trimethoprim, or cimetidine.
GFR Measurement
GFR measurements were based on plasma clearance of iohexol (Omnipaque 300; GE Healthcare) at inclusion and after 5 years. After administration of 10 mL iohexol intravenously, 2 blood samples were collected at approximately 120 and 240 minutes with exact time recorded. Iohexol plasma concentration was determined by high performance liquid chromatography and mass spectrometry [17]. GFR was calculated using a previously described protocol [18]. Measured GFR was reported in relation to body surface area, as estimated by the Du Bois and Du Bois formula [19].
Biological Investigations
Blood and urine samples were collected at enrollment and stored at −80°C for measurement of biomarkers. Serum creatinine was measured by isotope-dilution mass spectrometry traceable enzymatic method (Orthoclinical Diagnostics; coefficient of variation [CV], 5.6% at 0.71 mg/dL and 2.1% at 5.82 mg/dL). Serum cystatin C was measured by the International Federation of Clinical Chemistry traceable nephelometric method with a Siemens BN Prospec analyzer (CV, 2.9% at 1.03 mg/L and 2.1% at 1.93 mg/L). Urine microalbumin was determined by immunonephelometry with a Siemens BN ProSpec (sensitivity was 0.16 mg/dL with interassay CV, 3.0%). KIM-1 and IL-18 were measured by enzyme-linked immunosorbent assay (ELISA; R&D Systems; CV <8%). NAG was measured by a colorimetric method (Sigma-Aldrich; CV, <5%). α1m was measured by immunonephelometry (Vista). Nephrocheck was measured with the Astute Medical automated system. Plasma HIV was determined by Abbott Diagnostics m2000 RealTime HIV-1 Assay at inclusion. CD4+ lymphocytes count was measured by flow cytometry at inclusion.
Data Collection
Clinical variables collected at the time of GFR measurement were: sex, age, height, weight, time since HIV diagnosis, history of injecting drug use, smoking status, history of hypertension, dyslipidemia and/or diabetes mellitus, highly active ART regimen, hepatitis B virus and hepatitis C virus status, liver cirrhosis, and antiretroviral regimen. In the study, diabetes mellitus was defined as a diagnosis prior to the study or use of oral antidiabetic agents or insulin at the time of enrollment. Hypertension was defined as systolic blood pressure >140 mmHg, diastolic blood pressure >90 mmHg at 2 consecutive medical visits, or the use of antihypertensive agents. Dyslipidemia was defined as triglycerides greater than 2 g/L or use of fibrates at the time of enrollment, or low-density lipoprotein-cholesterol greater than 1.60 g/L, or use of statins at the time of enrollment. Cardiovascular events and death were obtained from the electronic medical record. People are seen in our HIV clinic at least twice a year; a research assistant collects information at each visit. If the subject was lost to follow-up, their general practitioner was approached to collect information as in routine practice in the center.
Outcomes
The primary outcome was a composite criterion that included all-cause mortality and/or a cardiovascular events. Secondary outcomes were evolution of mGFR during follow-up (GFR slope) and occurrence of CKD stage 5.
Statistical Analysis
Cox proportional hazard regression was used to examine associations between biomarkers levels with all-cause mortality and cardiovascular events (myocardial infarction, stroke). Covariates from the baseline included age, mGFR, smoking, intravenous drug use, body mass index, sex, diabetes mellitus, hypertension, hepatitis B and hepatitis C coinfection, liver cirrhosis, dyslipidemia, lymphocytes CD4+ count, exposure to tenofovir disoproxil fumarate, protease inhibitors, and highly sensitive C-reactive protein. HIV load was not considered in the model as it was expected that few subjects had a detectable HIV load. All covariates with a P < .15 in univariate analysis were integrated in the multivariate analysis. Covariance analysis (ANCOVA) was performed to evaluate the interaction between cystatin C and GFR. Receiver operating curves were constructed for biomarkers associated in multivariate analysis with the primary outcome. Simple and multiple linear regression analyses were performed to evaluate the association between factors and biomarkers with GFR slope. All statistical analyses were performed with R software and the package pROC.
RESULTS
Ethics
The protocol was submitted to and approved by the Comité de Protection des Personnes Sud-Est 1. The study was conducted in full compliance with the amended declaration of Helsinki following approval from the local ethical committee. All subjects provided signed informed consent for participation in this study.
Baseline Characteristics of the Study Population
Among the 247 subjects who underwent a GFR measurement at inclusion, 168 (68%) were considered in this analysis; 23 eligible subjects declined to participate in the study, 27 were not asked to enroll in the study by their referring physician, 27 moved to another center, and 2 were lost to follow-up. The baseline characteristics of the subjects are given in Table 1. Mean age was 49.5 (±9.8) years at baseline, 137 subjects (81%) were male, HIV load was undetectable in 146 (87.5%), and mean CD4+ lymphocyte count was 607 cells/mm3 (± 273). Mean mGFR was 98.9 mL/min/1.73m2 (± 27.5) and 10 (6%) subjects had a mGFR below 60 mL/min/1.73 m2. Median proteinuria was 115 mg/g (interquartile range [IQR], 73–184 mg/g), and median albuminuria was 10.3 mg/g (IQR, 5.8–20.7 mg/g). Thirty-three subjects (19.6%) had a uACR greater than 30 mg/g and 5 (3%) had a uACR greater than 300 mg/g, defining macroalbuminuria. Median follow-up duration was 59.1 months (IQR, 56.2–62.1 months).
Baseline Characteristics of the Study Participants
| Baseline Characteristic | Value (n = 168) |
|---|---|
| Age, y, mean (± SD) | 49.5 (± 9.8) |
| Female | 31 (18.5) |
| African origin | 8 (4.8) |
| Diabetes mellitus | 8 (4.8) |
| Hypertension | 30 (17.8) |
| Dyslipidemiaa | 52 (31.1) |
| Smoker | 62 (37.1) |
| Current exposure to TDF | 93 (55.7) |
| Undetectable HIV loadb | 146 (87.4) |
| CD4+ lymphocyte counts, cells/mm3, mean (± SD) | 607 (± 273) |
| HBV coinfection | 9 (5.4) |
| HCV coinfection | 15 (9) |
| Highly sensitive CRP > 5 mg/L | 30 (17.9) |
| Microalbuminuria, mg/L, mean (± SD) | 36 (± 122.9) |
| uPCR, mg/g, median (IQR) | 115 (73–184) |
| uACR, mg/g, median (IQR) | 10.3 (5.8–20.7) |
| Classification of uACR | |
| <30 | 135 (80.8) |
| 30–300 | 28 (16.7) |
| 300–1000 | 3 (1.8) |
| >1000 | 2 (1.2) |
| Serum creatinine, µmol/L, mean (± SD) | 77.3 (± 16.1) |
| Cystatin C, mg/L, mean (± SD) | 0.88 (± 0.29) |
| Measured GFR, mL/min/1.73m2, mean (± SD) | 98.9 (± 27.5) |
| Classification of GFR, mL/min/1.73m2 | |
| ≥ 90 | 104 (62.3) |
| <60 to ≤ 89 | 46 (27.5) |
| <30 to ≤ 59 | 8 (4.8) |
| <15 to ≤ 29 | 2 (1.2) |
| Hyperfiltration, GFR > 120 mL/min/1.73m2 | 30 (18) |
| Median follow-up, mo, median (IQR) | 59.1 (56.2–62.1) |
Categorical variables are No. (%); continuous variables are mean (± SD) if the distribution was normal and median (IQR) if the distribution was not normal.
Abbreviations: CRP, C-reactive protein; GFR, glomerular filtration rate; HBV, hepatitis B virus; HCV, hepatitis C virus; HIV, human immunodeficiency virus; TDF, tenofovir disoproxil fumarate; uACR, urine albumin to creatinine ratio; uPCR, urine protein to creatinine ratio.
aDyslipidemia defined as cholesterol total >2 g/L, or HDL cholesterol <0.4 g/L, low-density lipoprotein-cholesterol <1.6 g/L, triglycerides >1.5 g/L, or statin use.
bUndetectable HIV load = HIV load < 40 copies/mL.
Prediction of All-Cause Mortality and Cardiovascular Events in PWH by Biomarkers
During the follow-up period, 25 subjects (14.8%) died and/or experienced a cardiovascular event. Seventeen (10.1%) subjects died; 11 deaths were cancer related, 2 deaths were infection related, 2 deaths were due to a cardiovascular event, and 2 deaths were of unknown cause. During the follow-up period, 10 subjects experienced a cardiovascular event (4 myocardial infarctions and 6 strokes). One subject initiated renal replacement therapy.
Factors and biomarkers associated with all-cause mortality and cardiovascular events are given in Table 2 from univariate and multivariate analyses. In univariate analysis, age, uACR, cystatin C, and intravenous drug use were significantly associated with outcomes, with respective hazard ratios (HR) 1.05 (95% confidence intervals [CI], 1.01–1.1), 1.002 (95% CI, 1.001–1.003), 4.16 (95% CI, 2.26–7.65), and 32.9 (95% CI, 3.8–281). In a multivariable model (with age, smoking status, intravenous drug use, dyslipidemia, liver cirrhosis, and KIM-1 in the model), cystatin C remained associated with the composite outcome, with adjusted HR 5.98 (95% CI, 2.77–12.88; P < .001), and uACR remained associated with the composite outcome, with HR 1.002 (95% CI, 1.001–1.004; P < .001). NAG, KIM-1, α1m, and Nephrocheck were not associated with the outcome. To determine if the association of cystatin C with the outcome was independent of mGFR as cystatin C is strongly correlated to GFR, a covariance analysis was performed with cystatin C, mGFR, and the interaction element cystatin C:mGFR. A second analysis was performed after adjustment for age, intravenous drug use (narcotics), smoking status, dyslipidemia, and KIM-1. Cystatin C remained strongly associated with outcome, with HR 12.28 (95% CI, 2.78–54.2; P < .001), as shown in Table 3.
Factors and Markers Associated With All-Cause Mortality and Cardiovascular Events (Uni- and Multivariate Cox Proportional Hazard Models)
| Univariate Analysis | Multivariate Analysis | |||||
|---|---|---|---|---|---|---|
| Factor | HR | 95% CI | P | aHR | 95% CI | P |
| Age | 1.05 | 1.01–1.1 | .02 | 1.03 | .97–1.09 | .33 |
| Measured GFR | 1.01 | .98–1.04 | .58 | |||
| uACR | 1.00 | 1.00–1.01 | <.001 | 1.00 | 1.00–1.01 | <.001 |
| Cystatin C | 4.16 | 2.26–7.65 | <.001 | 5.98 | 2.77–12.88 | <.001 |
| NAG | 1.04 | .99–1.12 | .27 | |||
| KIM-1 | 1.28 | .95–1.72 | .11 | 1.22 | .92–1.62 | .17 |
| α1m | 0.999 | .987–1.012 | .93 | |||
| IL-18 | 1.00 | .98–1.01 | .86 | |||
| Nephrocheck | 0.81 | .33–2.01 | .66 | |||
| Smoker | 2.03 | .89–4.6 | .09 | 2.83 | 1.1–7.27 | .03 |
| IVDU | 32.9 | 3.8–281 | .001 | 22.39 | 1.04–483 | .05 |
| Female | 0.71 | .21–2.4 | .58 | |||
| Diabetes mellitus | 2.56 | .6–11 | .2 | |||
| Hypertension | 1.87 | .79–4.43 | .15 | |||
| Dyslipidemia | 2.03 | .89–4.64 | .09 | 1.57 | .5–4.99 | .44 |
| CD4 count | 1.00 | .99–1.01 | .42 | |||
| HBV coinfection | 0.81 | .1–6.0 | .83 | |||
| HCV coinfection | 0.33 | .05–2.47 | .28 | |||
| Liver cirrhosis | 4.2 | .98–18 | .05 | 2.12 | .25–18.2 | .49 |
| Length of TDF exposure | 1 | .99–1.00 | .59 | |||
| hsCRP | 0.89 | .6–1.3 | .56 |
All covariates with a P value <.15 in univariate analysis were considered in the multivariate analysis.
Significant values are in bold.
Abbreviations: aHR, adjusted hazard ratio; α1m, α-1-microglobulin; CI, confidence interval; GFR, glomerular filtration rate; HBV, hepatitis B virus; HCV, hepatitis C virus; hsCRP, highly sensitive C-reactive protein; HZ, hazard ratio; IL-18, interleukin-18; IVDU, intravenous drug use (narcotics); KIM-1, kidney injury molecule 1; NAG, N-acetyl-β-d-glucosaminidase; NGAL, neutrophil gelatinase associated lipocalin; TDF, tenofovir disoproxil fumarate; uACR, urine albumin to creatinine ratio.
Cox Models With Covariance Analysis, Unadjusted and Adjusted, to Explore the Prognostic Impact of GFR-Related and GFR-Independent Variability of Cystatin C
| Univariate Analysis | Multivariate Analysis | |||||
|---|---|---|---|---|---|---|
| Variable | HR | 95% CI | P | aHR | 95% CI | P |
| mGFR | 1 | .97–1.03 | .87 | 1.02 | .98–1.07 | .28 |
| Cystatin C | 3.8 | 1.1–12.99 | .03 | 12.28 | 2.78–54.2 | <.001 |
| mGFR:Cystatin C | 1.01 | .98–1.05 | .49 | 1.00 | .96–1.05 | .89 |
The multivariate model is a fully adjusted model with covariates in Table 2 retained: age, urine albumin to creatinine ratio, smoking, intravenous drug use, dyslipidemia, and cirrhosis.
Significant values are in bold.
Abbreviations: aHR, adjusted hazard ratio; CI, confidence interval; GFR, glomerular filtration rate; HR, hazard ratio; mGFR, measured glomerular filtration rate.
Receiver operating curves were constructed for cystatin C, Chronic Kidney Disease-Epidemiology Collaboration (CKD-EPI) cystatin C eGFR, uACR, and serum creatinine CKD-EPI eGFR (Figure 1). Areas under the curve for cystatin C, uACR, serum creatinine CKD-EPI eGFR, and serum cystatin C CKD-EPI eGFR were 0.67 (95% CI, .55–.79), 0.64 (95% CI, .51–.78), 0.49 (95% CI, .26–.72), and 0.69 (95% CI, .58–.80), respectively.
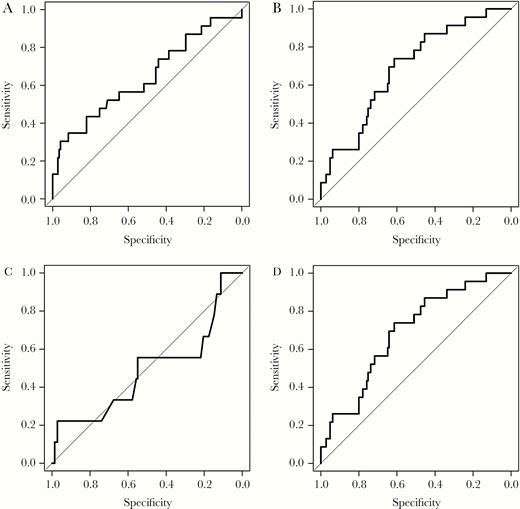
Receiver operating curves for prediction of all-cause mortality and cardiovascular events: (A) urine albumin to creatinine ratio AUC ROC 0.64 (95% CI, .51–.78); (B) cystatin C AUC ROC 0.67 (95% CI, .55–.79); (C) CKD-EPI serum creatinine AUC ROC 0.49 (95% CI, .26–.72); and (D) CKD-EPI cystatin C 0.69 (95% CI, .58–.80). Abbreviations: CI, confidence interval; AUC ROC, area under receiver operating curve; CKD-EPI, Chronic Kidney Disease Epidemiology Collaboration.
Prediction of mGFR Slope in PWH
Among the 168 subjects, a second mGFR was obtained in 154 subjects. Mean mGFR at inclusion was 98.7 mL/min/1.73m2 (± 27.5) and mean mGFR at the end of follow-up was 81.4 mL/min/1.73m2 (±18.4). Median annual mGFR slope was −3.14 mL/min/1.73m2 (IQR −5.97 to −1.18). Factors associated with mGFR slope are given in Table 4. In multivariate analysis after adjustment for diabetes mellitus, use of integrase strand transfer inhibitors, uACR, and Nephrocheck, only hypertension was associated with a mGFR slope of −2.07 mL/min/1.73 m2 per year (P = .04) and current tenofovir disoproxil fumarate (TDF) use remained associated with a decrease in mGFR with a slope of −2.38 mL/min/1.73m2 per year (P = .009). No biomarker was associated with mGFR slope.
Factors Associated With GFR Slope
| Univariate Analysis | Multivariate Analysis | |||||
|---|---|---|---|---|---|---|
| Factor | ß Coefficient | 95% CI | P | ß Coefficient | 95% CI | P |
| Age | −0.002 | −.09 to .09 | .95 | |||
| Diabetes mellitus | −3.63 | −7.84 to .58 | .09 | −3.08 | −7.24 to 1.08 | .14 |
| Hypertension | −2.28 | −4.22 to .35 | .02 | −2.07 | −4.06 to −.01 | .04 |
| CD4 nadir | −0.004 | −.009 to .001 | .13 | |||
| HBV coinfection | 0.42 | −3.28 to 4.13 | .82 | |||
| HCV coinfection | 1.38 | −1.17 to 3.94 | .29 | |||
| Current exposure to TDF | −2.76 | −4.42 to −1.11 | <.005 | −2.38 | −4.14 to −1.2 | .01 |
| Current exposure to INSTI | 1.84 | .17 to 3.52 | .03 | 0.62 | −1.2 to 2.43 | .5 |
| Exposure to protease inhibitors | 0.67 | −1.6 to 2.94 | .56 | |||
| Exposure to cobicistat | 1.63 | −.5 to 3.75 | .13 | |||
| NAG | 0.05 | −.14 to .24 | .63 | |||
| KIM-1 | 0.19 | −.71 to 1.1 | .67 | |||
| α1m | 0.01 | −.01 to .03 | .48 | |||
| IL-18 | 0.02 | −.02 to .06 | .31 | |||
| Nephrocheck | 1.57 | −.07 to 3.21 | .06 | 1.17 | −.44 to 2.78 | .15 |
| Cystatin C | −2.846 | −7.51 to 1.82 | .23 | |||
| uACR | 0.02 | −.003 to .03 | .1 | 0.01 | .00 to .01 | .49 |
Univariate linear regression, and multivariate linear regression with all covariates with P value <.15.
Significant values are in bold.
Abbreviations: α1m, α-1-microglobulin; CI, confidence interval; HBV, hepatitis B virus; HCV, hepatitis C virus; IL-18, interleukin-18; INSTI, integrase strand transfer inhibitor; KIM-1, kidney injury molecule 1; NAG, N-acetyl-β-d-glucosaminidase; TDF, tenofovir disoproxil fumarate; uACR, urine albumin to creatinine ratio.
DISCUSSION
We aimed to evaluate the ability of kidney biomarkers to predict death and/or cardiovascular events and mGFR slope in virologically suppressed PWH. As GFR estimates may lack accuracy in PWH and are not a gold standard method, GFR was measured [14]. In our study, cystatin C and uACR predicted all-cause mortality and cardiovascular events in PWH independently. To our knowledge, this study is the first to observe that these associations are independent of mGFR. In contrast, other kidney biomarkers (IL-18, NAG, KIM-1, and Nephrocheck) failed to predict all-cause mortality and cardiovascular events. Moreover, no biomarker was able to predict the decline in mGFR during the 5-year follow-up period. However, our study may suffer from the small sample size.
The predictive value of albuminuria for cardiovascular events has been previously observed in PWH [20]. The association between albuminuria and all-cause mortality has also been previously described, mainly in cohorts in the United States [11, 12, 21]. Even a low-range albuminuria has been found to be associated with cardiovascular events [22, 23]. In our cohort, 19.7% of the subjects exhibited microalbuminuria between 30 and 300 mg/g [24]. This prevalence is slightly higher than the 14.1% observed in another French cohort but the subjects in our study were older [25].
Cystatin C has been reported to be associated with all-cause mortality and particularly death due to cardiovascular diseases [26]. In the Fat Redistribution and Metabolic Change in HIV Infection study, association between cystatin C and 5-year mortality was also observed in PWH [11]. PWH with a GFR <60 mL/min/1.73m2 based on serum cystatin C had a risk of death of 2.4 per 100 patients over 5 years [11]. Since the first observations of an association between mortality and cystatin C [26]. Cystatin C seemed to predict mortality beyond GFR. In our study, cystatin C levels predicted mortality and/or cardiovascular events in PWH independently of mGFR. Cystatin C is produced by all nucleated cells and is freely filtered by the glomerulus and catabolized by tubular cells, and is associated with inflammatory markers [27]. Cystatin C might reflect inflammation and immune activation in PWH [27]. A correlation between inflammatory markers like IL-6, highly sensitive C-reactive protein, and tumor necrosis factor-α (TNF-α) and GFR estimated with both serum creatinine and cystatin C has been observed [28]. This was not observed with a GFR based on only creatinine, suggesting that the association was mainly due to an association between cystatin C and inflammation in PWH [28]. Cystatin C is probably a better marker of inflammation and predictor of mortality in PWH than a biomarker to estimate GFR. As HIV infection is a proinflammatory condition, the use of cystatin C to estimate GFR may lead to a GFR underestimation [13, 14, 28]. Moreover, cystatin C may be a more predictive marker than highly sensitive C-reactive protein in PWH as we did not observe any association between highly sensitive C-reactive protein and our composite outcome. Our results encourage the use of cystatin C as a prognostic marker to identify people at risk for cardiovascular events and deaths.
We did not observe an association between NAG, KIM-1, IL-18, Nephrocheck, and α1m and all-cause mortality and/or cardiovascular events. An association between IL-18, NGAL, KIM-1, and uACR and all-cause mortality was observed in univariate analysis in a cohort of 908 women in the US Women’s Interagency HIV Study (WIHS) [12]. After adjustment for age, ethnicity, risk factors for CKD, and HIV-related factors (HIV load and CD4 count), only the levels of IL-18 and uACR remained associated with all-cause mortality [12]. The investigators combined several biomarkers to increase the predictive value of these biomarkers and a cluster of 3 biomarkers (NAG, KIM-1, and α1m) was associated with all-cause mortality and end-stage renal disease [10]. Our study population differed from the WIHS cohort as we mainly enrolled men of European origin and 87% of them had an undetectable HIV load (close to World Health Organization objective of 90% of treated PWH with an undetectable HIV load). In the WIHS, 58% of the women were African American, 60% of the participants received antiretrovirals, and 31% had an undetectable HIV load [10, 12]. The prevalence of at-risk alleles of APOL-1 was probably higher in the WIHS cohort than in our study population, resulting in a higher proportion of subjects with hypertension and at risk of developing end-stage renal disease [29]. Moreover, our sample size was lower than in the WIHS.
We observed a median mGFR slope of −3.14 mL/min/1.73m2 per year in our study population, which can be considered to be a high value in subjects with normal GFR at baseline. It was higher than that observed in a Norwegian study in the general population (mean GFR slope −0.95 mL/min per year) and in an American study in PWH (mean GFR slope −1.94 mL/min/1.73m2 per year) [30, 31]. GFR slope is associated with an increased risk of end-stage renal disease and of mortality [32]. No evaluated biomarker predicted the decline in mGFR in our study. Only hypertension and TDF current use were associated with the GFR decline in our study. In a previous study in the WIHS cohort, the cluster including NAG, KIM-1, and α1m predicted chronic renal impairment, defined a by a cystatin C GFR under 60 mL/min/1.73 m2 [10]. In a recent study, uACR and α1m predict incident CKD in PWH whereas only uACR predict CKD in HIV-negative individuals defined by the CKD-EPI study equation [33]. We identified several explanations for discrepancies; first, eGFR decline was lower in this study (−1.42 mL/min/1.73 m2 per year) compared to that in ours [33]. Secondly, our study population was very different as subjects were mainly of European descents and more likely to be receiving highly active ART, thus our study population had characteristics closer to those of patients in European cohorts of PWH [34, 35]. Furthermore, in a recent French cohort, α1m was used to identify patients with proximal tubular dysfunction and the authors did not observe an association between proximal tubular dysfunction and GFR decline [25]. Both observations are concordant and do not argue for the use of NAG, KIM-1, α1m, and TIMP2/IGFBP7 to identify PWH at risk of renal impairment.
In conclusion, cystatin C and uACR predicted all-cause mortality and/or cardiovascular events in our population of PWH, who were mainly of European descents with undetectable viral load. Associations between cystatin C, uACR, and all-cause mortality and cardiovascular events were independent of mGFR. Cystatin C might be a useful biomarker in routine practice in PWH, probably reflecting inflammation and immune activation. Other biomarkers did not predict all-cause mortality and/or cardiovascular events and were not associated with the decline in GFR. Their relevance in routine clinical settings remains limited.
Notes
Financial support. This work was supported by the University Hospital of Saint-Etienne and by Astute Medical.
Potential conflicts of interest. All authors: No reported conflicts of interest. All authors have submitted the ICMJE Form for Disclosure of Potential Conflicts of Interest. Conflicts that the editors consider relevant to the content of the manuscript have been disclosed.

