


Abstract
The long-term clinical course of patients with an enterovirus central nervous system infection (ECI) is poorly understood.
We performed a nationwide population-based cohort study of all Danish patients with ECI diagnosed 1997–2016 (n = 1745) and a comparison cohort from the general population individually matched on date of birth and sex (n = 17 450). Outcomes were categorized into mortality and risk of cancer and likely measures of neurological sequelae: neuropsychiatric morbidities, educational landmarks, use of hospital services, employment, receipt of disability pension, income, number of sick leave days, and nursing home residency.
Mortality in the first year was higher among patients with ECI (mortality rate ratio [MRR] = 10.0; 95% confidence interval [CI], 4.17–24.1), but thereafter mortality was not higher (MMR = 0.94; 95% CI, 0.47–1.86). Long-term outcomes for patients with ECI were not inferior to those of the comparison cohort for risk of cancer, epilepsy, mental and behavioral disorders, dementia, depression, school start, school marks, high school education, use of hospital services, employment, receipt of disability pension, income, days of sick leave, or nursing home residency.
Diagnosis of an ECI had no substantial impact on long-term survival, health, or social/educational functioning.
Enterovirus is considered the most common pathogen of viral meningitis [1, 2]. Enterovirus infection generally causes asymptomatic or mild and self-limiting illness, but may lead to more severe disease, including meningoencephalitis, myelitis, paralysis, myocarditis, sepsis-like syndrome, respiratory disease, and acute hepatitis [1]. A recent UK cohort study focusing on patient-reported outcomes found that patients suffering from enterovirus meningitis had a lower quality of life at 1-year follow-up compared to both a group of healthy controls and with the estimated average quality of life in the UK [2]. Furthermore, case series of children with enterovirus A71-associated severe neurological diseases have demonstrated a poor prognosis [3–5]. However, existing studies on outcomes of enterovirus central nervous system (CNS) infection are hampered by small or highly selected study populations, inadequate follow-up, and lack of comparison cohorts [2–8]. Valid data on the long-term prognosis of an enterovirus CNS infection are needed by patients, their caregivers, and physicians.
METHODS
Data Sources
We used a population-based nationwide cohort design, as described previously [9–11]. Denmark has a population of approximately 5.8 million individuals [12]. Tax-supported health care is provided free of charge to all Danish residents [13]. The unique 10-digit personal identification number, assigned to all Danish residents at birth or upon immigration, was used to track individuals in Danish national health and administrative registries [13–23]. Data on enterovirus polymerase chain reaction (PCR) tests on cerebrospinal fluid (CSF) were extracted from data files obtained from all Danish microbiology laboratories that performed this test during the period 1 January 1997 to 1 March 2016. The comparison cohort was identified from the Danish Civil Registration System [19]. Additional medical and demographic data were extracted from the Danish Civil Registration System, the Danish National Patient Registry covering all Danish nonpsychiatric hospitals, the Danish Psychiatric Central Research Register covering all Danish psychiatric hospitals, the Danish Register of Causes of Death, the Danish Cancer Registry, the Employment Classification Module, the Personal Income Statistics database, and the Danish Educational Attainment Registry, and housing statistics from Statistics Denmark [13–23].
Study Population
Enterovirus CNS Infection Cohort
We included all patients in the enterovirus CNS infection cohort who had a positive PCR test for enterovirus in the CSF during the period 1 January 1997 to 1 March 2016, who were younger than 60 years and Danish residents at study inclusion. The age restriction was applied because very few cases occurred among individuals older than 60 years (Supplementary Figure 1). The date of study inclusion was defined as the first date of a positive PCR test for enterovirus in the CSF.
Comparison Cohort From the General Population
For each patient with enterovirus CNS infection, we identified all Danish residents who had not tested positive for enterovirus CNS infection and with the same sex and date of birth as the patient. From this group of persons, we extracted 10 individuals at random (Supplementary Figure 1). Persons in the comparison cohort were assigned the same date of study inclusion as the patient with an enterovirus CNS infection to whom they were matched.
Outcomes
Outcomes were classified into 3 main categories: (1) mortality and risk of cancer; (2) neuropsychiatric morbidities and educational performance as likely measures of damage to the CNS; and (3) other outcomes potentially related to cognitive decline or other sequelae. Neuropsychiatric morbidities and educational performance were subcategorized according to: (1) outcomes occurring in all age groups (epilepsy); (2) outcomes occurring in childhood and young adulthood (mental and behavioral disorders and educational performance); and (3) outcomes occurring among adults (dementia and depression). Other outcomes potentially related to cognitive decline or sequelae included hospitalization, rates of outpatient visits, employment, receipt of a disability pension, income, number of sick leave days, and nursing home residency. ICD-10 codes for neuropsychiatric morbidities are listed in Supplementary Table 1.
Statistical Analysis
We calculated time from date of study inclusion to 1 March 2016, death, emigration, loss to follow-up, or event of interest, whichever came first. Mortality rate ratios (MRRs) and incidence rate rations (IRRs) were calculated as measures of relative risk of mortality and morbidity. We made separate estimates for short-term (< 12 months) and long-term (≥ 12 months) mortality. We used Kaplan-Meier tables to compute the cumulative incidences of starting school at age 6 years and completing high school by age 25 years, as well as the cumulative incidences of death.
To evaluate school performance, we calculated proportions of individuals who obtained high grades in written mathematics and written Danish during the last year of primary school. For all persons in the patient and comparison cohorts, we also ascertained the yearly number of hospital inpatient days and outpatient hospital visits, as well as the proportion who had inpatient or outpatient contacts associated with a diagnosis of epilepsy. For patients aged 20 to 60 years at time of study inclusion, we further determined employment status, receipt of a disability pension, income, number of days of sick leave, nursing home residency, marital status, and number of children. Inclusion of study participants in these analyses started 8 years before date of study inclusion, birth, immigration, or start-up date of the registry recording the outcome of interest, and continued until the earliest of the following events: 8 years after study inclusion, 1 March 2016, death, emigration, or loss to follow-up. We calculated risk differences in each outcome between the patient and comparison cohorts, with 95% confidence intervals (CIs). For hospitalizations and use of outpatient services, we conducted sensitivity analyses excluding visits to departments of gynecology/obstetrics.
According to regulations stipulated for data obtained from Statistics Denmark, we were not allowed to report data on fewer than 3 individuals. Consequently, aggregated data on cause of death and age-stratified mortality were provided only if 3 or more individuals could be aggregated into 1 cell.
The study was approved by the Danish Data Protection Agency and the National Board of Health (RH-2015–285, I-Suite No.: 04297). SPSS Statistics, version 24 was used for analysis.
RESULTS
Characteristics of Members of the Study Cohorts
We identified 1745 patients with an enterovirus CNS infection who fulfilled the inclusion criteria and 17 450 persons for the comparison cohort. The median age was 25 years (Table 1). The age distribution was skewed, with 1 peak among children younger than 1 year and 1 peak among young adults 25 to 40 years of age (Supplementary Figure 2). Thirty patients who were aged 60 years or older when diagnosed with an enterovirus CNS infection were not included in the study. At time of study inclusion, patients with an enterovirus CNS infection who were aged between 20 and 60 years were more likely to have children and to be married than members of the comparison cohort (Figure 1A and Supplementary Figure 3).
Characteristics of Patients Younger Than 60 Years With Enterovirus CNS Infection and Members of the Comparison Cohort, Denmark, 1997–2016
| Characteristics | Patients with Enterovirus CNS Infection | Comparison Cohort |
|---|---|---|
| Total | 1745 | 17 450 |
| Male sex, No. (%) | 995 (57) | 9950 (57) |
| Age at study inclusion, median (IQR), y | 25 (4–33) | 25 (4–33) |
| Age categories, No. (%), y | ||
| 0–1 | 349 (20) | 3490 (20) |
| 1–20 | 416 (24) | 4160 (24) |
| 20–60 | 980 (56) | 9800 (56) |
| Danish origin, No. (%) | 1669 (96) | 15 860 (91) |
| Diagnosis before study inclusion, No. (%) | ||
| Cancer | 16 (0.9) | 87 (0.5) |
| Epilepsy | 31 (1.8) | 166 (1.0) |
| Dementia | 1 (0.1) | 1 (0.0) |
| Depression | 32 (1.8) | 221 (1.3) |
| F diagnosesa | 0 (0.0) | 0 (0.0) |
| Number of children before study inclusion, median (IQR)b | 1 (1–2) | 1 (0–2) |
| Proportion married the year of study inclusion, No. (%)b | 508 (52) | 3716 (38) |
| Total observation time, yc | 13 264 | 134 818 |
| Observation time, median (IQR), y | 5.8 (3.3–12.5) | 6.2 (3.3–12.6) |
| Died, No. (%)c | 19 (1.1) | 108 (0.6) |
| Emigrated, No. (%)c | 60 (3.4) | 477 (2.7) |
| Lost to follow-up, No. (%)c | 0 (0.0) | 10 (0.1) |
Abbreviations: CNS, central nervous system; IQR, interquartile range.
aRestricted to children younger than 1 year at study inclusion.
bRestricted to individuals aged 20–60 years at time of study inclusion.
cDuring follow-up starting from diagnosis of an enterovirus CNS infection.
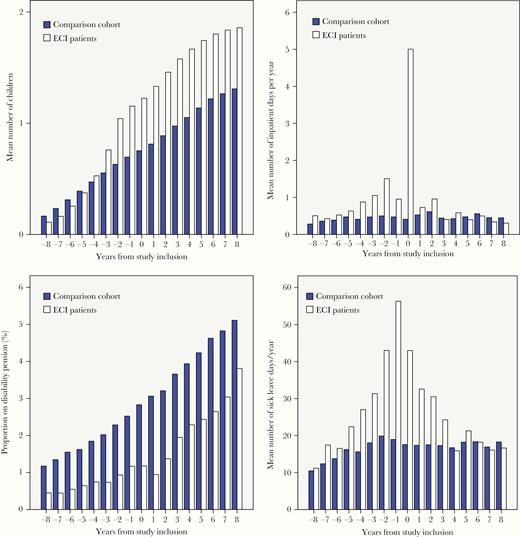
Number of children, days of inpatient hospitalizations, receipt of a disability pension, and days of sick leave in patients with an enterovirus CNS infection (ECI patients) and the comparison cohort. A, Mean number of children, persons aged 20 to 60 years at time of study inclusion, by years before and after study inclusion. B, Mean number of inpatient hospital days per year, persons aged 20–60 years at time of study inclusion, by years before and after study inclusion. C, Percentage of people aged 20–60 years at time of study inclusion on disability pension, by years before and after study inclusion. D, Mean number of sick leave days per year taken by persons aged 20–60 years at time of study inclusion, by years before and after study inclusion.
Mortality and Risk of Cancer
Nineteen patients with an enterovirus CNS infection and 108 persons in the comparison cohort died during follow-up: 10 patients and 98 members of the control cohort died within the first year (Table 1 and Table 2). During the first year of observation, patients who experienced an enterovirus CNS infection had an increased risk of death (MRR = 10.0; 95% CI, 4.17–24.1) (Table 2 and Figure 2A). One-year mortality was 0.6% (95% CI, .2%–.9%) among patients and 0.1% (95% CI, .0%–.1%) among members of the comparison cohort (risk difference in 1-year mortality = 0.5%; 95% CI, .2%–.9%). Four of the patients who died during the first year of observation were younger than 1 year at time of study inclusion, which equals a mortality within 1 year of 1.1% (4 of 349) among individuals younger than 1 year. After the first year of observation, patients with an enterovirus CNS infection did not have increased risk of death (MRR = 0.94; 95% CI, .47–1.86). Fifteen-year cumulative mortality was 1.5% (95% CI, .7%–2.3%) among patients with enterovirus CNS infection and 1.5% (95% CI, 1.2%–1.8%) among members of the comparison cohort (difference in 15-year mortality = 0.0%; 95% CI, −.8% to .9%). Patients who had experienced an enterovirus CNS infection were not at increased risk of cancer (IRR = 0.75; 95% CI, .36–1.53) (Table 2).
Mortality Rate Ratios and Incidence Rate Ratios of Mortality and Morbidities
| Patients with Enterovirus CNS Infection, n | Comparison Cohort, n | Rate Ratio (95% CI) | |
|---|---|---|---|
| Mortality | |||
| Mortality during 1st year of observation | 10 | 10 | 10.0 (4.17–24.1)a |
| Mortality from 2nd year and onwards | 9 | 98 | 0.94 (.47–1.86)a |
| Morbidity | |||
| Cancer | 8 | 109 | 0.75 (.36–1.53)b |
| Dementiac | 0 | 3 | NA |
| Depressionc | 29 | 219 | 1.36 (.92–2.00)b |
| Psychiatric diagnosesd in generale | 10 | 113 | 0.89 (.47–1.70)b |
Abbreviations: CI, confidence interval; CNS, central nervous system; NA, not applicable.
aMortality rate ratio.
bIncidence rate ratio.
cRestricted to individuals aged 20–60 years at time of study inclusion.
eRestricted to children younger than 1 year at time of study inclusion.
dDefined as any F diagnoses of Mental and behavioural disorders in ICD-10 in the Danish Psychiatric Central Research Register.
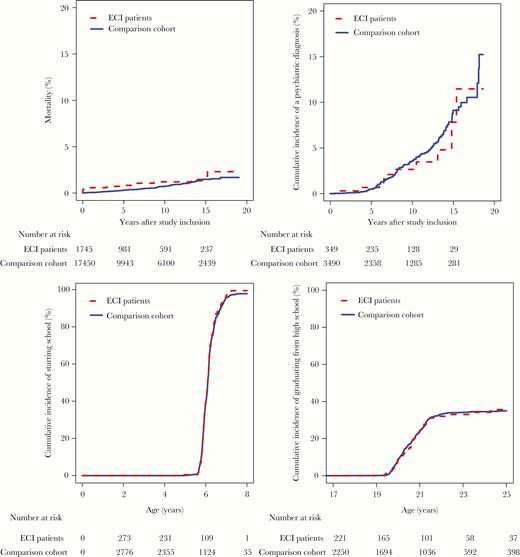
Survival, risk of psychiatric diagnoses, school initiation, and high school completion in patients with enterovirus CNS infection (ECI patients) and the comparison cohort. A, Mortality for persons aged younger than 60 years at time of study inclusion, by years after study inclusion. B, Risk of psychiatric diagnoses among children younger than 1 year at time of study inclusion, by years after study inclusion. C, Cumulative incidence of starting school in persons younger than 1 year at study inclusion. D, Cumulative incidence of high school completion in persons included before age 17 years at study inclusion.
Neuropsychiatric Morbidities and Educational Performance
All Age Groups
In the year of and just following their enterovirus CNS infection, 1% of patients had inpatient or outpatient contacts with a diagnosis of epilepsy, but thereafter this risk waned and approached that of the comparison cohort (Table 3).
Epilepsy, Use of Health Care Services, Employment, Receipt of Disability Pension, Income, Sick Leave, Nursing Home Residency, and Educational Landmarks Among Patients Diagnosed With Enterovirus CNS Infection and Members of the Comparison Cohort, Denmark 1997–2016
| Age at Study Inclusion | Years From Study Inclusion | Patients With Enterovirus CNS Infection | Comparison Cohort | Difference | 95% CI of Difference |
|---|---|---|---|---|---|
| Proportion with inpatient or outpatient hospital contacts with a diagnosis of epilepsy, % | |||||
| < 60 y | −2 | 0.4 | 0.2 | 0.3 | −.1 to 0.6 |
| 0 | 0.9 | 0.2 | 0.7 | .2 to 1.1 | |
| 1 | 1.0 | 0.2 | 0.7 | .3 to 1.2 | |
| 4 | 0.7 | 0.2 | 0.5 | .0 to .9 | |
| 8 | 0.5 | 0.2 | 0.3 | −.3 to .8 | |
| Hospitalization, mean inpatient d/y | |||||
| ≥ 20 y and < 60 y | −2 | 1.5 | 0.5 | 1.0 | .6 to 1.4 |
| 0 | 5.0 | 0.4 | 4.6 | 4.2 to 5.0 | |
| 1 | 0.7 | 0.5 | 0.2 | −.008 to .4 | |
| 4 | 0.6 | 0.4 | 0.2 | −.2 to .5 | |
| 8 | 0.3 | 0.4 | −0.1 | −.3 to .01 | |
| Outpatient visits, mean visits/y | |||||
| ≥ 20 y and < 60 y | −2 | 2.5 | 1.1 | 1.3 | 1.0 to 1.7 |
| 0 | 3.0 | 1.4 | 1.6 | 1.3 to 1.9 | |
| 1 | 2.1 | 1.5 | 0.7 | .3 to 1.0 | |
| 4 | 1.7 | 1.5 | 0.2 | −.3 to .7 | |
| 8 | 1.5 | 1.5 | 0.0 | −.4 to .5 | |
| Proportion employed, % | |||||
| ≥ 20 y and < 60 y | −2 | 90 | 85 | 4.5 | 2.5 to 6.6 |
| 0 | 86 | 83 | 2.2 | −.3 to 4.7 | |
| 1 | 88 | 84 | 3.7 | 1.2 to 6.2 | |
| 4 | 85 | 81 | 4.2 | .6 to 7.7 | |
| 8 | 84 | 79 | 4.3 | −.2 to 8.8 | |
| Proportion on disability pension, % | |||||
| ≥ 20 y and < 60 y | −2 | 0.9 | 2.3 | −1.4 | −2.0 to −.7 |
| 0 | 1.2 | 2.8 | −1.7 | −2.5 to −.8 | |
| 1 | 0.9 | 3.1 | −2.1 | −2.9 to −1.3 | |
| 4 | 2.3 | 3.9 | −1.6 | −3.2 to −.1 | |
| 8 | 3.8 | 5.1 | −1.3 | −3.7 to 1.0 | |
| Yearly income, mean Danish Kroner, thousands | |||||
| ≥ 20 y and < 60 y | −2 | 281 | 250 | 30 | 7 to 54 |
| 0 | 338 | 275 | 63 | −11 to 137 | |
| 1 | 356 | 292 | 64 | −5 to 132 | |
| 4 | 326 | 304 | 22 | −3 to 47 | |
| 8 | 390 | 356 | 35 | −27 to 96 | |
| Days of sick leave/y | |||||
| ≥ 20 y and < 60 y | −2 | 43.0 | 19.9 | 23.1 | 16.9 to 29.3 |
| 0 | 43.0 | 17.6 | 25.1 | 20.0 to 30.8 | |
| 1 | 32.6 | 17.4 | 15.2 | 9.8 to 20.6 | |
| 4 | 15.9 | 16.7 | −0.8 | −5.1 to 3.4 | |
| 8 | 16.6 | 18.3 | −1.6 | −8.0 to 4.7 | |
| Proportion living in nursing home, % | |||||
| ≥ 20 y and < 60 y | −2 | 0.1 | 0.3 | −0.2 | −.4 to .1 |
| 0 | 0.2 | 0.3 | −0.1 | −.4 to .2 | |
| 1 | 0.2 | 0.2 | 0.0 | −.3 to .3 | |
| 4 | 0.0 | 0.2 | −0.2 | −.3 to −.1 | |
| 8 | 0.0 | 0.2 | −0.2 | −.3 to .0 | |
| Proportion with a high grade in written mathematics in elementary school % | |||||
| < 6 y | NA | 65 | 68 | −3 | −15 to 9 |
| Proportion with a high grade in written Danish in elementary school % | |||||
| < 6 y | NA | 67 | 62 | 5 | −8 to 17 |
| Cumulative incidence of starting school before age 6 y, % | |||||
| <1 y | NA | 40 | 39 | 1 | −6 to 9 |
| Cumulative incidence of passing high school examination before age 25 y, % | |||||
| <17 y | NA | 35 | 35 | 1 | −8 to 9 |
Abbreviations: CI, confidence interval; CNS, central nervous system; NA, not applicable.
Children Younger Than 1 Year
The risk of mental and behavioral disorders was not higher among children who experienced an enterovirus CNS infection than among children in the comparison cohort (IRR = 0.89; 95% CI, .47–1.70) (Figure 2B and Table 2).
Children Younger Than 6 Years
Children with a history of an enterovirus CNS infection did not have a delayed start in elementary school compared with children in the comparison cohort (Table 3 and Figure 2C). Furthermore, the proportion of children with a history of an enterovirus CNS infection who earned a high grade in written mathematics and Danish during the last year of primary school was almost the same as the proportion in the comparison cohort (Table 3).
Children Younger Than 17 Years
Children with a history of an enterovirus CNS infection did not complete high school later than children in the comparison cohort (Table 3 and Figure 2D).
Adults Aged 20 to 60 Years
No patients with a history of enterovirus CNS infection developed dementia during follow-up (Table 2). Risk of depression in the patient cohort was not much higher than in the comparison cohort (IRR = 1.36; 95% CI, .92–2.00).
Other Outcomes Potentially Related to Cognitive Decline or Other Sequelae
During the year of diagnosis and in the period before diagnosis, patients with an enterovirus CNS infection spent more days in the hospital than persons in the comparison cohort (Table 3, Figure 1B, and Supplementary Figure 4). In the sensitivity analysis omitting visits at departments of gynecology and obstetrics, patients with an enterovirus CNS infection still had increased hospitalization rates in the years just before and after study inclusion. In addition, patients with an enterovirus CNS infection had greater use of outpatient services in the years just before and after their diagnosis (Table 3 and Supplementary Figure 5), even after omitting outpatient visits at departments of gynecology and obstetrics (data not shown). In the years following diagnosis, the use of inpatient and outpatient hospital services among patients with an enterovirus CNS infection decreased to the level of use among members of the comparison cohort (Table 3). The patients were less likely to receive a disability pension and their income and employment were not lower than members of the comparison cohort (Table 3, Figure 1C, Supplementary Figure 6, and Supplementary Figure 7). Patients with an enterovirus CNS infection had more days of sick leave in the years immediately before and after diagnosis, but the level dropped to that of the comparison cohort over time (Table 3 and Figure 1D). The excess risk of sick leave was more pronounced among female patients and among patients who were parenting children during the year in which they were diagnosed with an enterovirus CNS infection (data not shown). Patients were not more likely to live in nursing homes (Table 3).
Discussion
In this nationwide, population-based cohort study, individuals diagnosed with an enterovirus CNS infection had an increased short-term mortality but their long-term mortality was not increased compared with that of the general population. We observed no impact on long-term health or social/educational functioning.
Our study design including a large study population and complete long-term follow-up increases the precision of our estimates. In addition, our choice of outcomes reflects markers of success in all phases of life—from school initiation and performance through work capability, development of comorbidities, nursing home residency, and death.
It is a shortcoming of our study that we had no access to data on enterovirus subtype and therefore were unable to stratify our analyses by this variable. In Denmark subtypes A71 and D68 are detected infrequently in the CSF [24, 25], which may contribute to the excellent prognosis. Furthermore, we did not have access to magnetic resonance imaging results, neuropsychological evaluation, or functional motor assessment of patients with a history of an enterovirus CNS infection. Therefore, we might have missed subtle neurodevelopmental changes that were not captured by our outcome measures. However, we were able to evaluate functional status in terms of social/educational functioning. Importantly, we were able to compare this functional status with that in the general population using prospectively collected registry data, which were unbiased by our study hypothesis. We only studied a first-time event of enterovirus CNS infection and therefore were unable to address the potential impact of reinfection of CNS with enterovirus.
To fully assess the sequelae of enterovirus CNS infection, it would be optimal to compare neuropsychological testing and functional motor assessment of patients diagnosed with this infection before and after diagnosis, with comparable assessments for the general population. As this is not feasible on a nationwide scale, we assessed survival, health, and social/educational functioning as surrogates for neuropsychological testing and functional motor assessment. The demonstration of a good long-term prognosis among patients with a history of an enterovirus CNS infection is consistent with the current thinking that enterovirus CNS infection is most often a benign disease that primarily causes self-limiting lymphocytic meningitis [26, 27]. The vast majority of patients with an enterovirus CNS infection survive its acute phase. Although mortality was low, we did observe a 0.5% excess risk of death during the first year of follow-up after diagnosis of the infection, and in particular mortality in infancy during the first year of observation was high (1.1%). Due to Danish data regulations, missing data on enterovirus serotypes, and the small number of deaths we were unable to analyze causes of death or underlying risk factors, which could have helped us understand the increased mortality observed during the first year of follow-up, especially in infancy. Enterovirus CNS infection seemed to be associated with a slightly increased risk of being diagnosed with epilepsy in the acute phase of the disease. It remains possible that patients diagnosed with epilepsy might tend to be hospitalized for febrile illness and thereby be at increased risk of a diagnosis of enterovirus CNS infection. Importantly, patients’ risk of a diagnosis of epilepsy waned over time and was very low in absolute terms. Except for increased short-term mortality, it is encouraging that enterovirus CNS infection was not associated with any other neurological or psychiatric diseases, failure to reach educational milestones, or reduction in social functioning.
It is well known that certain subtypes of enterovirus can cause significant morbidity and mortality [1, 28]. In a study of Taiwanese children with enterovirus A71 brain stem encephalitis, 5% died and 14% had residual deficits [4]. In a study of Australian children with enterovirus A71 neurological infection, 7% died and 10% experienced persisting symptoms after 1 year of follow-up [5]. Furthermore, severe infections have been described following preterm births and in the neonatal and pediatric setting [3–5, 29, 30]. We therefore speculate that the increased short-term mortality observed in our study might be partly due to prematurity and/or particular serotypes, especially among patients under 1 year of age at study inclusion. Compared with the elevated mortality found in the highly selected study cohorts described above, it is reassuring that in our study short-term mortality was substantially lower and that long-term mortality was not increased. The increased risk of epilepsy observed among patients with an enterovirus CNS infection accords with the literature, which describes seizures as known complications of enterovirus CNS infections, especially encephalitis [31–33].
An unexpected finding in our study was the strong association between risk of an enterovirus CNS infection in parents and number of offspring. However, this is consistent with enteroviral infection primarily affecting children [1] and parents being at high risk of intrafamilial transmission of enterovirus [34]. The association among adults between risk of enterovirus CNS infection, number of children, and several other socioeconomic factors (marriage, employment, income, and not receiving a disability pension) might reflect that in contemporary society decisions to have children are often made in times of social security. The increased number of sick leave days and the excess use of hospital services might be a consequence of parenting young children.
CONCLUSION
In summary, our study demonstrated that long-term prognosis, in terms of survival, health, and social/educational functioning, is excellent among patients with a history of enterovirus CNS infection.
Supplementary Data
Supplementary materials are available at The Journal of Infectious Diseases online. Consisting of data provided by the authors to benefit the reader, the posted materials are not copyedited and are the sole responsibility of the authors, so questions or comments should be addressed to the corresponding author.
Notes
Financial support. This work was supported by the Independent Research Fund Denmark (grant number 6110-00173B).
Potential conflicts of interests. T. B. reports grants from Pfizer, Novo Nordisk Foundation, and Simonsen Foundation; grants and personal fees from GSK and Pfizer; and personal fees from Boehringer Ingelheim, Gilead, and MSD, outside the submitted work. R. B. D. reports personal fees from Roche Diagnostics outside the submitted work. H. T. S. reports that the Department of Clinical Epidemiology, Aarhus University Hospital receives funding for studies from companies in the form of research grants to (and administered by) Aarhus University outside the submitted work. All other authors report no potential conflicts.
All authors have submitted the ICMJE Form for Disclosure of Potential Conflicts of Interest. Conflicts that the editors consider relevant to the content of the manuscript have been disclosed.

