


Abstract
Despite increased efforts and spending toward polio eradication, it has yet to be eliminated worldwide. We aimed to project economic costs of polio eradication compared to permanent control. We used historical Financial Resource Requirements from the Global Polio Eradication Initiative, as well as vaccination and population data from publicly available sources, to project costs for routine immunization, immunization campaigns, surveillance and laboratory resources, technical assistance, social mobilization, treatment, and overhead. We found that cumulative spending for a control strategy would exceed that for an eradication strategy in 2032 (range, 2027–2051). Eradication of polio would likely be cost-saving compared to permanent control.
The economic benefit of polio eradication has been discussed from several perspectives [1, 2]. Despite increased spending toward eradication and the potential benefits, polio has yet to be eliminated worldwide. Recently, progress toward eliminating the final polio cases has stalled, although spending continues to increase [3]. Because there are competing options for spending health and development dollars, it is useful to reassess the value of polio eradication at this time to weigh the tradeoffs between putting even greater emphasis on eradication to eliminate the final cases or decreasing spending to maintain a permanent polio control strategy. To add to other modeling evidence [1], we re-evaluate the value of investments in eradication and whether long-term commitment is cost-saving given we can eradicate, based on the current state.
A realistic alternative to an eradication strategy at this time would be to maintain permanent control of polio. This is not equivalent to lack of control, in which spending and vaccination drastically decrease, allowing tens of thousands of cases worldwide. The costs may differ significantly over the long-term for an eradication and permanent control strategy, but we would expect the total burden of polio cases between the 2 strategies to increase only from tens to thousands of cases annually, which would not contribute significant negative health consequences relative to other contributors of global health burden. As a consequence, the benefits of eradication compared with permanent control would be driven by direct economic cost reductions rather than economic gains from prevented cases.
Our objective was to compare projections of the economic costs of polio eradication, which would require higher upfront costs to eradicate but then lead to lower costs after eradication when vaccination could be stopped or minimized worldwide, to permanent control, which would require lower costs initially due to less intense vaccination campaigns but would remain more constant over time.
METHODS
The analysis was an assumption-based extrapolation of past cost data. We used historical data and assumptions to project costs beginning in 2020 at timepoints through 2100. We compared a permanent control strategy, in which polio efforts would continue at historical levels (before the eradication efforts of the last few years but after control had been achieved), to an eradication strategy in which efforts would increase and lead to interruption of transmission in 2020, after which eradication could be established and immunization would decrease. Population projections were used to take into account growing population sizes [4].
This analysis was from the global health system perspective and included routine and campaign immunization, treatment, and programmatic costs for all countries. For each category for each country over time, we made assumptions to project spending in the future as described below. This analysis did not aim to model disease transmission, probability of eradication, or explicitly predict number of cases. Number of cases assumptions were used only to calculate disease treatment costs as detailed below.
We inflated all costs to 2019 US dollar using the consumer price index average for the year of cost data collection [5]. We discounted at 3% per year [6]. Analysis was completed in R version 3.5.0.
Permanent Control Strategy Costs
One key data source for historical costs were the historical Financial Resource Requirements (FRR) from the Global Polio Eradication Initiative (GPEI) [7]. The FRR for each year details total GPEI fundraising budgets for high-risk countries by cost category. Each FRR also included surveillance and technical assistance budgets for both high- and low-risk countries, the estimated risk level for each country, planned campaign schedules, and campaign coverage per year. We selected historical data from 2008 to 2015 from the FRRs, because we believe this could represent what a permanent control strategy could look like, with maintained control but not a complete eradication effort.
Routine Immunization
We used unit costing methods to apply a cost per dose for routine immunization (RI) of both oral poliovirus vaccines (OPV) and inactivated poliovirus vaccines (IPV) using vaccination schedules [8], costs (Table 1), population projections [4], and coverage data [9]. Because OPV1 (first dose of OPV) coverage is not reported, we assumed OPV1 coverage would be equivalent to DTP1 coverage and used reported OPV3 (third dose of OPV) coverage for the third dose, then calculated a percentage decrease in coverage per dose to extrapolate coverage of other doses. Coverage decrease per dose ranged from 0% to 20% (mean 2.6%, median 1.5%). We assumed coverage of the first dose of IPV was equivalent to DTP3 coverage [9].
Unit Cost Inputs
| Cost Category | Setting | Cost | Source |
|---|---|---|---|
| OPV dose cost per person | Gavi country | $0.15 | [13] |
| Non-Gavi country | $0.20 | [13] | |
| IPV dose cost per person | Gavi country | $2.05 | 10-dose vial in 2019 [14] |
| Non-Gavi country | $3.51 | 10-dose vial in 2019 [14] | |
| Routine delivery cost per person | DTP1 <80% coverage | $1.30 | [13] |
| DTP1 ≥80% coverage | $2.46 | [13] | |
| Treatment cost per person with polio AFP case | Low income | $700 | [15] |
| Lower to middle income | $7000 | [15] | |
| Upper to middle income | $70 000 | [15] | |
| High income | $750 000 | [15] |
Abbreviations: AFP, acute flaccid paralysi; IPV, inactivated poliovirus vaccine; OPV, oral poliovirus vaccine.
We assumed that vaccination coverage rates would remain constant at current levels. We assumed that IPV dose cost would decrease over time due to production improvements, with costs decreasing by 3-fold between 2025 and 2035 [10] for both Gavi, The Vaccine Alliance and non-Gavi costs.
Based on current IPV strategy in Bangladesh, Nepal, and Sri Lanka, we included fractional IPV dose costing, in which delivery costs remained the same but dose costs were 20% of the dose cost listed above, with 60% wastage rates [11]. We assumed that IPV would be introduced in all countries up to 2 doses, with an additional dose introduced every 5 years starting in 2020 until each country reached 2 doses. We projected an additional scenario that included IPV in a hexavalent vaccine in India and China.
Immunization Campaigns
Because there is significant uncertainty in campaign spending, we calculated OPV campaign costs using 4 methods. We used (1) the average of these 4 methods for our projection and (2) the high and low for the range.
We identified outbreak years and frequency of outbreaks between 2008 and 2015 by country. We assumed that outbreak response campaigns could continue for up to 2 years after the outbreak year, so we calculated (1) the average outbreak year spending and coverage as the average of the 3 years and (2) the average non-outbreak spending and coverage for preventative campaigns from the years in between.
First, we projected outbreaks to continue at the same rate in the future, and we applied outbreak year and non-outbreak year costs. Second, we applied costs per under-5 population targeted. We assumed 5 campaigns per outbreak year and 2 campaigns per non-outbreak year, based on expert opinion for a strong outbreak control strategy. Third, we applied a constant cost per under-5 population regardless of outbreak or non-outbreak year. Finally, we applied the expected coverage levels in outbreak and non-outbreak years to the projected under-5 populations and applied a dose cost (Table 1). In countries that had no, or very few, campaigns in the past (ie, low-risk countries), the non-outbreak campaign cost would continue to be $0 or very small.
Programmatic Costs
Programmatic costs were defined as surveillance and laboratory resources, technical assistance, social mobilization, and overhead costs, for which we used data from FRRs from GPEI [7]. For surveillance and laboratory resources, technical assistance, and social mobilization costs for low-risk countries, we assumed that spending would continue at the same level as the average value between 2008 and 2015. For technical assistance and social mobilization for high-risk countries, we conservatively assumed costs would decrease to the average per capita technical assistance and social mobilization costs from low-risk countries. Although the magnitude of decrease for these cost categories is unknown, this assumption represents the lower bound for costs.
For surveillance costs for high-risk countries, we used the average of 3 scenarios. First, we assumed spending would decrease to the per-capita level of low-risk countries for the 2020 population then remain constant. Second, we calculated the median acute flaccid paralysis (AFP) rate in low-risk countries (2.3 cases per 1000 population under 15) and the percentage decrease from current AFP rate in a high-risk country to that rate [12]. We then applied that percentage decrease to the current surveillance budget. Finally, we assumed that surveillance costs in all countries would continue at levels equivalent to 2008–2015.
Treatment Costs
We included a cost for treatment of polio per paralytic polio case. We assumed that without eradication efforts, the incidence of polio would increase back to rates before the recent intensification of eradication efforts, represented by the average incidence for each country between 2005 and 2017. We projected expected number of polio cases by reversing the trend in incidence in each country from 2005 to 2017 [12] to estimate the effect of waning public attention to polio over time (ie, we assumed the incidence rate in 2020 would be equivalent to 2017, in 2021 the rate would be equivalent to 2016, etc). After that, we assumed the incidence rate would level out to the mean historical value from 2005 to 2017. We applied incidence rates to projected population sizes [4]. We expect that outbreaks would cause year-to-year volatility in the number of cases, but mean incidence over time would become stable and be represented by this model. The costs per case were dependent on the country income group (Table 1).
Eradication Strategy Costs
For the eradication scenario programmatic and campaign costs, we used the proposed GPEI budget data for years 2020–2023 [7]. For years 2024–2030, we used the sum of costs from a postcertification budget estimate from GPEI (data on file). We assumed programmatic costs would remain constant from 2030 to 2100. The range of GPEI costs was calculated using the standard deviation of GPEI costs from 2008 to 2015.
For RI costs, we used the same methods as in the control scenario above, then we assumed that OPV RI would be stopped in 2024, 1 year after certification, and IPV RI vaccination would be stopped between 2030 and 2050. We assumed IPV RI would linearly decrease over this time frame.
For the base-case scenario, we assumed that interruption occurred in 2020 as has been proposed. In addition, we examined scenarios in which interruption was delayed between 1 and 20 years. In these scenarios, we assumed that costs from 2020 would remain constant until the year of interruption, at which point decrease in costs would occur as described above.
RESULTS
We found that for both eradication and permanent control strategies, RI costs contributed the most to overall costs, with IPV costing more than OPV. An eradication strategy would save more costs over time compared with permanent control, with annual spending for a control strategy becoming higher than annual spending for an eradication strategy beginning in 2025 (in 5 years) (range, 2025–2026). Annual costs for a control strategy remained over $1 billion annually through 2042 and over $500 million through 2066. Cumulative spending for a control strategy would exceed cumulative spending for an eradication strategy in 2032 (range, 2027–2051) (Figure 1). By 2050 (in 30 years), the projected cumulative cost savings was $14 billion (range, $0–32 billion). The cumulative costs over the time horizon of a permanent control strategy would exceed those of an eradication strategy even if interruption of transmission was delayed up to 16 years (Figure 1).
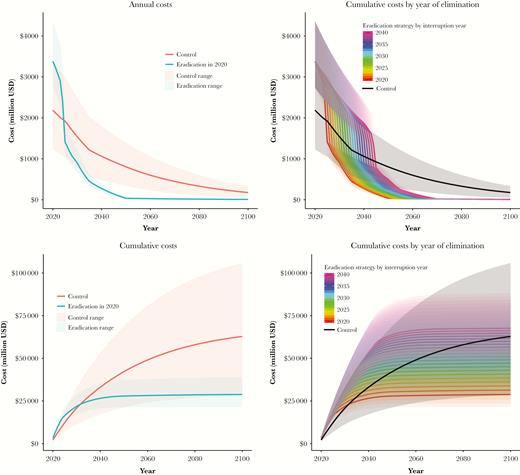
Projected annual (top) and cumulative (bottom) costs for eradication and permanent control strategies with interruption in 2020 (left) and if interruption was delayed by up to 20 years (right).
Discussion
We found that under a control strategy, costs would remain high over time due to ongoing costs for IPV, RI, and campaigns. An eradication strategy would save significant costs compared with permanent control due to avoided costs of vaccination after interruption of polio transmission.
There were several limitations to this analysis. Primarily, this analysis was assumption based. We have attempted to make realistic assumptions to the best of our knowledge, as well as use realistic historical data to mitigate this issue. Second, spending on polio comes from several different sources, which may change over time depending on strategy. We have included relevant costs to all payers, without specifying source of funding. In addition, we would expect that due to policy differences and country autonomy, individual country experiences would differ from our projections under a control scenario. Specific country or regional control policies, although beyond the high-level perspective of this article, may be heterogeneous in process or implementation. This is not a country-level model and does not address spatiotemporal variability, rather it assumes that the modeled results represent the mean values over time and space.
Conclusions
Overall, we find that eradication of polio would likely be cost-saving compared to permanent control. Significant uncertainty exists around the future of polio spending, but investments in eradication will likely have a high return on investment in avoided costs of vaccination.
Notes
Disclaimer. The work submitted here has not been subject to censoring or approval by the funder.
Financial support. This work was completed by the Institute for Disease Modeling, which is funded by Bill Gates through the Global Good Fund.
Potential conflicts of interest. All authors: No reported conflicts of interest. All authors have submitted the ICMJE Form for Disclosure of Potential Conflicts of Interest.

