


Abstract
Human immunodeficiency virus (HIV) infection is an independent risk factor for coronary heart disease (CHD) and is associated with perturbation of the gut microbiota.
We analyzed gut microbiota in 30 HIV-infected individuals with CHD (CHD+) and 30 without CHD (CHD–) of the HIV-HEART study group.
Gut microbiota linked to CHD was associated with lower α-diversity. Despite insignificant differences in β-diversity, co-occurrence networks of bacterial genera clearly diverged between CHD+ and CHD– individuals. Multidimensional scaling separated HIV-infected individuals into 2 microbiome clusters, dominated by the genus Prevotella or Bacteroides. The relative abundance of 49 other genera was significantly different between both clusters. The Prevotella-rich cluster was largely composed of men who have sex with men (MSM) (97%), whereas the Bacteroides-rich cluster comprised both MSM (45%) and heterosexual individuals (55%). MSM of the Bacteroides-rich cluster were characterized by reduced α-diversity, advanced immunological HIV stage, longer antiretroviral therapy with more ART regimens, and longer use of protease inhibitors, compared with Prevotella-rich MSM.
Community structures of gut microbiota rather than individual species might facilitate risk assessment of CHD in HIV-infected individuals. Sexual behavior appears to be an important factor affecting gut microbiota β-diversity and should be considered in future studies.
Since the introduction of combined antiretroviral therapy (cART), life expectancy of human immunodeficiency virus (HIV)–infected individuals is nearly comparable to that of HIV-uninfected individuals [1]. However, some comorbidities that are common in HIV-negative individuals are increased in chronic HIV infection despite full suppression of HIV viremia. In particular, coronary heart disease (CHD) is more common in HIV-infected individuals [2], who have an increased risk of cardiovascular events that is not explained by the classical risk factors or cART treatment alone [2, 3]. It has been suggested that trimethylamine-N-oxide (TMAO), a metabolite derived from bacterial metabolism of phosphatidylcholine, could be an independent risk factor for the development of CHD [4], representing a conceivable link between gut microbiota and CHD [4, 5]. Its atherogenic effect has been explained by alterations in cholesterol and bile acid metabolism, activation of inflammatory pathways, and promotion of foam cell formation [6].
Alterations of the gut microbiota are associated with diseases that are major risk factors for CHD: obesity, type 2 diabetes, and the metabolic syndrome. Furthermore, alteration of the gut microbiome has been reported in HIV infection, indicating significant differences between HIV-uninfected and HIV-infected individuals [7]. In addition, sexual behavior has been linked to altered β-diversity of gut microbiota [8].
The gut microbiome of human individuals has been classified into defined enterotypes that are identifiable by variation in the levels of 3 abundant genera, Bacteroides, Prevotella, and Ruminococcus [9]. Enterotypes are characterized by the formation of bacterial community networks with positive or negative co-occurrence between genera [9]. Alterations of the structure and connectivity patterns of the intestinal co-occurrence networks have been linked to disease [10].
To the best of our knowledge, studies analyzing gut microbiota linked to CHD in HIV-infected individuals are lacking to date. We studied the gut microbiome of HIV-infected individuals of the HIV-HEART study cohort to determine if CHD is associated with differences in gut microbiota diversity or community networks. We also evaluated associations between high TMAO serum levels and gut microbiota differences.
MATERIALS AND METHODS
Study Design
We included 60 HIV-infected individuals of HIV-HEART study, a long-term, prospective, multicenter, observational study in the German Ruhr area investigating the impact of HIV infection on the incidence, prevalence, and progression of CHD in HIV-infected individuals since 2004 [11]. The study is registered at ClinicalTrials.gov (NCT01119729). This study was reviewed and approved by the Ethics Committee of the Medical Faculty of the University of Duisburg-Essen (number 14-5874-BO) and was performed in accordance with the latest version of the Declaration of Helsinki. Written informed consent was obtained from all patients before enrollment.
We matched 30 HIV-infected individuals with (CHD+) and 30 without CHD (CHD–) for the covariates sex, age in decades, and diabetes mellitus. CHD+ individuals were defined by at least 1 of the following 3 criteria: (1) diagnosis of CHD by positive heart catheter examination; (2) history of myocardial infarction; and (3) history of CHD+ confirmed by medical reports from other hospitals. CHD– individuals had no history of CHD in anamnesis and medical reports and no symptoms or evidence suspicious for CHD. The International Standard Classification of Education (ISCED) score was used to determine the educational level (0 = early childhood education; 1 = primary education; 2 = lower secondary education; 3 = upper secondary education; 4 = postsecondary nontertiary education; 5 = short-cycle tertiary education; 6 = bachelor’s degree or equivalent; 7 = master’s degree or equivalent; 8 = doctoral degree or equivalent) [12]. Stool samples were taken using the Stratec Stool Collection Tubes with Stool DNA Stabilizer (Stratec, Berlin, Germany).
DNA Isolation and Sequencing
DNA was extracted using the PSP Spin Stool DNA Extraction Kit (Stratec) according to the manufacturer’s protocol for stool samples from “difficult-to-lyse” bacteria. Both amplicon and index polymerase chain reaction (PCR) were performed as described in [13]. The V3/V4 region of the 16S ribosomal RNA gene was amplified using the 341F forward primer and the 785R primers of Klindworth et al [14] with an Illumina adapter overhang nucleotide sequence added to the 5ʹ end of the locus-specific sequences. Index PCR was performed using the Nextera XT Index kit (Illumina). Sequencing was performed using the Illumina MiSeq 600 cycle reagent kit version 3 (Illumina). MiSeq reads and study metadata were deposited in the National Center for Biotechnology Information repository (Bioproject accession number PRJNA433066, SRA accession: SRP132244).
Sequencing Data Preprocessing and Analysis
Paired-end fastq-files were preprocessed, quality-filtered, and analyzed using the Quantitative Insights Into Microbial Ecology (QIIME) 1.9.1 pipeline [15]. Sequence reads were joined using fastq-join and quality filtered with a phred score Q ≥ 25. Open reference operational taxonomic unit (OTU) picking was performed with UCLUST [16] against the Greengenes 13.8 database with a similarity of at least 97% [17]. Stool DNA stabilizer liquid fluid from the collection tubes undergoing the DNA-extraction procedure and a PCR water sample were used as negative controls. The OTUs of these controls, unassigned and archea sequence reads were excluded from all samples. For α- and β-diversity comparisons, samples were rarefied to the sample with the lowest sequence count. For a better understanding of α-diversity, we calculated Shannon (richness and evenness estimator), Chao1 (total bacterial richness, estimates number of rare taxa missed from undersampling), Simpson (measures the relative abundance of different species making up the sample richness), observed OTUs (number of OTUs in a sample, calculates the basic α-diversity richness), Faith phylogenetic diversity (PD whole tree richness estimator, which takes into consideration the phylogeny of microbes to estimate diversity), and the Gini diversity index (relative inequality/unevenness estimator). Principal coordinates analysis (PCoA) was performed based on unweighted and weighted UniFrac, Bray-Curtis, and Binary Jaccard distances.
Statistical Analysis
Patient characteristics were tested with a significance level of α < .05. Metric variables were tested with t tests. Categorical variables were compared by Fisher exact test. Mean ± standard deviation was used for metric variables. For skewed, approximately log-normal distributions, medians and interquartile ranges were calculated. Kruskal–Wallis test was used for taxa and OTU comparisons and Benjamini–Hochberg false discovery rate (FDR) correction was applied to correct for multiple hypothesis testing. Permutational multivariate analysis of variance (PERMANOVA) with 999 permutations was used to test for differences in β-diversity among groups.
Co-occurrence and Network Analysis
Unsupervised co-occurrence analysis was performed to find pairwise biological associations between the bacterial genera of all samples of all 240 genera of the genus-level biom-table. Three steps were performed repeatedly for obtaining robust correlation values: (1) The biom-table was rarefied to the lowest number of sequences of all 60 samples; (2) Individuals were sampled randomly with replacement in each group (CHD+ and CHD–); (3) Spearman rank correlation, following Connor et al [18], was computed for the resulting OTU table of each group.
The median of correlations of all iterations was considered as co-occurrence value. This value was deemed significant if its absolute value exceeded the minimum acceptable threshold that was calculated based on the permutation method described in [18]. For a robust estimation, the rarefied OTU was additionally permuted 50 times and the mean of all minimum acceptable thresholds plus 1.96 of its standard deviation was chosen as final minimum acceptable threshold. OTUs with all co-occurrences less than the minimum acceptable threshold were excluded from the final co-occurrence matrix. These matrices were analyzed and visualized in Gephi, version 0.8.2, with the force-directed method [19], and the largest connected network component was represented. Other components contained less than 4 OTUs. The complete procedure has been implemented as an R-script, available at https://github.com/BioinformaticsBiophysicsUDE/RobustOTUCooccurrence.
TMAO Quantification
TMAO serum levels were measured as described previously [20]. In brief, TMAO (Sigma-Aldrich, Munich, Germany) was used as a standard and d9-TMAO (Cambridge Isotope Laboratories) as internal standard. The internal standard working solution contained 10 µmol/L of d9-TMAO prepared in methanol/acetonitrile (15:85) and 0.2% formic acid. Three hundred microliters of internal standard working solution was added to 100 µL serum. The mix was vortexed and centrifuged (10000g for 5 minutes) before the supernatant was transferred to maximum recovery vials (Waters Corporation). TMAO was quantified using an Acquity ultra performance liquid chromatography system coupled to a MicroMass Quattro Premier XE tandem quadrupole mass spectrometer (Waters Corporation).
RESULTS
Patient Characteristics
We included 30 CHD+ and 30 CHD– HIV-infected individuals, all receiving cART. Both groups differed in some unmatched parameters: CHD+ individuals were characterized by an advanced clinical HIV Centers for Disease Control and Prevention (CDC) stage, a higher prevalence of arterial hypertension, ingestion of cardiovascular drugs, and longer duration of cART compared with CHD– individuals (Table 1 and Supplementary Table 1). After data processing and quality filtering, we obtained 2265388 sequences in total for all samples with a minimum of 6198 sequences and a maximum of 91932 sequences per sample. The mean sequence frequency was 37756 ± 15952.
Characteristics of the Study Populations With and Without Coronary Heart Disease
| Characteristic | Total | CHD– | CHD+ | P Value |
|---|---|---|---|---|
| No. of subjects | 60 | 30 | 30 | 1.00 |
| Age, y, mean ± SD | 52.9 ± 10.9 | 51.6 ± 10.7 | 54.1 ± 11.2 | .37 |
| Sex, male | 56 | 28 | 28 | 1.00 |
| ISCED score, mean ± SD | 3.7 ± 1.1 | 3.8 ± 1.3 | 3.6 ± 0.9 | .64 |
| BMI, kg/m2, mean ± SD | 25.7 ± 4.1 | 26.1 ± 3.9 | 25.4 ± 4.2 | .48 |
| Age at HIV infection, y, mean ± SD | 38.8 ± 10.3 | 40.4 ± 9.6 | 37.1 ± 10.9 | .22 |
| Duration of HIV infection, y, mean ± SD | 14.1 ± 6.9 | 11.1 ± 5.4 | 17.1 ± 6.9 | <.001 |
| CDC HIV stage—clinical | .009 | |||
| A | 20 (33.3) | 15 (50.0) | 5 (16.7) | |
| B | 19 (31.7) | 8 (26.7) | 11 (36.7) | |
| C (AIDS) | 21 (35.0) | 7 (23.3) | 14 (46.7) | |
| CDC HIV stage—immunological | .09 | |||
| I | 1 (1.7) | … | 1 (3.3) | 1.00 |
| II | 28 (46.7) | 18 (60.0) | 10 (33.3) | .07 |
| III | 31 (51.7) | 12 (40.0) | 19 (63.3) | .12 |
| Ratio CD4/CD8 cells, mean ± SD | 0.78 ± 0.45 | 0.82 ± 0.44 | 0.73 ± 0.47 | .47 |
| HIV RNA <50 copies/mL (ART patients only) | 58 (96.7) | 29 (96.7) | 29 (96.7) | 1.00 |
| Sexual behavior | .78 | |||
| MSM | 42 (70.0) | 22 (73.3) | 20 (66.7) | |
| Heterosexual | 18 (30.0) | 8 (26.7) | 10 (33.3) | |
| Diabetes mellitus | 10 (16.7) | 5 (16.7) | 5 (16.7) | 1.00 |
| Hyperlipidemia | 53 (88.3) | 24 (80.0) | 29 (96.7) | .10 |
| Arterial hypertension | 43 (71.7) | 14 (46.7) | 29 (96.7) | <.001 |
| Lipodystrophy | 11 (19.0) | 2 (7.1) | 9 (30.0) | .043 |
| Duration of ART, mo | .002 | |||
| Mean ± SD | 122.1 ± 62.3 | 98.0 ± 52.2 | 146.1 ± 63.0 | |
| Median (IQR) | 112.1 (89–167) | 106.8 (56–134) | 139.3 (106–184) | |
| Duration of protease inhibitors, mo | .004 | |||
| Mean ± SD | 63.1 ± 57.8 | 41.9 ± 52.3 | 84.3 ± 55.9 | |
| Median (IQR) | 63.0 (0–103) | 10.4 (0–84) | 85.2 (51–129) | |
| No. of protease inhibitors in regimen | .09 | |||
| Mean ± SD | 2.5 ± 3.0 | 1.9 ± 2.7 | 3.2 ± 3.1 | |
| Median (IQR) | 1.5 (0–4) | 1.0 (0–2.8) | 2.5 (1–4) | |
| Duration of boosting substances, mo | .13 | |||
| Mean ± SD | 17.3 ± 28.6 | 11.7 ± 23.3 | 22.9 ± 32.5 | |
| Median (IQR) | 0.0 (0–29) | 0.0 (0–8) | 0.0 (0–44) | |
| Frequency of boosting substance in cART regimen, mean ± SD | 0.6 ± 0.9 | 0.5 ± 1.0 | 0.7 ± 0.9 | .50 |
| History of COPD | 5 (8.9) | 1 (3.3) | 4 (15.4) | .17 |
| History of CMV infection | 6 (10.7) | 1 (3.3) | 5 (19.2) | .09 |
| History of hepatitis B | 19 (33.3) | 10 (33.3) | 9 (33.3) | 1.00 |
| History of hepatitis C | 6 (10.7) | 1 (3.3) | 5 (19.2) | .09 |
| History of malignancy | 6 (10.5) | 1 (3.3) | 5 (18.5) | .09 |
| History of depression | 11 (19.6) | 6 (20.0) | 5 (19.2) | 1.00 |
| Use of antibiotics within 6 mo before stool sampling | 13 (22.0) | 6 (20.0) | 7 (24.1) | .76 |
| Statin | 24 (40) | 3 (10) | 21 (70) | <.001 |
| β-blocker | 29 (48.3) | 3 (10.0) | 26 (86.7) | <.001 |
| ACE inhibitor | 23 (38.3) | 6 (20.0) | 17 (56.7) | .007 |
| Acetylsalicylic acid | 25 (41.7) | 1 (3.3) | 24 (80.0) | <.001 |
Data are presented as No. (%) unless otherwise indicated. Metric variables were tested with t tests. Categorical variables were compared by Fisher exact test Mean ± SD was used for metric variables. For skewed, approximately log-normal distributions, medians and IQR are reported.
Abbreviations: ACE, angiotensin-converting enzyme; ART, antiretroviral therapy; BMI, body mass index; cART, combined antiretroviral therapy; CDC, Centers for Disease Control and Prevention; CHD, coronary heart disease; CMV, cytomegalovirus; COPD, chronic obstructive pulmonary disease; HIV, human immunodeficiency virus; IQR, interquartile range; ISCED, International Standard Classification of Education; MSM, men who have sex with men; SD, standard deviation.
Gut Microbiota Differences Between CHD+ and CHD– Individuals
Different α-diversity metrics related to species and phylogenetic richness, evenness, and combined richness-evenness estimators were lower in CHD+ compared with CHD– individuals (all with P < .05; Figure 1A). The gut microbiota composition did not differ significantly between both groups on phylum, class, order, family, genus, and OTU level (Figure 1B and Supplementary Table 2). Furthermore, differences in β-diversity were insignificant as determined by PERMANOVA multivariate analysis and illustrated by classical multidimensional scaling (Figure 1C).
![Coronary heart disease (CHD) is associated with reduced α-diversity and no significant alterations in β-diversity of gut microbiota in human immunodeficiency virus–infected individuals. A, Boxplots indicate α-diversity in CHD+ and CHD– samples using different metrics (Chao1, observed operational taxonomic units [OTUs], Shannon, Simpson, Faith’s phylogenetic diversity, and Gini diversity index). B, Mean relative abundance of the 20 most abundant bacterial genera in CHD+ and CHD– individuals. None was significantly different as calculated by Kruskal–Wallis test and Benjamini–Hochberg false discovery rate correcting for multiple testing. f__;g__ represents OTUs that matched the Greengenes reference database, but could not be assigned below the order level; family (f__) and genus (g__) level were not assigned. ;g__ represents OTUs that matched the Greengenes database and could not be assigned below the family level; genus (g__) level was not assigned. C, Principal coordinates analysis was performed using phylogenetic unweighted and weighted UniFrac, Bray-Curtis, and Binary Jaccard distance matrices. Abbreviations: CHD, coronary heart disease; OTU, operational taxonomic unit; PC1, principal coordinate 1; PC2, principal coordinate 2; PCoA, principal coordinates analysis; PD, phylogenetic diversity.](https://oup.silverchair-cdn.com/oup/backfile/Content_public/Journal/jid/219/3/10.1093_infdis_jiy524/1/m_jiy52401.jpeg?Expires=1750262039&Signature=fBQNgWYbsYRraH3IwcQQDTBZGukmCYcU-Qy~LIMRdeTT~eSnBh-2FLQapT-AJqnQkAewzk9xhq-iRm9TT4fTRat~l97Eip6M9SWSun8ed3D0~ttkWQhktPzXKrxHngF-ivc590zQ-9lQMviv1JhDe9d71e5Lo4449nxM4tEBWT16IdEMiBTtUikg~ecd3wCft2Cp0j2MNhtlogFh7UdcdXe0~PERH7KdYwyroXhOVI62qHvShRlbuoa1sT3cz6CKHPpKeGG2t~nY5-K1wjpeKBkV0XUNPEkXyufQ81r1WUOLU5vcsmjpQNIJRHjxMHYVjznDljWg3LMrlG4O-Wh2wQ__&Key-Pair-Id=APKAIE5G5CRDK6RD3PGA)
Coronary heart disease (CHD) is associated with reduced α-diversity and no significant alterations in β-diversity of gut microbiota in human immunodeficiency virus–infected individuals. A, Boxplots indicate α-diversity in CHD+ and CHD– samples using different metrics (Chao1, observed operational taxonomic units [OTUs], Shannon, Simpson, Faith’s phylogenetic diversity, and Gini diversity index). B, Mean relative abundance of the 20 most abundant bacterial genera in CHD+ and CHD– individuals. None was significantly different as calculated by Kruskal–Wallis test and Benjamini–Hochberg false discovery rate correcting for multiple testing. f__;g__ represents OTUs that matched the Greengenes reference database, but could not be assigned below the order level; family (f__) and genus (g__) level were not assigned. ;g__ represents OTUs that matched the Greengenes database and could not be assigned below the family level; genus (g__) level was not assigned. C, Principal coordinates analysis was performed using phylogenetic unweighted and weighted UniFrac, Bray-Curtis, and Binary Jaccard distance matrices. Abbreviations: CHD, coronary heart disease; OTU, operational taxonomic unit; PC1, principal coordinate 1; PC2, principal coordinate 2; PCoA, principal coordinates analysis; PD, phylogenetic diversity.
A pronounced co-occurrence network was found in CHD– individuals composed of 3 modules and consisting of 45 genera and 106 edges with significant positive or negative co-occurrence correlations (Figure 2A). Within each of the 3 modules, exclusively positive correlations were present, while between members of the different modules, strong negative correlations existed. The 2 most abundant genera, Bacteroides and Prevotella, were both integral members of the 2 major modules. No positive correlation existed between genera of both major modules.
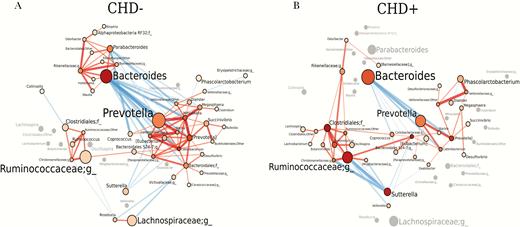
Co-occurrence gut microbiota network is different and less complex in human immunodeficiency virus (HIV)–infected people with coronary heart disease (CHD+) compared with HIV-infected people without coronary heart disease (CHD–). Gut microbiota networks are illustrated for CHD– (A) and CHD+ HIV-infected individuals (B). Genera are represented by nodes; edges indicate significant co-occurrences between genera. Genera are located at the same position in both plots. The size of each node indicates the average abundance of that genus in the corresponding group. Nodes are colored based on their degree, ie, the number of edges. The intensity of the red color of the nodes is increasing with the increase of the number of the genera’s edges. Genera that exhibit a significant co-occurrence only in 1 of the groups are colored in gray in the other group that lacks a co-occurrence partner. The diameters of the edges are weighted based on the absolute value of the co-occurrences and colored blue for negative correlations and red for positive correlations. Abbreviation: CHD, coronary heart disease.
In CHD+ individuals, the co-occurrence network was clearly distinct from that in CHD– individuals. The network included 35 genera and 61 edges with positive or negative co-occurrence (Figure 2B). The network was composed of only 2 network modules, a Prevotella and a Ruminococcaceae module. Bacteroides was also the most abundant genus in CHD+ individuals, but no positive correlation to any other genus existed in CHD+ individuals. In addition, no positive correlation between other Bacteroides module genera of CHD– individuals existed in CHD+ individuals. Negative correlations between genera of the CHD–Bacteroides module and the Prevotella module were limited to correlations of Bacteroides to genera of the Prevotella module and vice versa. In CHD+ individuals, the number of genera constituting the Prevotella network module and number of positive co-occurrence correlations within the Prevotella module was lower compared to that in CHD– individuals. The Ruminococcaceae network module was more pronounced in CHD+ compared with CHD– individuals and also included genera that were part of the Bacteroides network module in CHD– individuals. We also studied associations of cardiovascular medications taken by at least 20% of all individuals (statins, β-blockers, angiotensin-converting enzyme inhibitors, and acetylsalicylic acid) and duration of cART >10 or <10 years with co-occurrence network structures (Supplementary Figure 1). Cardiovascular medications were mainly taken by CHD+ individuals (Supplementary Figure 1A and Table 1), and the networks for individuals taking cardiovascular medications resembled those in CHD+ individuals. Differences in co-occurrence networks were minor between duration of cART >10 or <10 years. Both groups exhibited a Bacteroides network module, in contrast to CHD+ individuals.
Gut Microbiota Associated With TMAO Serum Levels
TMAO serum levels ≥9 µmol/L were found in 7 individuals; 6 of these were CHD+ individuals (Supplementary Figure 2). These high levels were associated with a higher relative abundance of 4 OTUs, belonging to the genera Phascolarctobacterium, Desulfovibrio, Sutterella, and Faecalibacterium (FDR = P < .05). PERMANOVA multivariate analysis and various α-diversity metrics did not differ significantly between the highest TMAO serum levels (TMAO ≥9 µmol/L) and low levels <9 µmol/L (Supplementary Figure 3).
Characteristics of Gut Microbiota Clusters Separated by PCoA
PCoA of unweighted- and weighted UniFrac, Bray-Curtis, and Binary Jaccard distance matrices clearly separated gut microbiota in 2 clusters consisting of 31 and 29 HIV-infected individuals. Individuals of both clusters significantly differed in their sexual behavior (Figure 3). Cluster A was composed of 31 individuals comprising 14 men having sex with men (MSM) (45%) and 17 (55%) heterosexual individuals, and cluster B was composed of 29 individuals including 28 MSM (97%) and 1 heterosexual individual (3%). Known risk factors for HIV transmission for heterosexuals were intravenous drug use (n = 4), transfusion (n = 1), and formerly living in an epidemic HIV region (n = 5) (defined by the Joint United Nations Programme on HIV/AIDS as HIV prevalence ≥1% among the sexual active population between 15 and 49 years of age). The β-diversity of the gut microbiota of both patient clusters was significantly different (P ≤ .001 for all distance matrices). Cluster A individuals were characterized by a Bacteroides-rich and Prevotella-poor gut microbiota (Figure 4A) in comparison to cluster B individuals, who were distinguished by a Prevotella-rich and Bacteroides-poor gut microbiota. In addition to the significantly different relative abundance of the most abundant genera Prevotella and Bacteroides, the gut microbiota of both clusters significantly differed in the relative abundance of 49 other genera, each with a relative abundance of at least 0.01% of the total bacterial sequence counts (Figure 4B).
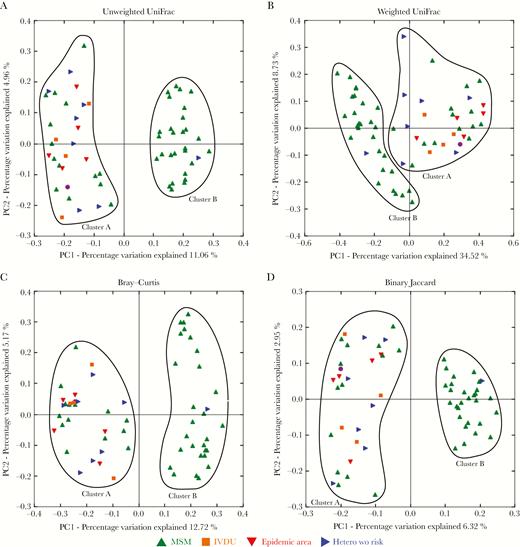
Multidimensional scaling separates gut microbiomes of individuals in clusters associated with sexual preference. Principal coordinates analysis was performed using phylogenetic unweighted UniFrac (A), weighted UniFrac (B), Bray–Curtis (C), and Binary Jaccard (D) distance matrices. Men who have sex with men are represented by green, heterosexual individuals with intravenous drug use by orange, heterosexuals from epidemic human immunodeficiency virus regions by red, heterosexuals with transfusion as way of infection by violet, and heterosexual individuals without known way of infection by blue symbols. Abbreviations: Hetero, heterosexual; IVDU, intravenous drug use; MSM, men who have sex with men; PC1, principal coordinate 1; PC2, principal coordinate 2; wo, without.


Prevotella-rich cluster (cluster A) differs from Bacteroides-rich cluster (cluster B) in the relative abundance of various genera. A, Mean relative abundance of the 20 most abundant bacterial genera of cluster A and cluster B individuals. Significant differences of relative abundance of taxa are denoted with *P < .05, **P < .01, ***P < .001, calculated by Kruskal–Wallis test and Benjamini–Hochberg false discovery rate (FDR) correcting for multiple testing. f__;g__ represents OTUs that matched the Greengenes reference database, but could not be assigned below the order level; family- (f__) and genus (g__) levels were not assigned. ;g__ represents operational taxonomic unit that matched the Greengenes database and could not be assigned below the family level; genus (g__) level was not assigned. B, Heat map showing 51 genera with a relative abundance >0.01% and recognized as differentially abundant with the FDR corrected P value <.05 using Kruskal–Wallis testing in individual patient samples. Individuals belonging to the Bacteroides-rich cluster are illustrated on the bottom part of the y-axis (cluster A), while individuals of the Prevotella-rich cluster are represented on the upper part of the y-axis (cluster B). The relative abundance of genera is visualized in the log scale. The genera highlighted in red were overrepresented in the Bacteroides-rich cluster and genera in blue in the Prevotella-rich cluster. Abbreviations: OTU, operational taxonomic unit.
The α-diversity was higher for MSMs gut microbiota than for gut microbiota of heterosexual individuals (all P < .05; Figure 5A). Among MSM, bacterial richness and evenness were both higher for MSM of the Prevotella-rich cluster (cluster B) than for MSM of the Bacteroides-rich cluster (cluster A) (all P < .05; Figure 5B). Cluster A MSM tended to have a worse immunological CDC stage of HIV infection (stage III, 78.6% vs 35.7%, P = .20) and longer duration of cART (mean, 132.0 ± 57.9 months vs 104.6 ± 56.7 months, P = .15) (Table 2 and Supplementary Table 3). Besides longer therapy duration, cART regimens in Bacteroides-rich MSM were characterized by the use of a higher number and longer use of protease inhibitors (PIs) in their regimens (P = .07 and P = .05) and a longer duration and higher frequency of boosting substances such as ritonavir and cobicistat (P = .034 and P = .08). PCoA illustrates clustering of gut microbiota of MSM according to PI and boosting substances (Supplementary Figure 4). Furthermore, cluster A MSM were characterized by a lower ISCED score (P = .005) and a higher incidence of hyperlipidemia (P = .08) compared with cluster B MSM.
Characteristics of the Bacteroides-Rich Men Who Have Sex With Men (MSM) (Cluster A MSM) and the Prevotella-Rich (Cluster B MSM) Populations
| Characteristic | Cluster A MSM (n = 14) | Cluster B MSM (n = 28) | P Value |
|---|---|---|---|
| Age, y, mean ± SD | 50.9 ± 13.0 | 52.3 ± 10.7 | .72 |
| Coronary heart disease | 8 (57) | 12 (43) | |
| ISCED score, mean ± SD | 3.1 ± 1.2 | 4.2 ± 0.9 | .005 |
| BMI, kg/m2, mean ± SD | 26.6 ± 3.1 | 24.8 ± 3.4 | .11 |
| Age at HIV infection, y, mean ± SD | 37.5 ± 12.6 | 39.1 ± 9.9 | .66 |
| Duration of HIV infection, y, mean ± SD | 13.7 ± 7.1 | 13.2 ± 5.9 | .80 |
| CDC HIV stage—clinical | .29 | ||
| A | 4 (28.6) | 14 (50.0) | |
| B | 5 (35.7) | 6 (21.4) | |
| C (AIDS) | 5 (35.7) | 8 (28.6) | |
| CDC HIV stage—immunological | .20 | ||
| I | … | … | |
| II | 3 (21.4) | 18 (64.3) | |
| III | 11 (78.6) | 10 (35.7) | |
| Ratio CD4/CD8 cells, mean ± SD | 0.56 ± 0.24 | 0.80 ± 0.50 | .10 |
| HIV RNA <50 copies/mL (ART patients only) | 14 (100) | 26 (92.9) | .54 |
| Diabetes mellitus | 4 (28.6) | 4 (14.3) | .41 |
| Hyperlipidemia | 14 (100) | 22 (78.6) | .08 |
| Arterial hypertension | 10 (71.4) | 18(64.3) | .74 |
| Lipodystrophy | 4 (28.6) | 5 (19.2) | .69 |
| Duration of HIV infection, mo | |||
| Mean ± SD | 164.4 ± 85.1 | 158.3 ± 70.5 | .81 |
| Median (IQR) | 138.8 (112–250) | 163.0 (104–192) | .97 |
| Duration of ART, mo | |||
| Mean ± SD | 132.0 ± 57.9 | 104.6 ± 56.7 | .15 |
| Median (IQR) | 134.9 (93–175) | 106.4 (63–153) | .19 |
| Duration of protease inhibitors, mo | |||
| Mean ± SD | 77.1 ± 62.9 | 40.6 ± 51.1 | .05 |
| Median (IQR) | 80.1 (22–124) | 10.6 (0–82) | .06 |
| No. of protease inhibitors in regimen | |||
| Mean ± SD | 3.3 ± 4.0 | 1.6 ± 2.1 | .07 |
| Median (IQR) | 2.5 (1.0–3.8) | 1.0 (0.0–2.0) | .10 |
| Duration of boosting substances, mo | |||
| Mean ± SD | 25 ± 33 | 7 ± 18 | .034 |
| Median (IQR) | 3.2 (0.0–40.8) | … | 1.00 |
| Frequency of boosting substance in cART regimen, mean ± SD | 0.79 ± 0.89 | 0.32 ± 0.72 | .08 |
| History of COPD | 1 (7.1) | 1 (3.8) | 1.00 |
| History of CMV infection | 1 (7.1) | 2 (7.7) | 1.00 |
| History of hepatitis B | 3 (23.1) | 9 (33.3) | .72 |
| History of hepatitis C | 1 (7.1) | 1 (3.8) | 1.00 |
| History of malignancy | 1 (7.1) | 2 (7.7) | 1.00 |
| History of depression | 2 (15.4) | 7 (26.9) | .69 |
| Use of antibiotics within 6 mo before stool sampling | 3 (21.4) | 6 (21.4) | 1.00 |
Data are presented as No. (%) unless otherwise indicated. Metric variables were tested with t tests. Categorical variables were compared by Fisher exact test. Mean ± SD was used for metric variables. For skewed, approximately log-normal distributions, medians and IQRs are reported.
Abbreviations: ART, antiretroviral therapy; BMI, body mass index; cART, combination antiretroviral therapy; CDC, Centers for Disease Control and Prevention; CMV, cytomegalovirus; COPD, chronic obstructive pulmonary disease; HIV, human immunodeficiency virus; IQR, interquartile range; ISCED, International Standard Classification of Education; MSM, men who have sex with men; SD, standard deviation.
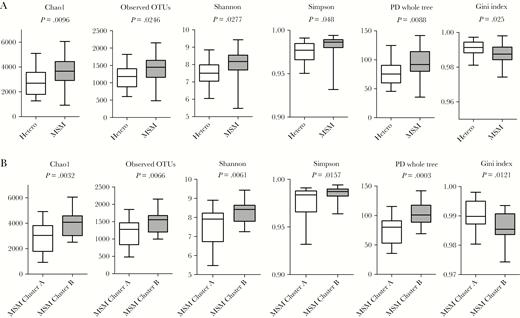
α-Diversity is increased in men who have sex with men (MSM) compared to heterosexuals; MSM of the Bacteroides-rich cluster are characterized by reduced α-diversity of their gut microbiota compared to MSM of the Prevotella-rich cluster. Boxplots show α-diversity in heterosexuals and MSM (A) and among MSM of the Bacteroides-rich cluster (cluster A) and MSM of the Prevotella-rich cluster (cluster B) (B) using different metrics (Chao1, observed operational taxonomic unit, Shannon, Simpson, Faith phylogenetic diversity, and Gini index). Abbreviations: Hetero, heterosexual; MSM, men who have sex with men; OTU, operational taxonomic unit; PD, phylogenetic diversity.
DISCUSSION
Gut microbiota of CHD+ individuals were associated with lower α-diversity and no relevant differences in β-diversity compared with CHD– individuals. Despite insignificant differences in β-diversity, co-occurrence networks between CHD+ and CHD– HIV-infected individuals were clearly divergent. Furthermore, the individuals’ gut microbiomes were separated in 2 distinct PCoA clusters. The Prevotella-rich cluster was constituted of mainly MSM, while the Bacteroides-rich cluster was equally formed by heterosexuals and MSM. MSM were significantly associated with altered α-and β-diversity metrics of the gut microbiota. Among MSM, Bacteroides-rich cluster MSM were characterized by lower α-diversity metrics and tended to have an advanced immunological HIV stage, longer history, and specific characteristics of cART, and lower ISCED score compared with Prevotella-rich cluster MSM.
Our finding of lower microbial α-diversity in CHD+ individuals including species richness, phylogenetic richness, and evenness compared with CHD– individuals correlates with studies in HIV-negative individuals that reported an association between reduced α-diversity and high CHD lifetime risk [21] or increased cardiovascular risk factors such as body mass index and lipid levels [22, 23]. The reduction of phylogenetic richness in CHD+ individuals indicates that the diversity reduction is not limited within a certain phylum.
Differences of gut microbiota β-diversity between CHD+ and CHD– HIV infected individuals were insignificant. In HIV-negative individuals, few associations between increased risk for cardiovascular disease and Enterobacteriaceae, Streptococcus species [24], or OTUs of Bacteroidetes, Firmicutes, and Euryarchaeota had been previously reported [21].
The absence of differences in β-diversity but presence of distinct differences in the bacterial co-occurrence network patterns linked to CHD of our study suggests that network structures rather than single bacterial species might be of relevance for CHD in HIV-infected individuals. Furthermore, other factors, such as cardiovascular medication, may also contribute to alterations of the gut microbiota network structures in CHD+ individuals. Cardiovascular medications were mainly taken by CHD+ individuals and thus we were not able to distinguish effects of CHD and cardiovascular medications on co-occurrence network structures. Although differences in the co-occurrence network structures between cART >10 years and cART <10 years exhibited relatively few differences, duration of cART or HIV infection may nevertheless contribute to differences in α-diversity and the co-occurrence network in CHD.
High TMAO plasma levels were the most significant parameter correlated with CHD risk in a metabolomics study [5]. The OTUs, associated with high TMAO serum levels in our study, belong to phyla that had been shown to be involved in the production of the precursor metabolite trimethylamine (TMA) [25]. These low-abundance OTUs have a higher risk for spurious significance compared to high-abundant OTUs; however, the colonization of mice lacking TMA-producing gut microbiota with TMA-producing species in low relative abundance of 0.15% of the cecal community significantly increased TMAO serum levels [25], indicating that low abundant species may also play a major role for relevant TMAO production.
The separation of the patients’ gut microbiota into 2 PCoA clusters, characterized by Bacteroides and Prevotella as main contributors of the respective cluster and a significantly different relative abundance of other genera, determined 2 distinct enterotypes, which in parts resembled the previously described enterotypes [9]. Sexual behavior clearly discriminated individuals of both enterotypes. The higher relative abundance of the genus Prevotella in MSM is in line with a recent study [8], the first study demonstrating that sexual behavior can impact gut microbiota composition. Prevotella predominance was not associated with diet in this study [8]. Antibiotic treatment was described as an important factor to alter gut microbiota α- and β-diversity [26]. In our study, antibiotic therapies during a period of 6 months before stool sampling were not associated with a certain enterotype.
The impact of sexual behavior on the gut microbiota has been unappreciated in many former studies analyzing gut microbiota in HIV infection. An association of Prevotella richness of gut microbiota and sexual behavior independent of the HIV infection status was just recently strengthened in a study of HIV-negative MSM engaging in condomless receptive anal intercourse compared to people who never engaged in anal intercourse [27]. Hyperosmolar sexual lubricants, used for anal receptive intercourse, have been reported to cause damage of the distal colon epithelium [28] and might affect the gut microbiota composition.
Microbiota has been shown to influence microbicide efficacy in African women using tenofovir vaginal gel for HIV prevention [29]. Certain Prevotella species significantly deplete tenofovir [29], but it is unknown whether the enterotype influences cART efficacy.
Bacterial richness and evenness were significantly higher in MSM compared with heterosexual individuals, a finding which is in line with the findings of Noguera-Julian et al [8]. The percentage of MSM in CHD+ (73%) and CHD– (67%) individuals in our study was similar, indicating that sexual behavior did not play a major role as confounding factor for analysis of the gut microbiota linked to CHD. Prevotella-rich MSM also differed from Bacteroides-rich MSM by an increased α-diversity, which is in line with other reports [8, 30].
In our study, Bacteroides-rich cluster MSM tended to have longer cART history, longer and more frequent usage of PIs including boosting substances like ritonavir and cobicistat in cART regimens, lower ISCED level, and worse immunological HIV CDC stage in comparison to Prevotella-rich cluster MSM. Low α-diversity metrics have been associated with cART previously [31–34]. PI-based regimens have been associated with an increased risk for CHD [2], and combinations with nucleoside reverse transcriptase inhibitors showed the highest impact on the reduction of α-diversity compared with other regimens [34]. We found that educational level, represented by the ISCED score, was significantly higher in MSM of the Prevotella-rich gut microbiota compared to MSM of the Bacteroides-rich gut microbiota. Educational level may influence the food intake and personal hygiene and thereby the gut microbiota composition.
Our patient cohort enabled us to match for factors suspected to affect the gut microbiota composition. Nevertheless, the study is limited by its sample size. Associations linked to ART, HIV stage, and ISCED score should be confirmed by studies focusing on these issues. We also cannot exclude that unknown factors contribute to increase Prevotella abundance in Prevotella-rich MSM.
CONCLUSIONS
Our work showed that CHD in HIV-infected individuals is associated with lower gut microbiota α-diversity and no relevant alterations of β-diversity. Despite insignificant differences in β-diversity, co-occurrence networks were clearly different in CHD– and CHD+ individuals, suggesting that community structures rather than individual species might be a tool for cardiovascular risk assessment. We furthermore identified sexual behavior as a feature to significantly influence gut microbiota β-diversity. Sexual behavior should be controlled in future gut microbiota studies in HIV-infected individuals. Our data furthermore suggest that immunological stage of HIV infection, cART, and educational level might affect the gut microbiota composition.
Supplementary Data
Supplementary materials are available at The Journal of Infectious Diseases online. Consisting of data provided by the authors to benefit the reader, the posted materials are not copyedited and are the sole responsibility of the authors, so questions or comments should be addressed to the corresponding author.
Notes
Author contributions. All authors have substantially contributed to the submitted work. J. K., S. E., J. B., H. S., and N. R. designed the study. V. H. matched the patients for inclusion into the study. S. E. and C. S. explained the study to the patients and enrolled the patients. J. K., J. M., and R. O. conceived and performed the experiments. L. K. H. performed sequencing. J. K., D. H., M. S., F. F., and V. H. analyzed and interpreted the data. J. K., D. H., M. S., and F. F. wrote the manuscript. All authors read and approved the final manuscript in its current form.
Acknowledgments. We thank all of the individuals who participated in the study.
Financial support. This work was in parts supported by the Deutsche Forschungsgemeinschaft (GRK1431) to J. B. and H. S.
Potential conflicts of interest. S. E. and H. S. have both received grants and personal fees from Gilead, Janssen, MSD, and ViiV. All other authors report no potential conflicts of interest. All authors have submitted the ICMJE Form for Disclosure of Potential Conflicts of Interest. Conflicts that the editors consider relevant to the content of the manuscript have been disclosed.
Presented in part: 28th European Congress of Clinical Microbiology, Madrid, Spain, 21–24 April 2018.

