


Abstract
We compared rates of hepatitis B surface antigen (HBsAg) loss and hepatocellular carcinoma (HCC) development in hepatitis B e antigen (HBeAg)-negative patients without cirrhosis who continued or discontinued entecavir.
Patients who discontinued entecavir treatment for at least 12 months (discontinued group; n = 234) and patients who continued entecavir treatment for at least 4 years (continued group; n = 226) were recruited.
In the discontinued group, the 5-year cumulative incidences of virological relapse (VR), clinical relapse (CR), and HBsAg loss were 71.9%, 58.9%, and 13%, respectively. Patients with sustained response, VR but no CR, and CR without retreatment were 49-, 13-, and 18-fold more likely to develop HBsAg loss than those with retreatment. Patients who discontinued entecavir therapy had a higher rate of HBsAg loss than those who continued entecavir therapy, in all and 360 propensity score (PS)-matched patients. Cox regression analysis revealed that the discontinued group was an independent predictor for HBsAg loss. There was no significant difference in HCC development between the 2 groups in all and PS-matched patients.
HBeAg-negative patients without cirrhosis who discontinued entecavir treatment exhibited a higher HBsAg loss rate without an increased risk of HCC compared to those who continued entecavir treatment.
Nucleos(t)ide analogues (NAs) are widely used in the treatment of chronic hepatitis B (CHB) and are very effective at suppressing viral replication. However, the rate of hepatitis B surface antigen (HBsAg) loss is low [1, 2] and virological relapse is common after cessation of NA therapy [3–6].
Our previous study showed that the 3-year virological and clinical relapse rates for hepatitis B e antigen (HBeAg)-negative patients after stopping entecavir therapy were 64.3% and 51.6%, respectively [6]. Despite the high hepatitis B virus (HBV) relapse rates, the incidence of HBsAg loss was relatively high in patients who achieved a sustained response off therapy [5, 7]. Long-term NA therapy is associated with a reduction in hepatocellular carcinoma (HCC). It is not known whether the cessation of NA therapy would blunt this effect. Our recent study showed that HBeAg-negative patients with cirrhosis who discontinued NA treatment exhibited a higher rate of HBsAg loss without an increased risk of HCC compared to those who continued entecavir treatment [8]. Further studies are needed to compare the incidences of HBsAg loss and HCC between patients without cirrhosis who discontinue or continue NA therapy.
The aims of this study were to (1) investigate the long-term rates of HBV relapse, HBsAg loss, and HCC development after cessation of entecavir therapy and (2) compare the incidences of HBsAg loss and HCC development in HBeAg-negative CHB patients without cirrhosis who discontinued or continued entecavir therapy.
METHODS
Patients
HBeAg-negative patients without cirrhosis who were prescribed entecavir were enrolled in 1 of 2 groups (discontinued or continued groups) based on whether they discontinued or remained on treatment after government reimbursement for the drugs was terminated. At the initiation of entecavir therapy, all patients had been seropositive for HBsAg for more than 6 months and had a viral load of ≥2000 IU/mL. Supplementary Figure 1 shows the flow chart of patients enrolled in the discontinued and continued groups.
A total of 234 patients were enrolled in the discontinued group at Kaohsiung Chang Gung Memorial Hospital. This group consist of patients who had been previously treated with entecavir (mean treatment duration 168.9 ± 41.1 weeks) and for whom at least 12 months of posttreatment follow-up data were available. All patients fulfilled the stopping criteria set forth by the Asian Pacific Association for the Study of the Liver (APASL) 2012 and 2015 [9, 10]. APASL 2012 and 2015 recommend in HBeAg-negative patients, treatment discontinuation can be considered if patients have been treated for at least 2 years with undetectable HBV DNA documented on 3 separate occasions that are at least 6 months apart [9, 10]. Of the 234 patients, 52 (22.2%) and 16 (6.8%) received NA and interferon, respectively, before entecavir treatment. Taiwan’s National Health Plan reimbursed oral antiviral agents for CHB patients without cirrhosis for 3 years. Thus, 74.5% of patients discontinued NA therapy according to the criteria to avoid bearing the expense of the drug.
A total of 226 consecutive NA-naive patients who had continued entecavir monotherapy for at least 4 years (mean treatment duration 369.6 ± 103.7 weeks) were enrolled in the continued group. Members of this group received treatment at either Kaohsiung Chang Gung Memorial Hospital (83 patients) or China Medical University Hospital (143 patients). All patients achieved a virological response (HBV DNA < 20 IU/mL) at 3 years of treatment. These patients continued entecavir therapy at their own expense when the health insurance payment ended by the patient’s decision. The major reason for patients to continue entecavir therapy was that they were afraid of HBV relapse after cessation of NA therapy.
For both groups, patients were excluded if they showed evidence of autoimmune hepatitis or alcoholic liver disease, or tested positive for markers of hepatitis C virus, hepatitis D virus, or human immunodeficiency virus. Patients were also excluded if they had HBsAg loss or HCC at the end of treatment (discontinued group) or at 3 years of treatment (continued group).
The diagnosis of HCC was made according to the guidelines of the American Association for the Study of Liver Diseases [11]. Noncirrhosis was diagnosed based on the biopsy (n = 135), liver stiffness or fibrosis 4 (FIB-4) measurement, or combined repeated ultrasound findings [12]. Posttreatment virological relapse was defined as the reappearance in serum of HBV DNA levels >2000 IU/mL in 2 consecutive measurements at least 3 months apart after stopping entecavir [5–7]. Clinical relapse was defined as an episode of elevated alanine aminotransferase (ALT) >2 times the upper limit of normal (ULN, 40 U/L) and an HBV-DNA level >2000 IU/mL [9]. The duration of consolidation therapy was calculated from the first demonstration of undetectable HBV DNA levels to the end of treatment. The FIB-4 index was calculated using the following formula: aspartate aminotransferase (AST) (U/L) × age (years) / platelet count (109/L) × ALT (U/L)1/2. An FIB-4 index >3.25 represented advanced fibrosis [13].
The criteria for retreatment of HBeAg-negative patients without cirrhosis by Taiwan’s National Health Plan were ALT ≥2 times ULN on 2 occasions at least 3 months apart and HBV DNA ≥2000 IU/mL. The criteria for retreatment of decompensated patients were total biliruin ≥2 mg/dL or prothrombin time prolongation ≥3 seconds regardless of HBV DNA levels.
This study was conducted in accordance with the 1975 Declaration of Helsinki. All patients provided written informed consent, and the study was approved by the Research Ethics Committees of Chang Gung Memorial Hospital and China Medical University Hospital.
Methods
Patients in the discontinued group were followed up every 1–2 months in the first 6 months and then every 3 months during off-therapy follow-up until their last visit. Additional biweekly or weekly visits were established if ALT levels increased beyond the ULN. Serum HBV DNA was assayed every 3 months for the first 12 months after cessation of therapy and every 3–6 months thereafter. HBsAg was quantified retrospectively using stored serum collected prior to initiation of treatment, at 12 months, and at the end of treatment. HBsAg was assessed every 6–12 months after cessation of treatment until HBsAg loss or last visit. Stored serum samples were frozen at −20°C until use.
Patients in the continued group were followed up every 1–3 months during entecavir treatment. HBV DNA levels were determined for every patient before therapy and every 6 months during treatment. Because the mean duration of treatment in the discontinued group was 169 weeks and most patients discontinued NA therapy according to the criteria of Taiwan’s National Health Plan (3 years), serum HBsAg was quantified retrospectively at baseline, and at 12 and 36 months of treatment in the continued group. HBsAg was assessed every 6–12 months after 36 months of treatment until HBsAg loss or last visit during treatment.
To compare the incidence of HBsAg loss and HCC development between the 2 groups, the entry dates were at the end of treatment in the discontinued group until last follow-up (including nonretreatment and retreatment group; mean duration after discontinued NA therapy 207.6 ± 87.7 weeks) and after 3 years of treatment in the continued group (mean treatment duration after 3 years of treatment 207.3 ± 102.4 weeks).
Serology
The presence of HBeAg, anti-HBe antibodies, and anti-hepatitis C virus antibodies were determined using commercial assay kits (Abbott, North Chicago, IL). HBsAg titers were quantified using the Elecsys HBsAg II Quant reagent kit (Roche Diagnostics, Indianapolis, IN) at Kaohsiung Chang Gung Memorial Hospital and Abbott Architect HBsAg QT assay at China Medical University Hospital (dynamic range 0.05–250 IU/mL). Serum HBV DNA was quantified using the COBAS TaqMan HBV test (CAP-CTM; Roche Molecular Systems, Inc., Branchburg, NJ), which had a lower limit of detection of 20 IU/mL.
HBV Genotyping
HBV genotypes were determined using the restriction fragment length polymorphism on the surface gene (between nucleotide positions 256 and 796), as described previously [14].
Statistical Analyses
Data are presented as the mean and standard deviation (SD) or proportions. To compare the values between the 2 groups, Χ2 tests were used to analyze categorical variables and Student t test was used to analyze continuous variables. The Kaplan–Meier method with log-rank test was used to analyze the cumulative incidences of virological and clinical relapses in the discontinued group, as well as HBsAg loss and HCC development in both groups. Univariate and multivariate analyses were performed to identify the factors associated with virological and clinical relapses in the discontinued group and HBsAg loss and HCC development in both groups using the Cox proportional hazard regression model. Variables of P < .5 in univariate analysis were included in the multivariate analysis, and variables in the multivariate analysis of P < .05 were retained in the model. Multiple imputation was used to deal with missing data (n = 29) in the FIB-4 index at entry. A time-dependent receiver-operating characteristic (ROC) curve analysis was used to assess the optimal HBsAg cutoff value for predicting HBsAg loss in the discontinued group [15]. All statistical tests were 2-sided at P < .05 of significance.
The propensity score (PS)-matching method was used to reduce the significant differences in clinical features between the groups at baseline and entry. The variables used in the model included: age, sex, ALT level, bilirubin, HBV genotype, platelet count, and HBV DNA level at baseline; duration of consolidation; HBsAg level at baseline and entry; and FIB-4 index at entry. Caliper matching was performed on the PS (nearest available matching). Pairs (discontinued and continued groups) on the PS logit were matched to within a range of 0.2 SD [16].
RESULTS
Clinical Features of All and Propensity Score-Matched Patients Who Discontinued or Continued Entecavir Treatment
The clinical features at baseline and entry of the study population are shown in Table 1. Members of the discontinued group were younger, a higher proportion were male, they had higher bilirubin levels, and had lower end-of-treatment HBsAg levels than did members of the continued group. The PS-matching method yielded 180 patients each in the discontinued and continued groups. There were no significant differences in clinical features or HBsAg levels between the 2 groups (Table 1).
Comparisons of Clinical Features of All Patients and Propensity Score-Matched Patients who Discontinued or Continued Entecavir Treatment at Baseline and Study Entrya
| Variables | All Patients, Mean ± SD or n (%) | Propensity Score-Matched Patients, Mean ± SD or n (%) | ||||
| Discontinued Group | Continued Group | Discontinued Group | Continued Group | |||
| (n = 234) | (n = 226) | P value | (n = 180) | (n = 180) | P value | |
| Start entecavir treatment | ||||||
| Age, y | 50.2 ± 10.5 | 52.6 ± 10.3 | .013 | 51.4 ± 9.8 | 51.2 ± 10.3 | .84 |
| Sex, male: female | 188:46 | 162:64 | .029 | 137:43 | 140:40 | .71 |
| AST, U/L | 211.5 ± 328.0 | 165.4 ± 284.1 | .11 | 190.7 ± 316.5 | 178.3 ± 295.6 | .70 |
| ALT, U/L | 329.5 ± 479.0 | 258.0 ± 408.1 | .10 | 278.2 ± 427.4 | 288.1 ± 442.9 | .83 |
| Total bilirubin, mg/dL | 2.03 ± 2.85 | 1.41 ± 2.01 | .01 | 1.54 ± 1.68 | 1.50 ± 2.22 | .89 |
| HBV DNA, log10 IU/mL | 5.58 ± 1.56 | 5.64 ± 1.40 | .66 | 5.55 ± 1.47 | 5.65 ± 1.45 | .53 |
| HBV genotype | ||||||
| B | 185 (79.0%) | 182 (80.5%) | .70 | 140 (77.8%) | 142 (78.9%) | .80 |
| C | 49 (21.0%) | 44 (19.5%) | 40 (22.2%) | 38 (21.1%) | ||
| Platelet, ×103/μL | 185.9 ± 55.2 | 181.2 ± 49.4 | .33 | 181.8 ± 49.8 | 187.5 ± 52.3 | .29 |
| FIB-4 index | 3.17 ± 3.47 | 2.93 ± 2.87 | .44 | 3.20 ± 3.69 | 2.83 ± 2.77 | .28 |
| HBsAg at baseline, log10 IU/mL | 3.01 ± 0.80 | 3.07 ± 0.73 | .50 | 3.03 ± 0.71 | 3.05 ± 0.73 | .81 |
| HBsAg at 12 mo of treatment | 2.75 ± 0.69 | 2.82 ± 0.53 | .10 | 2.79 ± 0.61 | 2.79 ± 0.55 | .86 |
| End of treatment (discontinued group) or 3 y of treatment (continued group) | ||||||
| Age, y | 53.4 ± 10.4 | 55.6 ± 10.3 | .26 | 54.6 ± 9.9 | 54.2 ± 10.3 | .69 |
| AST, U/L | 25.3 ± 10.4 | 27.2 ± 10.9 | .055 | 25.4 ± 10.4 | 26.5 ± 10.1 | .43 |
| ALT, U/L | 26.6 ± 16.1 | 27.6 ± 17.2 | .54 | 26.6 ± 16.8 | 27.4 ± 16.4 | .65 |
| Total bilirubin, mg/dL | 0.93 ± 0.36 | 0.92 ± 0.42 | .98 | 0.91 ± 0.34 | 0.93 ± 0.42 | .68 |
| HBV DNA < 20 IU/mL | 234 (100%) | 226 (100%) | 1.0 | 180 (100%) | 180 (100%) | 1.0 |
| FIB-4 index | 1.67 ± 0.89 | 1.77 ± 0.93 | .25 | 1.74 ± 0.89 | 1.65 ± 0.86 | .39 |
| HBsAg, log10 IU/mL | 2.54 ± 0.84 | 2.64 ± 0.55 | .042 | 2.64 ± 0.64 | 2.61 ± 0.58 | .62 |
| Consolidation duration, wk | 138.7 ± 43.8 | 129.9 ± 23.8 | .008 | 132.2 ± 37.8 | 129.9 ± 20.5 | .22 |
Abbreviations: ALT, alanine aminotransferase; AST, aspartate aminotransferase; FIB-4, fibrosis 4; HBsAg, hepatitis B surface antigen; HBV, hepatitis B virus; SD, standard deviation.
aStudy entry was defined as the end of treatment (discontinued group) or 3 years of treatment (continued group).
Incidences and Predictors of Virological Relapse, Clinical Relapse, HBsAg Loss, and Clinical Outcomes in the Discontinued Group
Of the 234 patients, 162 and 127 experienced virological and clinical relapses, respectively. The cumulative incidences of virological relapse at 1, 3, and 5 years were 49.1%, 67.3%, and 71.9%, respectively, and clinical relapse were 37.4%, 52.6%, and 58.9%, respectively. Cox regression analyses revealed that the older age at entry (increased per 1 year hazard ratio [HR], 1.04; 95% confidence interval [CI], 1.03–1.06; P < .001), HBV genotype B (HR, 1.80; 95% CI, 1.18–2.75; P = .007), higher baseline HBV DNA (increased per 1 log IU/mL HR, 1.14; 95% CI, 1.03–1.27; P = .011), and higher end-of-treatment HBsAg levels (HR, 2.10; 95% CI, 1.61–2.73; P < .001) were the independent predictors of virological relapse. Older age at entry (HR, 1.04; 95% CI, 1.02–1.06; P < .001), HBV genotype B (HR, 2.42; 95% CI, 1.50–4.03; P = .001), and higher end-of-treatment HBsAg levels (HR, 2.50; 95% CI, 1.81–3.47; P < .001) were the independent predictors of clinical relapse.
Of the 234 patients, 29 experienced HBsAg loss at the last follow-up. The cumulative incidences of HBsAg loss at 1, 3, and 5 years were 2.1%, 7.8%, and 13%, respectively. Cox regression analyses revealed that longer treatment duration and lower end-of-treatment HBsAg levels were the independent predictors of HBsAg loss (Table 2). We divided the patients into 4 subgroups based on their relapse pattern: group I, patients with sustained response (no virological relapse; n = 59); group II, patients with virological relapse but no clinical relapse and retreatment (n = 37); group III, patients with clinical relapse without retreatment (n = 27); and group IV, patients with HBV relapse who received retreatment (n = 111). Of the 37 patients in group II, 15 experienced transient HBV DNA elevation (>2000 IU/mL) and 22 experienced persistent or intermittent HBV DNA elevation during follow-up. Eight patients experienced ALT elevation (41–79 U/L). Of the 27 patients in group III, 19 (70.3%) experienced only 1 episode of ALT >2 times ULN during follow-up. Of the 111 retreated patients (group IV), 20 (18%) did not meet the criteria of Taiwan’s reimbursement plan, and 95 received continued NA treatment at the last follow-up and 16 discontinued NA retreatment during follow-up.
Factors Predictive of HBsAg Loss After Cessation of Entecavir Treatment in the Discontinued Group
| Variable | Comparison | Univariate Analysis | Multivariate Analysis | ||
| HR (95% CI) | P Value | HR (95% CI) | P value | ||
| Age, y | Increase per y | 1.02 (0.98–1.06) | .36 | ||
| Sex | Male vs female | 1.10 (0.45–2.72) | .83 | ||
| ALT, U/L | Increase per U/L | 1.000 (1.000–1.001) | .57 | ||
| ALT, U/L | <2×, 2-5 ×, and >5 × ULN | 0.91 (0.60–1.39) | .66 | ||
| Total bilirubin | Increase per mg/dL | 0.99 (0.87–1.13) | .89 | ||
| HBV DNA | Increase per log copies/mL | 0.71 (0.57–0.89) | .003 | ||
| FIB-4 index at baseline | Increase per 1 unit | 0.98 (0.88–1.04) | .78 | ||
| HBV genotype | C vs B | 1.20 (0.51–2.83) | .67 | ||
| NA-naive status | Yes vs no | 0.46 (0.22–0.97) | .042 | ||
| Prior interferon use | Yes vs no | 1.01 (0.24–4.24) | .993 | ||
| HBsAg at baseline | Increase per log IU/mL | 0.37 (0.24–0.56) | <.001 | ||
| HBsAg at 12 mo | Increase per log IU/mL | 0.26 (0.17–0.40) | <.001 | ||
| HBsAg at end of treatment | Increase per log IU/mL | 0.24 (0.17–0.34) | <.001 | 0.24 (0.17–0.34) | <.001 |
| HBsAg at end of treatment | <150 vs ≥150 IU/mL | 11.63 (4.93–27.48) | <.001 | ||
| HBsAg decline from baseline to end of treatment | Increase per log IU/mL | 2.31 (1.60–3.32) | <.001 | ||
| FIB-4 index at the end of treatment | Increase per 1 unit | 1.05 (0.69–1.62) | .82 | ||
| Treatment duration | Increase per wk | 1.011 (1.004–1.017) | .002 | 1.006 (1.000–1.013) | .045 |
| Consolidation duration | Increase per wk | 1.011 (1.004–1.017) | .001 | ||
| ≥78 vs <78 wk | 1.92 (0.24–15.07) | .54 | |||
| ≥104 vs <104 wk | 1.67 (0.46–6.08) | .43 | |||
| ≥130 vs <130 wk | 0.76 (0.36–1.61) | .47 | |||
| ≥156 vs <156 wk | 2.53 (1.17–5.46) | .018 |
Abbreviations: ALT, alanine aminotransferase; CI, confidence interval; ETV, entecavir; FIB-4, fibrosis 4; HR, hazard ratio; LAM, lamivudine; ULN, upper limit of normal.
The 5-year cumulative incidences of HBsAg loss were 39.1%, 12.8%, 18.2%, and 0% in group I, II, II, and IV, respectively (Figure 1A). Patients in group I, II, and III were 49-fold (HR, 49.58; 95% CI, 6.55–375.39; P < .001), 13-fold (HR, 13.31; 95% CI, 1.54–114.92; P = .019), and 18-fold (HR, 18.63; 95% CI, 2.08–166.74; P < .001) more likely to develop HBsAg loss than those in group IV.
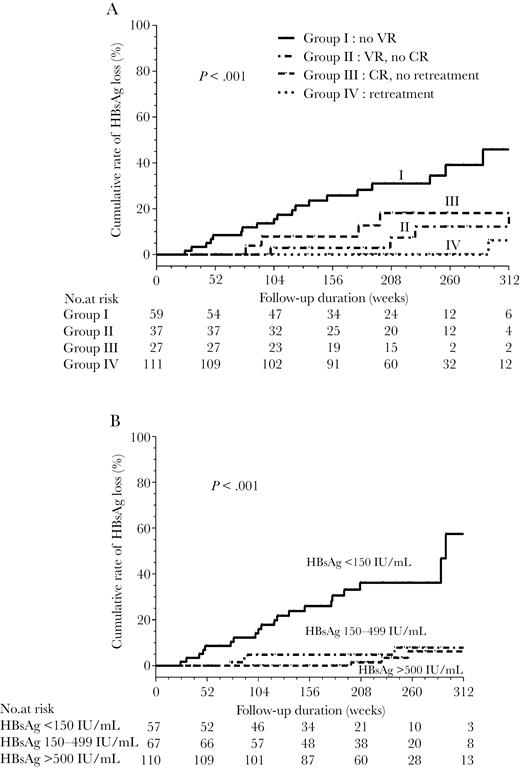
The incidence of hepatitis B surface antigen (HBsAg) loss in the discontinued group according to (A) relapse pattern and (B) HBsAg levels at the end of treatment. Abbreviations: CR, clinical relapse; VR, virological relapse.
The time-dependent ROC analysis revealed that the best end-of-treatment HBsAg cutoff value for predicting HBsAg loss within 5 years after stopping entecavir treatment was 151.3 IU/mL (area under the ROC curve, 0.857). We used an HBsAg level of 150 IU/mL as the optimal value. The sensitivity, specificity, positive predictive values, and negative predictive values of HBsAg level of 150 IU/ml for HBsAg loss at 5 years after cessation of entecavir treatment were 76%, 86.9%, 32.2%, and 96.6%, respectively. Of the patients who achieved HBsAg levels <150, 150–499, and ≥500 IU/mL, the cumulative rates of HBsAg loss at 5 years were 36.2%, 8%, and 6.8%, respectively (P < .001; Figure 1B). The rate of HBsAg <150 IU/mL was 29/59 (49.2%), 10/37 (27.0%), 3/27 (11.1%), and 15/111 (13.5%) in group I, II, III, and IV, respectively. Group I had a higher rate of HBsAg <150 IU/mL than group II (P = .032), III (P = .001), and IV (P < .001). There was no significant difference in the rate of HBsAg <150 IU/mL between groups II, III, and IV (P > .05).
Of the total 234 patients, 2 experienced ALT flares with hepatic decompensation (bilirubin ≥ 3 mg/mL and prolonged prothrombin time ≥ 3 seconds), and neither died following timely retreatment. Nine patients developed HCC (3 developed HCC after retreatment and 6 developed HCC during follow-up without retreatment). The cumulative incidence of posttreatment HCC at 6 years was 4.1%. FIB-4 index at end of treatment was an independent factor of HCC development (HR, 1.81; 95% CI, 1.02–3.23; P = .043). Three patients developed HCC after experiencing HBsAg loss. Of the 111 retreated patients, 1 experienced HBsAg loss during retreatment.
Comparison of HBsAg Loss Between the Continued and Discontinued Groups for All and Propensity Score-Matched Patients
Of the total 226 patients in the continued group, 4 patients (HBsAg levels 27.06, 31.36, 67.33, and 79.14 IU/mL at 3 years of treatment) experienced HBsAg loss after additional 179, 208, 345, and 365 weeks of entecavir treatment, respectively. The incidence of HBsAg loss was higher in the discontinued group than in the continued group for all patients (P < .001, Figure 2A). Cox regression analyses revealed that lower HBsAg levels (per 1 log10 increase HR, 0.21; 95% CI, 0.15–0.30; P < .001) and the discontinued group (HR, 4.78; 95% CI, 1.61–14.21; P = .005) were the independent predictors of HBsAg loss for all patients.
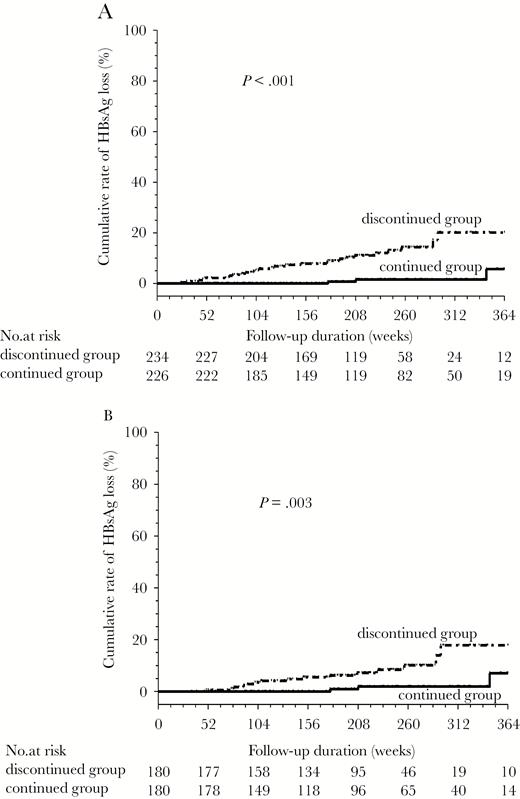
Comparison of the incidences of hepatitis B surface antigen (HBsAg) loss between the discontinued and continued groups: (A) all patients and (B) the 360 propensity score-matched patients.
In the 360 PS-matched patients, the incidence of HBsAg loss was higher in the discontinued group than in the continued group (P = .003; Figure 2B). Cox regression analyses also revealed that lower HBsAg levels and the discontinued group were the independent predictors of HBsAg loss (Table 3).
Factors Predictive of HBsAg Loss for the 360 Propensity Score-Matched Patients
| Variable | Comparison | Univariate Analysis | Multivariate Analysis | ||
| HR (95% CI) | P value | HR (95% CI) | P value | ||
| Start entecavir treatment | |||||
| Age | Increase per y | 1.03 (0.98–1.08) | .22 | ||
| Sex | Male vs female | 0.77 (0.30–1.98) | .59 | ||
| ALT | Increase per U/L | 1.000 (0.999–1.001) | .82 | ||
| ALT, U/L | <2×, 2-5 ×, and >5 × ULN | 0.94 (0.55–1.63) | .83 | ||
| Total bilirubin | Increase per mg/dL | 1.01 (0.81–1.26) | .93 | ||
| Prior interferon use | Yes vs no | 0.28 (0.04–2.08) | .21 | ||
| HBV DNA at baseline | Increase per 1 unit | 0.68 (0.50–0.92) | .012 | ||
| HBV genotype, C vs B | C vs B | 0.90 (0.30–2.69) | .85 | ||
| Platelet | Increase per 103/μL | 1.000 (0.992–1.009) | .92 | ||
| FIB-4 index | Increase per 1 unit | 1.01 (0.90–1.14) | .83 | ||
| HBsAg at baseline | Increase per log10 IU/mL | 0.26 (0.15–0.46) | <.001 | ||
| HBsAg at 12 mo of treatment | Increase per log10 IU/mL | 0.18 (0.09–0.36) | <.001 | ||
| Groups | Discontinued vs continued | 4.53 (1.52–13.56) | .007 | 5.27 (1.72–16.14) | .004 |
| End of treatment (discontinued group) or 3 y of treatment (continued group) | |||||
| Age, per y | Increase per y | 1.03 (0.99–1.08) | .19 | ||
| ALT, U/L | Increase per U/L | 0.97 (0.92–1.01) | .14 | ||
| Total bilirubin, mg/dL | Increase per mg/dL | 0.38 (0.07–1.92) | .24 | ||
| FIB-4 index, per 1 unit | Increase per 1 unit | 1.17 (0.72–1.92) | .53 | ||
| HBsAg, per log10 IU/mL | Increase per log10 IU/mL | 0.12 (0.06–0.23) | <.001 | 0.11 (0.05–0.21) | <.001 |
| HBsAg, <150 vs ≥150 IU/mL | Yes vs no | 14.04 (5.06–38.97) | <.001 | ||
| HBsAg decline from baseline | Increase per log10 IU/mL | 1.32 (0.66–2.46) | .47 | ||
| Consolidation duration, per wk | Increase per wk | 1.012 (1.001–1.022) | .025 | ||
| ≥78 vs <78 wk | 0.84 (0.11–6.56) | .87 | |||
| ≥104 vs <104 wk | 0.81 (0.23–2.87) | .75 | |||
| ≥130 vs <130 wk | 0.82 (0.33–2.04) | .66 |
Abbreviations: ALT, alanine aminotransferase, CI, confidence interval; FIB-4, fibrosis 4; HBsAg, hepatitis B surface antigen; HBV, hepatitis B virus; HR, hazard ratio.
Comparison of HCC Development in the Continued and Discontinued Groups of All and Propensity Score-Matched Patients
In the continued group, 7 patients developed HCC after 3 years of treatment. For all patients, there was no significant difference in HCC development between members of the discontinued and continued groups (P = .70; Figure 3A). Cox regression analyses showed that higher HBV DNA at baseline (HR, 1.39; 95% CI, 1.02–1.91; P = .036), and higher FIB-4 index (HR, 1.89; 95% CI, 1.25–2.86; P = .002) and lower HBsAg levels (HR, 0.48; 95% CI, 0.27–0.82; P = .008) at entry were the independent predictors of HCC development for all patients. There was no significant difference in terms of HCC development between the discontinued and continued group in patients with (n = 32; P = .91) and without advanced fibrosis at entry (n = 438; P = .60). Furthermore, there were no significant differences in HCC development between members of the discontinued group without retreatment (n = 123) and the continued group (P = .73) or between members of the discontinued group who were retreated (n = 111) and the continued group (P = .91).
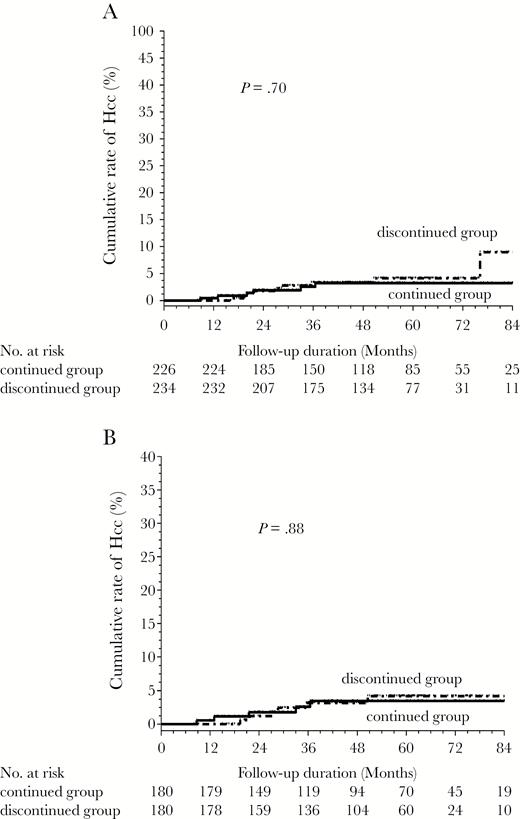
Comparison of the incidences of hepatocellular carcinoma between the discontinued and continued groups: (A) all patients and (B) the 360 propensity score-matched patients.
In the 360 PS-matched patients, there was no significant difference in HCC development between the members of the discontinued and continued groups (P = .88) (Figure 2B). Cox regression analyses showed that FIB-4 index at entry were the independent predictors of HCC development (Table 4).
Factors predictive of hepatocellular carcinoma for the 360 propensity score-matched patients
| Variable | Univariate analysis | Multivariate analysis | ||
| HR (95% CI) | P value | HR (95% CI) | P value | |
| Start entecavir treatment | ||||
| Age, per y | 1.09 (1.03–1.16) | .003 | ||
| Sex, male vs female | 0.56 (0.17–1.86) | .34 | ||
| ALT, per U/L | 0.998 (0.995–1.001) | .32 | ||
| ALT (U/L), <2x, 2-5x, and >5x ULN | 1.00 (0.48–2.09) | 1.0 | ||
| Total bilirubin, per mg/dL | 0.77 (0.40–1.50) | .44 | ||
| Prior interferon use | 2.40 (0.63–9.08) | .20 | ||
| HBV DNA at baseline, log10 IU/mL | 1.27 (0.87–1.86) | .22 | ||
| HBV genotype, C vs B | 0.31 (0.04–2.42) | .26 | ||
| Platelet, per 103/μL | 0.996 (0.984–1.01) | .51 | ||
| FIB-4 index, per 1 unit | 1.06 (0.97–1.16) | .17 | ||
| HBsAg at baseline, per log10 IU/L | 0.88 (0.41–1.88) | .73 | ||
| HBsAg at 12 mo of treatment, per log10 IU/L | 0.66 (0.26–1.69) | .39 | ||
| Groups, discontinued vs continued | 0.92 (0.30–2.85) | .88 | ||
| End of treatment (discontinued group) or 3 y of treatment (continued group) | ||||
| Age, per y | 1.09 (1.03–1.16) | .004 | ||
| ALT, U/L | 0.99 (0.95–1.03) | .61 | ||
| Total bilirubin, mg/dL | 0.10 (0.01–0.92) | .042 | ||
| FIB-4 index, per 1 unit | 1.94 (1.25–3.01) | .003 | 1.94 (1.25–3.01) | .003 |
| HBsAg, per log10 IU/L | 0.56 (0.24–1.32) | .19 | ||
| HBsAg, <150 vs ≥150 IU/mL | 0.93 (0.20–4.31) | .93 | ||
| HBsAg decline from baseline, per log10 IU/L | 1.29 (0.56–2.99) | .55 | ||
| Consolidation duration, per wk | 1.00 (0.98–1.02) | .69 |
Abbreviations: ALT, alanine aminotransferase; CI, confidence interval; FIB-4, fibrosis 4; HBsAg, hepatitis B surface antigen; HBV, hepatitis B virus; HR, hazard ratio.
DISCUSSION
We demonstrated that the 5-year incidences of virological and clinical relapse, and HBsAg loss were 71.9%, 58.9%, and 13%, respectively, in HBeAg-negative patients without cirrhosis who discontinued entecavir therapy. One previous study showed that 13 out of 18 patients (72%) who achieved a sustained response after stopping adefovir therapy were clear of HBsAg [7]. One previous study showed that patients with HBsAg levels ≤100 IU/mL were 15-fold more likely to develop confirmed HBsAg loss after treatment discontinuation [17]. A recent study showed that the incidence of HBsAg seroclearance after stopping NA was much higher than that during therapy (annual incidence 1.78% versus 0.15%) and was highest in patients without virological and clinical relapse. Patients with clinical relapse who remained untreated had a 7.34 times higher incidence of HBsAg clearance than those who received retreatment [18]. Our result was consistent with this recent study [18]. Our study showed that patients with clinical relapse who remained untreated were 18 times more likely to develop HBsAg loss than those who received retreatment. In our study, 70.3% of patients with CR without retreatment experienced only 1 episode of ALT >2 times ULN during follow-up, These findings support the concept that these patients with transient ALT elevation and subsequent decrease in viral load might have better immune control.
NAs have potent antiviral activity but do not have a direct immunomodulatory effect. Thus, HBsAg seroclearance is rare during NA treatment [1, 19, 20]. Our study found that patients who discontinued entecavir therapy had a higher rate of HBsAg loss than did those who continued entecavir therapy in all and the PS-matched patients. Similar findings were observed in our recent study and a randomized study of tenofovir [8, 21]. Although host HBV-specific T-cell immunity may be modulated and recovered during long periods of HBV suppression by NA treatment [22], the immune system also needs reexposure to the DNA of the replicating virus to trigger an efficient response [23]. Thus, patients who discontinued NA therapy are more likely to experience HBsAg loss than those who maintained NA therapy.
Recent studies have shown that NA therapy can be safely stopped if proper off-therapy monitoring is implemented and retreated in a timely manner [6, 24]. In the present study, 2 patients experienced ALT flares with hepatic decompensation, but neither died after retreatment. Thus, the frequency of hepatic decompensation was low (<1%) in HBeAg-negative patients without cirrhosis when proper off-therapy monitoring and timely retreatment were implemented.
Previous studies have demonstrated that long-term entecavir treatment could reduce the incidence of HCC in Asian patients with cirrhosis [25–27]. It is not known whether the cessation of NA therapy would blunt this effect. Recent studies have shown that the incidence of HCC following cessation of NA therapy was not higher than in those who continued NA therapy [8, 28]. In the present study, members of the discontinued group did not exhibit an increased risk of HCC compared with members of the continued group for all or PS-matched patients. FIB-4 index at entry (but not baseline) was an independent predictor of HCC. A meta-analysis study presented that FIB-4 is helpful for predicting advanced fibrosis and cirrhosis in CHB patients [29]. The presence of advanced liver fibrosis or cirrhosis was associated with HCC. The FIB-4 index at entry may obviate the confounding influence of necroinflammation on fibrosis measurement and thus provide a more appropriate reflection of the actual degree of fibrosis than the baseline level. However, our study found that there was no significant difference in terms of HCC development between the discontinued and continued groups in patients with and without advanced fibrosis at entry.
This retrospective study has a few limitations. First, the treatment assignments were not randomized. There were differences in baseline characteristics between the 2 groups. Recent studies demonstrated that serum HBsAg levels are highly predictive of HBV relapse after stopping NA therapy [5, 6]. In our study, HBsAg was quantified retrospectively using stored serum in the 2 groups. Thus, our patients who continued or discontinued entecavir therapy were not decided by serum HBsAg or fibrosis levels. In addition, we used the PS matching method to reduce the significant differences at the end of treatment (discontinued group) or 3 years of treatment (continued group) between the 2 groups. The discontinued group remained as an independent factor in HBsAg loss without an increased risk of HCC in PS-matched patients. Second, we only included Asian populations and evaluated entecavir use. Thus, it is unclear whether the results are applicable to other HBV genotypes or for those who have discontinued tenofovir therapy.
In conclusion, patients who discontinue entecavir therapy may exhibit a higher likelihood of achieving HBsAg loss compared with those who continue entecavir therapy. Patients who stopped entecavir therapy, including those who did not receive retreatment and were retreated, did not show an increased risk of developing HCC compared with those who continued entecavir therapy.
Supplementary Data
Supplementary materials are available at The Journal of Infectious Diseases online. Consisting of data provided by the authors to benefit the reader, the posted materials are not copyedited and are the sole responsibility of the authors, so questions or comments should be addressed to the corresponding author.
Notes
Financial support. This work was supported by the Ministry of Science and Technology Taiwan (grant number NMRPG8E6041).
Potential conflicts of interest. C.-Y. P. has served as an advisory committee member for AbbVie, BMS, Gilead, MSD, and Roche. All other authors report no potential conflicts. All authors have submitted the ICMJE Form for Disclosure of Potential Conflicts of Interest. Conflicts that the editors consider relevant to the content of the manuscript have been disclosed.
References
Author notes
C.-H. Chen and C.-Y. Peng contributed equally to this work.

