


Abstract
Annual vaccination with influenza vaccines is recommended for protection against influenza in the United States. Past clinical studies and meta-analysis, however, have reported conflicting results on the benefits of annual vaccination. B-cell responses elicited following repeat influenza vaccinations over multiple seasons have not been examined in detail. We analyzed the B-cell and antibody (Ab) responses in volunteers vaccinated yearly, from 2010 or 2011 through 2014, with seasonal trivalent inactivated influenza vaccines. Statistical analyses were designed to help correct for possible bias due to reduced sample size in the later years of the study. We show that, after the second annual vaccination, the frequency of vaccine-specific plasmablasts and the binding reactivity of plasmablast-derived polyclonal Abs are reduced and do not increase in subsequent years. Similar trends are observed with the serum hemagglutination inhibition Ab response after each annual vaccination, as well as the binding reactivity of plasmablast-derived polyclonal Abs to the hemagglutinin of influenza A virus vaccine components, even with changes in the seasonal vaccine components during the study. Our findings indicate a diminished B-cell response to annual vaccination with seasonal trivalent influenza vaccine. These results emphasize the need for developing improved strategies to enhance the immunogenicity and efficacy of annual influenza vaccination.
The composition of seasonal influenza vaccine is updated frequently to match the antigenicity of predicted circulating influenza virus strains. Therefore, annual influenza vaccination is recommended for protection against influenza, especially in infants and elderly adults who demonstrate higher risks of influenza virus–associated respiratory disease and other complications.
The current recommendation of annual influenza vaccination in the United States was supported by vaccine efficacy studies that suggested a positive impact of repeated vaccination on vaccine effectiveness [1–3]. In contrast, while many studies have concluded that influenza vaccination provides protection, several other studies suggested that annual revaccination did not improve protection [4–7]. A very recent analysis reported that influenza vaccine efficacy against mismatched strains was lower in repeatedly vaccinated children when compared to that in children vaccinated for the current season only [8]. Therefore, the impact of repeated parenteral influenza vaccination on vaccine effectiveness remains controversial.
Serum antibody (Ab) responses, measured by hemagglutination inhibition (HAI) and/or viral neutralization assays, have been used as correlates for the efficacy of inactivated influenza vaccines [9]. In addition, antibodies against influenza virus neuraminidase have also been shown to correlate with protection [10, 11]. A prior study demonstrated that, in a highly vaccinated population, repeated annual influenza vaccination increased HAI titers, with greater increases observed when the vaccine strains changed [12]. We and others reported that individuals receiving repeated vaccination had higher prevaccination HAI titers but lower postvaccination HAI responses than those without previous vaccination [13, 14]. The mechanisms for these variable Ab responses to repeated influenza vaccination are not well understood.
Shortly after an infection or vaccination, antigen-specific B cells are activated in local lymph nodes and become Ab-secreting plasmablasts that transiently circulate in the periphery [15, 16]. The characteristics of these plasmablasts and the antibodies they produced reflect, in part, the overall B-cell responses to the current infection or vaccination without the confounding issue of preexisting influenza virus–specific circulating antibodies. We have previously studied B-cell responses to influenza vaccination and influenza virus infection in different clinical settings by focusing on the peripheral plasmablast response [17–21]. In the current study, we further analyzed the B-cell and Ab responses in a cohort of volunteers annually vaccinated with the seasonal trivalent inactivated influenza vaccine (TIV) during 2010–2014. Our findings suggest a pattern of diminished B-cell response after repeat vaccination.
MATERIALS AND METHODS
Participants, Vaccines, and Blood Samples
In the fall of both 2010 and 2011, healthy volunteers aged 18–30 years who did not receive the monovalent 2009 pandemic influenza A(H1N1) vaccine in 2009 were enrolled. The participants enrolled in 2011 also did not receive the 2010 seasonal influenza vaccines. All vaccines given in the study were TIV (Fluzone, Sanofi Pasteur). The 2010 volunteers received 2010 TIV by intramuscular injection. The 2011 volunteers received 2011 TIV by intramuscular or intradermal injection. Differences in B-cell responses were not detected between these 2 routes of immunization (unpublished results). A subset (n = 23) of the 2010 and 2011 participants who were available to participate were reenrolled in 2012 and included in the longitudinal study. They received 1 dose of 2012 TIV (intramuscularly). Volunteers who were available were reenrolled and vaccinated (intramuscularly) in 2013 (n = 13) and subsequently in 2014 (n = 6). Demographic characteristics of study participants are listed in Table 1. The strain components of the 2010–2014 TIVs are provided in Table 2. After each vaccination, blood samples were collected on day 0 and at 4 weeks, for serologic analysis, and on days 7 or 8 to isolate B cells [21]. B cells (purity, >90%) were cultured at a density of 3 × 10⁶ cells/mL to harvest plasmablast-derived polyclonal Ab (PPAb) as described elsewhere [22]. The participants did not report any influenza-like illnesses during the 28-day study period in each year. This study was approved by the Institutional Review Board of Stanford University. Written informed consent was obtained from all participants.
Demographic Characteristics and Study Attendance Among Adult Participants Enrolled During 2010 or 2011
| Participant | Demographic Characteristic | Enrollment Visit, Year | Follow-up Visit, Year | ||||||
|---|---|---|---|---|---|---|---|---|---|
| Sex | Age, y | Ethnicity | Race | 2010 | 2011 | 2nd, 2012 | 3rd, 2013 | 4th, 2014 | |
| 1 | Male | 20 | Non-Hispanic | Asian | … | Yes | Yes | No | No |
| 2 | Female | 22 | Non-Hispanic | “Asian, Other (Vietnamese)”a | … | Yes | Yes | Yes | No |
| 3 | Female | 23 | Non-Hispanic | Asian | … | Yes | Yes | Yes | No |
| 4 | Female | 22 | Non-Hispanic | Asian | … | Yes | Yes | Yes | No |
| 5 | Female | 23 | Non-Hispanic | Asian | … | Yes | Yes | No | No |
| 6 | Female | 23 | Non-Hispanic | Caucasian or White | … | Yes | Yes | No | No |
| 7 | Female | 19 | Non-Hispanic | Asian | … | Yes | Yes | Yes | No |
| 8 | Male | 30 | Non-Hispanic | “Caucasian or White, Asian”a | … | Yes | Yes | Yes | Yes |
| 9 | Female | 23 | Hispanic | Caucasian or White | … | Yes | Yes | Yes | No |
| 10 | Male | 21 | Non-Hispanic | Caucasian or White | … | Yes | Yes | Yes | No |
| 11 | Male | 20 | Non-Hispanic | Caucasian or White | … | Yes | Yes | No | No |
| 12 | Female | 18 | Non-Hispanic | Caucasian or White | … | Yes | Yes | Yes | Yes |
| 13 | Male | 20 | Non-Hispanic | Caucasian or White | … | Yes | Yes | Yes | Yes |
| 14 | Female | 24 | Non-Hispanic | Caucasian or White | … | Yes | Yes | No | No |
| 15 | Female | 22 | Non-Hispanic | Asian | … | Yes | Yes | No | No |
| 16 | Female | 25 | Hispanic | Caucasian or White | … | Yes | Yes | No | No |
| 17 | Male | 18 | Non-Hispanic | Caucasian or White | … | Yes | Yes | No | No |
| 18 | Male | 24 | Non-Hispanic | Asian | … | Yes | Yes | No | No |
| 19 | Male | 20 | Non-Hispanic | Caucasian or White | … | Yes | Yes | Yes | Yes |
| 20 | Female | 23 | Non-Hispanic | Caucasian or White | Yes | … | Yes | Yes | Yes |
| 21 | Female | 25 | Non-Hispanic | Caucasian or White | Yes | … | Yes | Yes | Yes |
| 22 | Female | 19 | Hispanic | Decline to answer | Yes | … | Yes | Yes | No |
| 23 | Female | 20 | Non-Hispanic | Asian | Yes | … | Yes | No | No |
aQuoted from the participant.
Components of 2010–2014 Trivalent Influenza Vaccines
| Viral Component | ||||
|---|---|---|---|---|
| Influenza A | ||||
| Year | H1N1 | H3N2 | Influenza B | |
| 2010 | A/California/7/2009 (H1N1)pdm09-like | A/Perth/16/2009 (H3N2)-like | B/Brisbane/60/2008-like (B/Victoria/2/87 lineage) | |
| 2011 | A/California/7/2009 (H1N1)pdm09-like | A/Perth/16/2009 (H3N2)-like | B/Brisbane/60/2008-like (B/Victoria/2/87 lineage) | |
| 2012 | A/California/7/2009 (H1N1)pdm09-like | A/Victoria/361/2011 (H3N2)-like | B/Wisconsin/01/2010-like (B/Yamagata/16/88 lineage) | |
| 2013 | A/California/7/2009 (H1N1)pdm09-like | A/Victoria/361/2011-(like cell propagated) | B/Massachusetts/2/2012-like (B/Yamagata/16/88 lineage) | |
| 2014 | A/California/7/2009 (H1N1)pdm09-like | A/Texas/50/2012 (H3N2)-like virus | B/Massachusetts/2/2012-like (B/Yamagata/16/88 lineage) | |
Influenza Virus–Specific Binding Activity of PPAbs
Serially diluted PPAbs were analyzed by an enzyme-linked immunosorbent assay (ELISA), as described elsewhere [21]. In brief, 96-well plates (Greiner) were coated with TIV for each season or with recombinant hemagglutinin (HA; Immune Technology). The net OD450 values after subtracting the background value were used to determine the titer or to calculate the area under the curve, as described elsewhere [20].
HA-Specific Avidity of PPAbs
The HA-specific binding activities of individual PPAbs were analyzed using an ELISA in the presence and absence of 7 M urea. The avidity index was calculated as described previously [23].
Enzyme-Linked Immunospot (ELISPOT) Analysis
Total and TIV-specific immunoglobulin A (IgA) and immunoglobulin G (IgG) Ab-secreting cells (ASCs) were enumerated using an ELISPOT assay [18]. The number of IgG and IgA ASCs/well was counted by an ELISPOT reader and analyzed by ImmunoSpot software (Cellular Technologies).
Serological Assays
Influenza virus neutralization assays were performed as described elsewhere [20]. Serum HAI assays were performed in the Human Immune Monitoring Center at Stanford, as previously described [18].
Statistical Analyses
For Figure 1A–C, association between titer variables and frequency variables was tested using a regression method that permits overlapping censored intervals (icphreg procedure; SAS®/STAT 14.3). Deviance residuals were examined to assess the adequacy of fit for these regression models. A Freeman-Halton exact test [24] for association was used to obtain findings presented in Figure 1D (see Supplementary Figure 1 for details). Immune responses presented in Figures 2–5 (except Figure 3D) were regressed on season, using mixed modeling [25]. A shared-parameter model, with a participant-level random intercept shared between longitudinal and survival components, was used to at least partially correct for possible bias in estimates of means attributable to participant dropout [26].
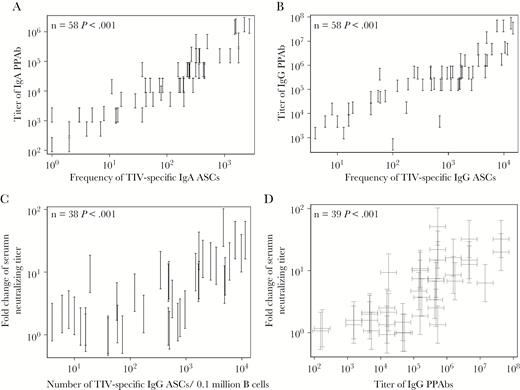
Association between parameters of plasmablast response and serum neutralizing antibody (Ab) response in 2011 trivalent inactivated influenza vaccine (TIV) recipients. Plasmablast responses were measured in blood samples collected at day 7 or 8 after TIV receipt. The TIV-specific immunoglobulin A (IgA) and immunoglobulin G (IgG) Ab-secreting cells (ASCs) in isolated B cells were enumerated with an enzyme-linked immunosorbent (ELISPOT) assay. B cells were cultured to harvest plasmablast-derived polyclonal Abs (PPAbs), which were then tested by ELISA for IgA and IgG binding activity against TIV. Serum neutralizing antibody titers against each TIV component strain, determined by a microneutralization assay with serum samples collected right before and 4 weeks after vaccination, were used to calculate the fold increase in the geometric mean titer (GMT) for all 3 vaccine strains after vaccination. Both the PPAb titer and serum neutralizing titer were measured with serially diluted samples; hence, the readouts are interval censored. A, Association between TIV-specific IgA binding titers of PPAbs and the frequency of TIV-specific IgA ASCs. B, Association between TIV-specific IgG binding titers of PPAbs and the frequency of TIV-specific IgG ASCs. C, Association between the fold increase in the GMT of serum neutralizing antibodies and the frequency of TIV-specific IgG ASCs. D, Association between the fold increase in the GMT of serum neutralizing antibodies and the IgG binding titer of PPAbs. In all panels, frequencies of ASCs indicate the number of specific ASCs in 0.1 million total B cells. Statistical methods are detailed in the “Statistical Analyses” subsection and in Supplementary Figure 1. Each vertical bracket denotes the interval-censored PPAb titer (A and B) or the fold change in serum neutralizing titer (D). In panel D, the PPAb titer and fold change in serum neutralizing titer for each individual is represented by a pair of crossed brackets to denote the censored interval for each measurement.
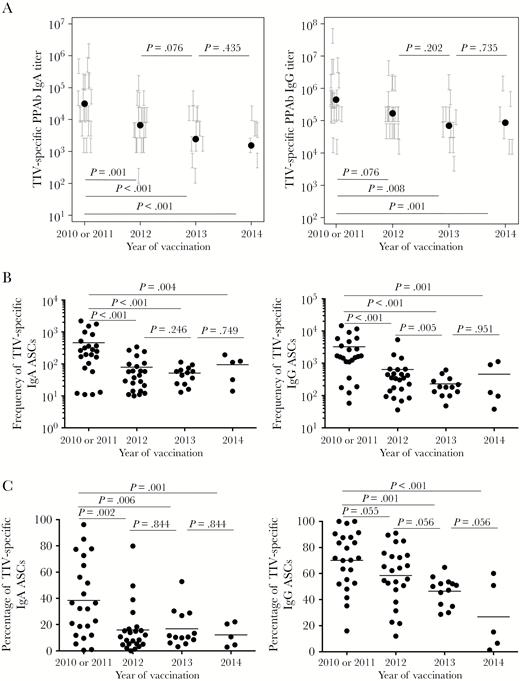
Diminished plasmablast responses after repeated trivalent inactivated influenza vaccine (TIV) receipt. Plasmablast responses were measured at days 6–8 after vaccination in repeated TIV recipients. A, TIV-specific binding titer of immunoglobulin G (IgG) plasmablast-derived polyclonal Abs (PPAbs; left panel) and IgG PPAbs (right panel) after TIV receipt in each year. The titer of each PPAb sample, determined by serial dilution, is presented as a vertical bracket that indicates the upper and lower boundaries of the estimated titer value. The black dots indicate estimated geometric mean titer from the fit of a regression model for all individuals in each year. B, Frequency of TIV-specific immunoglobulin A (IgA) Ab-secreting cells (ASCs; left panel) and IgG ASCs (right panel) after vaccination in each year. The horizontal bars indicate means of frequency values. C, Percentage of TIV-specific IgA ASCs (left panel) and IgG ASCs (right panel) out of the total number of IgA or IgG ASCs after vaccination in each year. The horizontal bars indicate means of percentage values. P values for pairs of compared means are adjusted for multiple comparisons and marked within each graph. See Supplementary Figures 2A–C and 6–9 for details of statistical analysis.
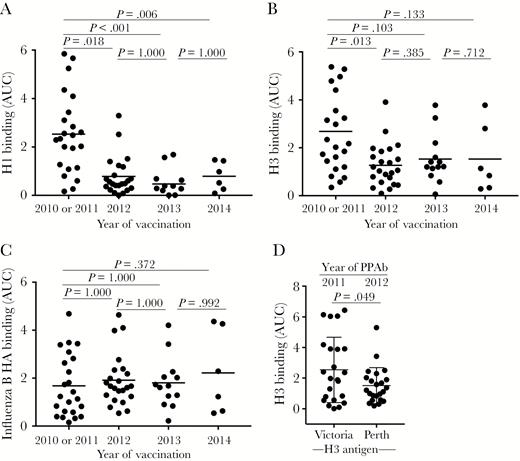
Hemagglutinin (HA)–specific plasmablast-derived polyclonal antibody (PPAb) responses after repeated trivalent inactivated influenza vaccine (TIV) receipt. The immunoglobulin G (IgG) binding reactivity against recombinant HA protein was analyzed by an enzyme-linked immunosorbent assay (ELISA), using PPAbs serially diluted 10-fold, from 1:100 to 1:100 000. The area under the curve (AUC) was calculated to represent the reactivity of each PPAb sample. A, PPAb reactivity against the recombinant H1 protein of the A/California/7/2009 (H1N1) strain, which remained unchanged for the 2010–2014 TIV formulation (Table 2). B, PPAb reactivity against the recombinant H3 protein derived from the influenza A(H3N2) virus component of TIV for each respective season, which changed in 2012 and 2014 (Table 2). C, PPAb reactivity against the recombinant HA protein derived from the influenza B virus component of TIV for each respective season, which changed in 2012 and 2013 (Table 2). In panels A–C, the horizontal bars indicate means of AUCs. P values for pairs of compared means are adjusted for multiple comparisons and marked within each graph. See Supplementary Figures 3, 6–9, and 13 for details of statistical analysis for panels A–C. D, PPAb reactivity in 2010 or 2011 and in 2012 against the conserved epitopes on the 2 H3 proteins derived from the influenza A(H3N2) virus components in TIV during these years. The strain of the testing H3 antigen is indicated under the graph. The means and standard deviations are indicated with horizontal bars and vertical brackets. A paired 2-tailed t test was used to compare the means.
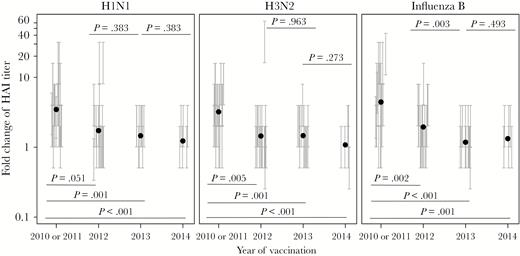
Serum antibody response in repeated trivalent inactivated influenza vaccine (TIV) receipt. Serum hemagglutination inhibition titers before and 4 weeks after each vaccination were determined with each TIV component strain of the respective year (Table 2) and used to calculate the fold change of the titer after vaccination. The fold change for each serum sample is presented as a vertical bracket that indicates the upper and lower boundaries of the fold change derived from the titer values estimated by a serial dilution assay. The black dots indicate estimated geometric mean from the fit of regression model for all participants in each year. P values for pairs of compared means are adjusted for multiple comparisons and marked within each graph. See Supplementary Figures 4 and 6–9 for details of statistical analysis.
![Immunoglobulin G avidity index of plasmablast-derived polyclonal antibodies (PPAbs) to the H1 protein in repeated trivalent inactivated influenza vaccine (TIV) receipt. PPAbs from the recipients after each annual vaccination were analyzed by an enzyme-linked immunosorbent assay (ELISA) in the presence or absence of 7 M urea, using a recombinant H1 protein from the H1N1 vaccine component strain of A/California/7/2009 (H1N1) as the detecting antigen. The avidity index is defined as [ELISA area under the curve with urea]/[ELISA area under the curve without urea]. The means and standard deviations are indicated with horizontal bars and vertical brackets. See Supplementary Figures 5 and 6–9 for details of statistical analysis.](https://oup.silverchair-cdn.com/oup/backfile/Content_public/Journal/jid/219/10/10.1093_infdis_jiy685/5/m_infdis_jiy685_f0005.jpeg?Expires=1750177451&Signature=PsG9sXO79F~vtdmOwDNwBoPFeLFT2-NAm68lGI9DyCsv3I9b-Zwu~j5-OiFp3O~2WuzZL4wSuMfXEPtVg9o~LeJ~DolhjhwB-9SwyG2iaJEAdwW3xhc8Us7P49mBI8gF-OvvGCb0BEKYv-DPDf-sjkmffXT0DIsNqpkmpkmOEUdXktWNRK8K9AFEpaDcrHwBrnlnaFyWu8t-~FuYllFd9Xn1imli5xMItTWOQpsYiakMUJsrv-HE2m53cws-~c9MTgVPppzNWy9jbn5D2dvwYgWQAUggi780PIZohb1hi~Lz-AKusZ6RYAZDhFhVKPdzCPxw2FuEFR1Q4N6sjDJw7A__&Key-Pair-Id=APKAIE5G5CRDK6RD3PGA)
Immunoglobulin G avidity index of plasmablast-derived polyclonal antibodies (PPAbs) to the H1 protein in repeated trivalent inactivated influenza vaccine (TIV) receipt. PPAbs from the recipients after each annual vaccination were analyzed by an enzyme-linked immunosorbent assay (ELISA) in the presence or absence of 7 M urea, using a recombinant H1 protein from the H1N1 vaccine component strain of A/California/7/2009 (H1N1) as the detecting antigen. The avidity index is defined as [ELISA area under the curve with urea]/[ELISA area under the curve without urea]. The means and standard deviations are indicated with horizontal bars and vertical brackets. See Supplementary Figures 5 and 6–9 for details of statistical analysis.
Antibody titer outcomes were analyzed as interval-censored. Regression model estimation was via maximum likelihood [27], and regression model fit was assessed using density plots (Supplementary Figure 2–5 and 13). P values were adjusted for multiple comparisons [28] separately within each outcome. Analyses were performed in SAS (SAS Institute) and Mathematica 11.1 (Wolfram Research). See the Supplementary Materials for details.
RESULTS
Correlation Between Vaccine-Induced Plasmablast Responses and Serum Antibody Responses
Influenza virus–specific serum Ab levels measured by virus neutralization or the HAI assay predict the likelihood of protection following TIV administration [9]. We first examined the relationship between these traditional serological parameters and the plasmablast-based response in a group of individuals immunized with the 2011 TIV. The serum neutralizing titers against the 3 vaccine-component viruses were determined before and after vaccination. The plasmablast responses, including the frequency of vaccine-specific plasmablasts and the titer of vaccine-specific binding activity of PPAbs, were derived from B cells isolated from blood samples collected 6–8 days after vaccination [16].
Significant positive correlations were observed between vaccine-specific PPAb titers and the frequencies of vaccine-specific ASCs (Figures 1A and 1B). We then examined the correlation between these 2 plasmablast parameters and the serum neutralizing Ab response. The fold change of serum neutralizing Ab titers positively and significantly correlated with the frequency of vaccine-specific IgG ASCs (Figure 1C) or the titer of IgG PPAbs (Figure 1D), as well as with the frequency of IgA ASCs and the titer of IgA PPAbs (data not shown). These results suggest a relationship between the plasmablast-based assay results, which are indicative of B-cell responses to influenza vaccination, and the well-documented serum neutralization marker that predicts protection.
Diminished Vaccine-Specific Plasmablast Response After Repeated Vaccination
To assess the effects of repeated influenza vaccination on vaccine-induced B-cell responses, we enrolled volunteers and annually immunized them with the seasonal TIV from 2010 or 2011 through 2014 (Table 1). These volunteers were vaccinated against 2009 pandemic influenza A(H1N1) virus for the first time in either 2010 or 2011 and were grouped together as a single-vaccine-recipient cohort from 2010 and 2011 for this study. The composition of the 2010 TIV was identical to that of 2011 TIV. These participants were reenrolled and vaccinated with the annual seasonal TIV in the 3 subsequent years (ie, 2012, 2013, and 2014). As indicated in Table 1, some participants were lost from the study, starting in 2013 or 2014. Blood samples were collected on days 0 and 7–8 and at 4 weeks after each vaccination, for assessment of plasmablast and serum Ab responses.
Measurement of vaccine-specific binding reactivities of PPAbs revealed that the geometric mean titers of IgA and IgG PPAbs after each repeated vaccination during 2012, 2013, and 2014 were less than those observed after the first vaccination, in 2010 or 2011, with the difference reaching statistical significance in 2012 (for IgA) and 2013 (for IgG; Figure 2A). Compared with participants who stayed in the longitudinal study, those who left follow-up in 2013 or 2014 had a significantly lower IgA PPAb response in 2010 or 2011 (Supplementary Figure 6).
In agreement with the PPAb response, during 2012, 2013, and 2014 frequencies of vaccine-specific IgA and IgG ASCs, as a proportion of the total number of B cells, were all significantly lower than those after the first vaccination, in 2010 or 2011 (Figure 2B). These frequencies either decreased or did not change significantly after revaccinations in 2013 and 2014 (Figure 2B). Compared with participants who stayed in the longitudinal study, those who left follow-up in 2013 or 2014 had significantly lower IgA and IgG ASC responses in 2010 or 2011 (Supplementary Figures 7 and 8). Similar patterns of change were observed in the percentages of both IgA and IgG vaccine-specific plasmablasts among the total number of plasmablasts after the repeated annual vaccinations (Figure 2C).
HA-Specific B-Cell Responses After Repeated TIV Receipt
The influenza virus HA protein is the primary target of protective Ab responses against influenza viruses. Therefore, we examined the IgG-binding activity of PPAb against the recombinant HA proteins derived from the vaccine component strains for each year of our study.
The H1N1 component (A/California/7/2009) remained unchanged from 2010 through 2014 (Table 2). Compared with the first year of vaccination (ie, 2010 or 2011), the mean anti-H1 PPAb activity was significantly reduced after each subsequent annual vaccinations (Figure 3A).
The influenza A(H3N2) virus component changed twice during our study (in 2012 and 2014; Table 2). The PPAb reactivity to the H3 proteins of the corresponding influenza A(H3N2) virus strains decreased significantly after the 2012 vaccination (Figure 3B). Significant further changes were not detected after subsequent vaccinations in 2013 and 2014.
The influenza B virus component changed in both 2012 and 2013 (Table 2). In contrast to binding reactivity to the HA proteins of influenza A viruses, significant changes in the PPAb-binding reactivity against the HA of the influenza B virus strains were not detected across the years studied (Figure 3C).
The influenza A(H3N2) virus component changed in 2012 from A/Perth/16/2009 to a drifted strain A/Victoria/361/2011. To assess the vaccine-induced binding activity against conserved epitopes on the 2 H3 antigens, we measured the 2010 or 2011 PPAb reactivity against the H3 of the 2012 TIV component and the 2012 PPAb reactivity to the H3 of the 2011 TIV component. The reactivity decreased significantly in 2012 (Figure 3D), suggesting that the B-cell response to the conserved epitopes of these 2 distinct H3 antigens declined after the change of the influenza A(H3N2) virus component in 2012.
Serum HAI Responses in Repeated TIV Receipt
To examine the protective serum Ab response against the highly variable receptor-binding site on HA following repeated annual vaccination, we measured the HAI titers before and after vaccination in each year (Supplementary Figure 10) and calculated their fold increase. As shown in Figure 4, the mean fold increase in HAI titers against each vaccine component was smaller after the 2012 vaccination in comparison to that after the first vaccination, in 2010 or 2011, and the difference was significant for influenza A(H3N2) and B virus strains. This reduced response either did not change significantly or further decreased after subsequent vaccination in 2013 and 2014. Compared with participants who stayed in the longitudinal study, those who left follow-up in 2013 or 2014 had significantly lower H1N1-specific HAI responses in 2010 or 2011 (Supplementary Figure 9). Taken together, the results shown in Figures 3 and 4 suggest a pattern of reduced B-cell and/or Ab responses to conserved epitopes and variable receptor-binding sites on the HA antigens after repeated TIV receipt, even in years when vaccine strains were updated with new HA components.
Repeated TIV Receipt Did Not Improve Avidity of H1-Specific PPAb
The foregoing results provided evidence for diminished Ab reactivity after repeated vaccination. To examine whether repeat vaccination resulted in increased avidity of PPAbs, we measured the avidity of each year’s PPAbs against the unchanged H1N1 HA component. Significant changes were not detected over the study years (Figure 5), suggesting that, even though vaccinees were immunized with the same H1 antigen for 4 consecutive years, the avidities of H1-specific antibodies did not increase.
DISCUSSION
There are conflicting reports on the impact of repeated influenza vaccination on vaccine effectiveness. To further examine this issue, we characterized the B-cell and Ab responses in volunteers over 4 years of annual influenza vaccination (from 2010 or 2011 through 2014). In our initial analysis, we examined the relationship between plasmablast responses and the serum neutralizing Ab responses to TIV (Figure 1). Our result suggests that plasmablast responses are positively associated with changes in the established neutralization correlates of TIV-induced protective immunity after repeated vaccination. Subsequently, when we followed the plasmablast response in individuals receiving 4 years of annual vaccination, we observed that the numbers of vaccine-specific plasmablasts and the levels of vaccine-specific reactivity of PPAbs decreased significantly after repeated vaccination, in comparison to findings after the first vaccination, in 2010 or 2011 (Figure 2). On the other hand, increases in the antigen-specific avidity of PPAbs were not observed, despite repeat immunization with the same strain (Figure 5). These results, taken together, suggest that the diminished PPAb reactivity after repeated annual TIV receipt is primarily due to a reduced number of activated B cells, which is not compensated for by an increase in Ab avidity.
Influenza virus binds to sialic acids on the host cell surface through the highly variable receptor-binding site on the head domain of HA, which is the primary target of protective antibodies against influenza virus [29, 30]. Mutations frequently occur on the HA receptor–binding site, resulting in antigenic drift that renders preexisting HA head–specific neutralizing antibodies poorly reactive to mutated HA [29]. This necessitates updates of influenza vaccine components with the mutated HA. The serum level of neutralizing antibodies against the receptor-binding site can be measured by an HAI assay. In addition to the variable receptor-binding site, HA also carries conserved epitopes known to be involved in protective immunity, including epitopes in the stalk domain of HA [31, 32]. The reactivity of protective antibodies specific for these conserved epitopes can be measured by an ELISA [33]. In this study, we showed that serum HAI responses against all 3 TIV-component viruses declined significantly after repeated yearly vaccination, even following the inclusion of updated influenza A(H3N2) and B virus strains in 2012 (Figure 4). Similar to the HAI responses, the PPAb reactivity to the unchanged H1 antigen (Figure 3A) and to conserved epitopes on the updated H3 antigen (Figure 3D) also declined. Taken together, these results suggest that repeated TIV receipt with influenza A viruses is associated with reduced immunogenicity of the HA epitopes to which the vaccinees had been previously exposed but also with reduced immunogenicity to mutated new epitopes on the vaccine HA antigen to which vaccinees had not been previously exposed. Both of these reductions are likely to affect the effectiveness of repeated influenza vaccination.
In contrast to influenza A viruses, the PPAb responses to the HA of influenza B virus did not decline significantly after repeated TIV receipt (Figure 3C). The underlying mechanism for these differences between type A and type B influenza viruses is unknown. In 2012, the influenza B virus component of TIV changed from a Victoria-lineage strain (B/Brisbane/60/2008) to a Yamagata-lineage strain (B/Wisconsin/1/2010), with a difference of 33 amino acids between their HA proteins. In contrast, the difference between the H3 proteins of the 2010–2011 and 2012 influenza A(H3N2) virus components of TIV is only 9 amino acids (Influenza Research Database; available at: http://www.fludb.org). It is possible that the larger antigenic distance between the HAs of the 2 influenza B virus lineages resulted in more-robust B-cell and Ab responses to the HA of the influenza B virus component than those to the H3 component of TIV after the 2012 vaccination. Differences in other factors that affect B-cell response, such as CD4+ helper T-cell responses to influenza A and B viruses, could also contribute to the distinct patterns of the B-cell response following repeated vaccination. These differences between the type A and B viruses will need to be examined in future studies.
The mechanism underlying the diminished B-cell activation after repeat influenza vaccination is not clear. A potential cause is antigen sequestration by preexisting antibodies that decrease presentation of the antigenic epitopes to the immune system. In fact, the inhibitory effect of prior vaccination is greatest when vaccine strains are unchanged or only minimally different [34]. Therefore, the presence of high prevaccination anti-HA antibody titers may limit the boosting ability of subsequent vaccinations by blocking viral epitopes in the vaccine. Indeed, it was shown that high preexisting serum Ab levels to a given influenza virus strain correlate with low production of Ab-secreting cells and memory B cells that recognize that strain after revaccination [35]. It has also been reported that preexisting neutralizing antibodies decreased the boosting of CD4+ T-cell responses [36], which provides help for antigen-specific B-cell responses. Our new findings suggest that the inhibitory effects of prior vaccination and preexisting antibodies might spread from conserved epitopes to the novel epitopes on the mutated HA antigen.
The seasonal influenza epidemic causes its most significant disease burden in the very young and elderly populations, whereas the protective efficacy of influenza vaccination in the elderly group is, unfortunately, lower than that in children and younger adults [37, 38]. The lower effectiveness of influenza vaccination in elderly individuals is usually attributed to aging-related immune senescence [39]. Previously, we reported that the B-cell response to TIV in elderly individuals was characterized by a reduced number of vaccine-activated B cells but a similar avidity and affinity of vaccine-specific antibodies, compared with findings in younger vaccinees [18]. Here, we showed that the reduced number of activated B cells and the lack of enhanced Ab avidity also occurred in young adults after repeated TIV receipt, suggesting that the reduced B-cell response and vaccine efficacy in elderly individuals might, at least in part, result from the multiple exposures to influenza vaccine over an extended lifetime.
A limitation of our study is that only 23 of the 2010–2011 participants, mostly college students, entered the longitudinal study, and the number further decreased during the last 2 years. Therefore, the possibility of selection bias and regression to the mean cannot be excluded (Supplementary Figure S14). Because participants were voluntarily enrolled into the vaccine study, participant dropout was unlikely caused by a change in risk perception and outcome expectancies for influenza vaccination, which could be related to the likelihood of receiving influenza vaccination [40]. In other words, participant dropout was unlikely related to an influenza vaccination history that could affect the baseline levels of influenza immunity at enrollment. Regardless of the cause for participant dropout, this dropout may have reduced statistical power and introduced sampling bias. To overcome these drawbacks, we used statistical methods that were able to partially correct for the bias (Supplementary Materials). Our analyses showed that the status of missing participants in 2013 and 2014 was negatively associated with immune responses, particularly the frequencies of vaccine-specific IgA and IgG plasmablasts, to a prior vaccination (eg, during 2010 or 2011). Our results imply that the lost study participants in 2013 and 2014 tended to have lower B-cell responses in 2010–2011, when they were first enrolled. Of note, there was a significant positive correlation between the frequencies of vaccine-specific plasmablasts in 2010 or 2011 and those in 2012 (Supplementary Figure 11). Hence. it is reasonable to assume that the participants with a poor response in the first year would have a poor response in the later years, as well, although we cannot rule out the possibility that some who started with a lower response had higher responses later that we did not observe. Taken together, these results suggest that the loss of participants in this study likely resulted in an overestimation of B-cell responses in the later years. Therefore, our conclusion of a reduced B-cell response after repeated TIV receipt likely remains true without the dropouts.
In summary, we have shown that, from 2010 or 2011 through 2014, repeated TIV receipt in young adults was associated with reduced generation of vaccine-specific plasmablasts without an enhancement of the avidity of antibodies derived from these plasmablasts. In addition, this study provides evidence for the conclusion that reduced immunogenicity of repeated TIV receipt occurs to both conserved HA epitopes and the highly variable epitope on the HA receptor–binding site of a drifted influenza A(H3N2) strain.
To cope with frequently mutated circulating influenza virus strains and the waning of protective Ab levels over time, the current recommendation for individuals older than 6 months is annual vaccination with frequently reformulated seasonal influenza vaccine. Our findings suggest that better strategies are needed to improve the immunogenicity of repeated influenza vaccination and to optimize its effectiveness. The relationship between immune responses and influenza vaccine effectiveness could be affected by many factors, including the match between vaccine strains and circulating strains and the age of vaccine recipients. Therefore, it is critical to extend this preliminary study to larger populations and during different influenza seasons. It is also important to further investigate the long-term effects of repeated influenza vaccination on the future efficacy of influenza vaccination, especially for elderly recipients. Finally, our results emphasize the urgency to develop universal influenza vaccines that require fewer or no repeat vaccinations.
Supplementary Data
Supplementary materials are available at The Journal of Infectious Diseases online. Consisting of data provided by the authors to benefit the reader, the posted materials are not copyedited and are the sole responsibility of the authors, so questions or comments should be addressed to the corresponding author.
Notes
Acknowledgments. We thank our study participants, for their participation; C. Zhang, for technical assistance; S. Mackey, for coordinating the clinical study; S. Swope, S. Cathey, C. Walsh, S. French, and M. Ugur, for enrolling participants, administering vaccine, and collecting blood samples and clinical data; and T. Quan, K. Spann, S. Batra, and B. Tse, for screening and scheduling participants and providing regulatory and clinical data management support.
Financial support. This work was supported by the National Institutes of Health (grants AI090019 and AI057229 to H.B.G. and AI089859 to R. A. A.).
Potential conflicts of interest. H. B. G. is a consultant for Vaxart and FluGen, both of which are developers of novel candidate influenza vaccines. He also consults for Astra Zeneca, the manufacturer of a live attenuated influenza vaccine. All other authors report no potential conflicts.

