


Abstract
The long-term incidence and factors associated with hepatitis B surface antigen (HBsAg) loss in hepatitis B e antigen (HBeAg)-negative chronic hepatitis B (CHB) patients receiving peginterferon is rarely reported.
From 2004 to 2016, 233 HBeAg-negative CHB patients who completed 48 weeks of peginterferon treatment from 3 medical centers in Taiwan were retrospectively enrolled.
During a median follow-up of 7.4 years, 27 cases achieved HBsAg loss. The cumulative incidences of HBsAg loss and HBsAg seroconversion at 3, 5, 10 years after peginterferon treatment were 4.7%, 9.4%, 14.2%, and 3.5%, 6.4%, 12.5%, respectively, in overall patients, and 15.9%, 29.1%, 37.3%, and 13.1%, 19%, 30.6%, respectively, in patients achieving sustained off-treatment virological response (SVR). By multivariate analysis, age (<35 years; hazard ratio [HR] = 3.742, P = .007), baseline HBsAg levels (<1250 IU/mL; HR = 4.849, P = .002), HBsAg decline at week 24 (≥1 log; HR = 5.660, P = .002), and achieving SVR (HR = 8.546, P = .006) were predictors of HBsAg loss. After achieving SVR, HBsAg loss rates were higher than 30% in 5 years among patients with either younger age or lower HBsAg at baseline.
HBsAg loss rate continues to increase after peginterferon treatment in HBeAg-negative CHB patients with SVR. Age, baseline HBsAg levels, on-treatment HBsAg decline, and achieving SVR are factors associated with long-term HBsAg loss.
Chronic hepatitis B virus (HBV) infection is estimated to affect 248 million people worldwide and is associated with the development of cirrhosis and hepatocellular carcinoma (HCC) [1]. Hepatitis B e antigen (HBeAg)-negative chronic hepatitis B (CHB), the predominant type of CHB worldwide, represents a progressive and difficult-to-cure phase in the natural history of chronic HBV infection [2]. The goal of antiviral therapy for CHB is to improve survival and quality of life by preventing disease progression and HCC development through sustained suppression of HBV and, ideally, the clearance of hepatitis B surface antigen (HBsAg), which is considered a functional cure of HBV infection [3–5]. Unfortunately, HBsAg loss is uncommon by current treatment strategies, especially in patients with HBeAg-negative CHB [6].
Among the current standard antiviral therapies for CHB, peginterferon alfa (PegIFN) offers several benefits over nucleos(t)ide analogs (NUCs), including a finite duration of therapy and a higher rate of HBsAg loss [7]. In HBeAg-negative CHB patients, the 48-week PegIFN therapy leads to a sustained off-treatment virological response (SVR) in approximately 30% of patients, but HBsAg loss during PegIFN therapy is rare [8–11]. Nevertheless, the chance of HBsAg loss may continue to increase during long-term follow-up in patients achieving SVR. In the registration trial, only 3% of HBeAg-negative CHB patients had HBsAg loss 6 months after the end of PegIFN treatment, while the rate of HBsAg loss progressively increased to 9% at year 3 and 12% at year 5 [8, 12, 13]. On-treatment HBsAg declines have been shown to predict HBsAg loss after PegIFN therapy [14–16], while baseline predictors of long-term HBsAg loss remains undetermined.
Currently, there are a limited number of studies reporting the incidence and predictors of long-term HBsAg loss following finite treatment with PegIFN for HBeAg-negative patients. The aim of this study was to evaluate the long-term incidence of HBsAg loss and factors associated with treatment response in HBeAg-negative CHB patients treated with PegIFN therapy.
METHODS
Patients
Consecutive HBeAg-negative CHB patients who completed 48 weeks’ PegIFN α-2a treatment from 1 January 2004 to 1 January 2016 were retrospectively reviewed from Taipei Veterans General Hospital, Cathay General Hospital, and China Medical University Hospital, Taiwan. The inclusion criteria were age ≥20 years old, positive for HBsAg, and negative for HBeAg for more than 6 months before the treatment, a pretreatment serum alanine aminotransferase (ALT) equal to or more than 2 times the upper limit of normal (ULN), and a baseline HBV viral load of ≥2000 IU/mL, which fulfilled the treatment criteria for CHB according to the Asian Pacific Association for the Study of the Liver (APASL) treatment guidelines as well as the reimbursement policy of National Health Insurance Administration, Ministry of Health and Welfare, Taiwan [17, 18]. Exclusion criteria included the following points: (1) coinfection with hepatitis C virus, hepatitis D virus, or human immunodeficiency virus; (2) alcoholic liver disease; (3) suspected autoimmune diseases; and (4) and radiological evidence of HCC (ie, abdominal sonogram, computed tomography scan, or magnetic resonance imaging scans). This study was approved by the Institutional Review Board, Taipei Veterans General Hospital, Institutional Review Board of the Cathay General Hospital, and Institutional Review Board of the China Medical University Hospital, which complied with standards of the Declaration of Helsinki and current ethical guidelines. As a retrospective cohort study, patient informed consent was waived by the above Institutional Review Boards.
PegIFN Treatment, Posttreatment Follow-up, and Definition of Responses
Patients received Peginterferon α2a 180 μg once weekly for 48 weeks, and the dosage was adjusted according to any adverse effect identified by their physicians. After initiating PegIFN treatment, patients were followed at the outpatient clinics every 2 to 4 weeks. In addition to conventional biochemistry tests, HBV DNA levels were measured at baseline, week 12 or 24, the end of treatment, week 24 and 48 after the end of treatment. Serum HBsAg level was measured at baseline, week 12 or 24, and additional assays when appropriate.
SVR was defined as a serum HBV DNA less than 2000 IU/mL at 48 weeks posttreatment. HBsAg seroconversion was indicated as seronegative of HBsAg and seropositive of anti-HBs in serum.
Liver Biochemistry, Virological Tests, and HBV Genotyping
Serum biochemistry tests were measured by systemic multiautoanalyzer (Technicon SMAC, Technicon Instruments Corp., Tarrytown, NY). Serum HBeAg and anti-HBe antibody were measured by radioimmunoassay (Abbott Laboratories, North Chicago, IL). HBV DNA was determined by Roche Cobas Taqman HBV DNA assay (detection limit of 20 IU/mL, Roche Diagnostics, Switzerland). Before 2008, HBsAg was tested using a radioimmunoassay kit (Abbott Laboratories, North Chicago, IL). After 2008, HBsAg levels were quantified using the Abbott Architect HBsAg assay (Abbott Diagnostics, Abbott Park, IL) or Elecsys HBsAg II assay (Roche Diagnostics, Mannheim, Germany) with detection limit of 0.05 IU/mL. Anti-HBs was tested using Architect anti-HBs assay (Abbott Laboratories, Sligo, Ireland). Genotyping of HBV was performed by polymerase chain reaction restriction fragment length polymorphism of the surface gene of HBV as previously described [10, 19].
On-treatment ALT and aspartate aminotransferase (AST) elevations were defined as an increase in serum ALT and AST at least 1 times ULN compared with baseline levels, while on treatment ALT and AST flares were defined as a 3-fold increase in serum ALT and AST compared with baseline levels during PegIFN treatment [20]. Fibrosis 4 index (FIB-4) score was calculated using the formula: age (years) × AST (U/L)/platelet count (109/L) × (ALT [U/L])1/2 and fibrosis stage 3/4 was defined by FIB-4 score ≥3.25 [21].
Statistical Analyses
Values were expressed as median (ranges) or as mean ± standard deviation when appropriate. Mann–Whitney U test was used to compare continuous variables. Pearson Χ2 analysis or Fisher exact test was used to compare categorical variables. The Kaplan–Meier method was used to estimate time to HBsAg loss. The log-rank test was used to compare survival curves between patient groups. Analysis of prognostic factors for HBsAg loss was performed using the Cox proportional hazards model. Variables that achieved statistical significance (P < .05) or those close to significance (P < .1) by univariate analysis were subsequently included in the multivariate analysis. A 2-tailed P < .05 was considered statistically significant. All statistical analyses were performed using the IBM SPSS Statistics V22 (IBM, Armonk, NY).
RESULTS
Baseline Characteristics
A total of 233 PegIFN-treated patients were enrolled in this long-term follow-up study. Of these, 160 (68.7%) had HBsAg data available at baseline. Baseline characteristics were similar between the 2 populations (Table 1). The majority of patients were males (88.4%), treatment naive (76%), and HBV genotype B (78%). Seventeen (7.3%) patients had cirrhosis and 25 (10.7%) had significant fibrosis defined by FIB-4 score.
Baseline Characteristics of HBeAg-Negative Chronic Hepatitis B Patients
| Long-term Follow-up Population (n = 233) | Long-term Follow-up Population With Available Baseline HBsAg (n = 160) | |
|---|---|---|
| Age, years ± SD | 44.6 ± 10.1 | 44.2 ± 10.3 |
| Gender, male/female, n (%) | 206/27 (88.4/11.6) | 140/20 (87.5/12.5) |
| Cirrhosis, n (%) | 17 (7.3) | 16 (10) |
| FIB-4 fibrosis stage 3/4, n (%) | 25 (10.7) | 22 (13.8) |
| HBV treatment naive, n (%) | 177 (76) | 120 (75) |
| Genotype A/B/C, n (%)a | 1/131/36 (0.6/78/21.4) | 1/113/33 (0.7/76.9/22.4) |
| HBV DNA, log10 IU/mL ± SD | 5.59 ± 1.61 | 5.66 ± 1.62 |
| HBsAg, log10 IU/mL ± SD | … | 3.18 ± 0.70 |
| ALT, U/L ± SD | 145 ± 129 | 144 ± 136 |
| AST, U/L ± SD | 81 ± 68 | 83 ± 73 |
| Total bilirubin, mg/dL ± SD | 0.95 ± 0.38 | 0.96 ± 0.38 |
| Creatinine, mg/dL ± SD | 0.98 ± 0.61 | 0.99 ± 0.69 |
| Platelet, 1000/μL ± SD | 180 ± 50 | 181 ± 52 |
| On-treatment ALT elevation, n (%) | 39 (16.7) | 28 (17.5) |
| On-treatment AST elevation, n (%) | 35 (15) | 25 (15.6) |
| On-treatment ALT flare, n (%) | 12 (5.2) | 9 (5.6) |
| On-treatment AST flare, n (%) | 17 (7.3) | 11 (6.9) |
| Total PegIFN dosage, μg ± SD | 8503 ± 429 | 8470 ± 470 |
| PegIFN dose reduction, n (%) | 37 (15.9) | 30 (18.8) |
| Follow-up duration, years ± SD | 7.43 ± 2.30 | 7.61 ± 2.51 |
| SVR, n (%)b | 63 (28.9) | 49 (31.4) |
Abbreviations: ALT, alanine aminotransferase; AST, aspartate aminotransferase; FIB-4, fibrosis 4 index; HBeAg, hepatitis B e antigen; HBsAg, hepatitis B surface antigen; HBV, hepatitis B virus; PegIFN, peginterferon.
aHBV genotype was determined in 168 patients of the overall population and in 147 patients of the subpopulation.
bSustained virological response status was available in 218 patients of the overall population and in 156 patients of the subpopulation.
Sustained Off-Treatment Virological Response
The SVR status was available in 218 (93.6%) patients. Among them, 63 (28.9%) patients achieved SVR after the 48-week Peg-IFN therapy. By multivariate analysis, HBsAg level (<1250 IU/mL; odds ratio [OR] = 2.073, P = .040) was the only baseline predictor of SVR while HBsAg decline ≥1 log at week 24 (OR = 2.818, P = .010) was the on-treatment predictor of SVR (Table 2).
Univariate and Multivariate Analyses of Factors Associated With Sustained Off-Treatment Virological Response in Patients With Available Baseline HBsAg
| Univariate | Multivariate Model I | Multivariate Model II | ||||
|---|---|---|---|---|---|---|
| OR (95% CI) | P | OR (95% CI) | P | OR (95% CI) | P | |
| Age, years <35/≥35 | 1.611 (0.751–3.455) | .220 | ||||
| Gender Male/female | 1.978 (0.625–6.262) | .246 | ||||
| Genotype B/C | 1.361 (0.585–3.166) | .474 | ||||
| Cirrhosis Yes/no | 1.027 (0.346–3.046) | .961 | ||||
| FIB-4 fibrosis stage 3–4 Yes/no | 1.807 (0.754–4.329) | .185 | ||||
| Baseline factors | ||||||
| HBV DNA, IU/mL | ||||||
| <104/≥104 | 2.275 (1.006–5.147) | .048 | NS | 2.656 (1.050–6.722) | .039 | |
| <105/≥105 | 1.484 (0.731–3.014) | .274 | ||||
| HBsAg, IU/mL <1250/≥1250 | 2.073 (1.033–4.163) | .040 | 2.073 (1.033–4.163) | .040 | 2.359 (1.073–5.189) | .033 |
| ALT, U/L <140/≥140 | 0.761 (0.372–1.556) | .454 | ||||
| AST, U/L <80/≥80 | 1.113 (0.528–2.348) | .778 | ||||
| Total bilirubin, mg/dL <1.0/≥1.0 | 1.015 (0.508–2.026) | .966 | ||||
| Creatinine, mg/dL <0.9/≥0.9 | 0.709 (0.338–1.488) | .364 | ||||
| Platelet, × 1000/μL <150/≥150 | 1.114 (0.510–2.433) | .786 | ||||
| On treatment factors | ||||||
| HBsAg decline 1 log at week 24 Yes/no | 2.591 (1.225–5.478) | .013 | 2.818 (1.281–6.196) | .010 | ||
| 10% HBsAg decline at week 24 Yes/no | 2.323 (0.871–6.194) | .092 | ||||
| On-treatment ALT elevation Yes/no | 1.220 (0.568–2.622) | .610 | ||||
| On treatment AST elevation Yes/no | 1.276 (0.576–2.826) | .549 | ||||
| On treatment ALT flare Yes/no | 2.661 (0.807–8.449) | .109 | ||||
| On treatment AST flare Yes/no | 2.359 (0.864–6.440) | .094 | NS | |||
| Total PegIFN dosage Full dose/dose reduction | 0.655 (0.306–1.404) | .277 | ||||
Model I included baseline factors only. Model II included both baseline and on-treatment factors.
Abbreviations: ALT, alanine aminotransferase; AST, aspartate aminotransferase; CI, confidence interval; FIB-4, fibrosis 4 index; HBsAg, hepatitis B surface antigen; HBV, hepatitis B virus; NS, not significant; OR, odds ratio; PegIFN, peginterferon.
Incidences of HBsAg Loss and HBsAg Seroconversion
At a median follow-up period of 7.4 years after PegIFN therapy, HBsAg loss was documented in 27 (11.6%) cases. Among the 27 patients achieving HBsAg loss, 25 patients had follow-up anti-HBs data, and 22 of them (88%) had documented HBsAg seroconversion. All the 3 cases with HBsAg loss but without HBsAg seroconversion had undetectable HBV DNA when HBsAg loss occurred. The cumulative incidences of HBsAg loss and HBsAg seroconversion at 3, 5, 7, 10 years after PegIFN treatment were 4.7%, 9.4%, 11.8%, 14.2%, and 3.5%, 6.4%, 9.9%, 12.5%, respectively, in the overall 233 patients (Figure 1A and 1B). The median interval of HBsAg loss to HBsAg seroconversion was 8.4 months (ranged 0–90.23). The cumulative incidence of HBsAg seroconversion after HBsAg loss was 53.4% at 1 year and 89.8% at 5 years (Figure 1C).
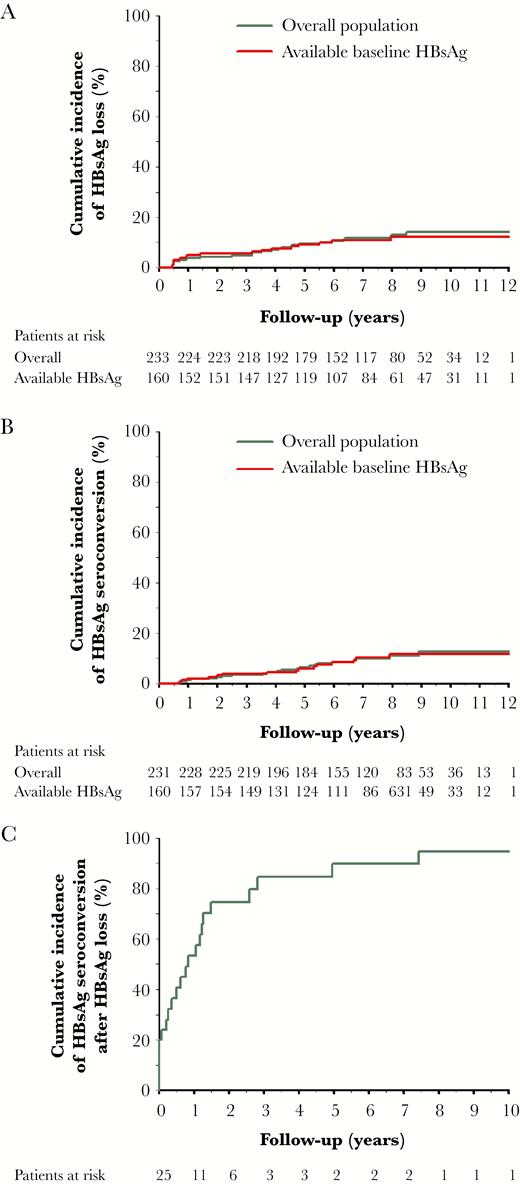
Cumulative incidences of hepatitis B surface antigen (HBsAg) loss and HBsAg seroconversion after peginterferon therapy. A, HBsAg loss in the overall population (n = 233) and patients with available baseline HBsAg (n = 160). B, HBsAg seroconversion in the overall population and patients with available baseline HBsAg. C, HBsAg seroconversion after HBsAg loss in the overall population.
In 160 patients with available baseline HBsAg, HBsAg loss was documented in 17 (10.6%) cases. All the 17 cases had available anti-HBs data, and 15 of them had documented HBsAg seroconversion (88.2%). The cumulative incidences of HBsAg loss and HBsAg seroconversion at 3, 5, 7, 10 years were 5.6%, 9.1%, 10.8%, 12.1%, and 3.7%, 5.9%, 10.2%, 11.6%, respectively, which were similar to the incidences in the overall population (Figure 1A and 1B).
In patients achieving SVR, the cumulative incidences of HBsAg loss and HBsAg seroconversion at 3, 5, 7, 10 years were 15.9%, 29.1%, 33.6%, 37.3%, and 13.1%, 19%, 30.6%, 30.6%, respectively, whereas in patients without SVR, the cumulative incidences of HBsAg loss and HBsAg seroconversion at 3, 5, 7, 10 years were 1.3%, 2.6%, 3.5%, 5.5%, and 0%, 2.1%, 3%, 4.5%, respectively (P < .001; Figure 2A and 2B).
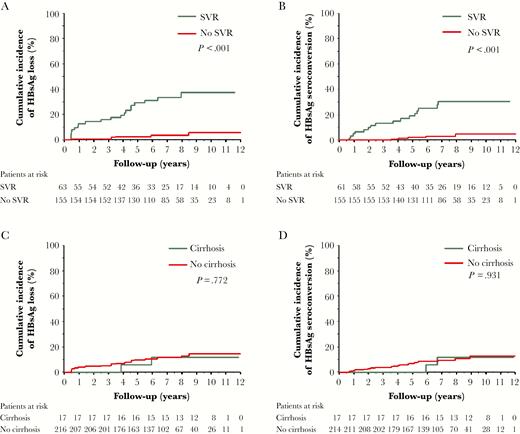
Cumulative incidences of hepatitis B surface antigen (HBsAg) loss and HBsAg seroconversion in patients with and without sustained off-treatment virological response (SVR) or cirrhosis. A, HBsAg loss in patients with or without SVR. B, HBsAg seroconversion in patients with and without SVR. C, HBsAg loss in patients with and without cirrhosis. D, HBsAg seroconversion in patients with and without cirrhosis.
In patients without cirrhosis, the cumulative incidences of HBsAg loss and HBsAg seroconversion at 3, 5, 7, 10 years were 5.1%, 9.7%, 11.7%, 14.6%, and 3.7%, 6.9%, 9.4%, 12.7%, respectively, whereas in patients with cirrhosis, the corresponding incidences were 0%, 5.9%, 11.8%, 11.8%, and 0%, 0%, 11.8%, 11.8%, respectively (Figure 2C and 2D).
In patients with genotype B, the cumulative incidences of HBsAg loss and HBsAg seroconversion at 3, 5, 7, 10 years were 6.1%, 8.6%, 9.6%, 11.4%, and 5.3%, 6.2%, 10.4%, 10.4%, respectively, whereas in patients with genotype C, the corresponding incidences were 2.8%, 9.1%, 9.1%, 9.1%, and 0%, 6.4%, 6.4%, 12.6%, respectively (Supplementary Figure 1A and 1B).
Predictors of HBsAg Loss After PegIFN Therapy in 160 Patients With Available Baseline HBsAg Data
To evaluate the predictive value of baseline HBsAg level for long-term HBsAg loss after PegIFN therapy, further analysis was focused on the 160 patients with available baseline qHBsAg data (Table 3). In multivariate analysis, young age (<35 years; hazard ratio [HR] = 3.742, P = .007; Figure 3A) and lower HBsAg levels (<1250 IU/mL; HR = 4.849, P = .002; Figure 3B) were independent baseline predictors of HBsAg loss, whereas HBsAg decline ≥1 log at week 24 (HR = 5.660, P = .002; Figure 3C) and achieving SVR (HR = 8.546, P = .006) were on-treatment predictors of HBsAg loss.
Univariate and Multivariate Analyses of Factors Associated With HBsAg Loss in Patients With Available Baseline HBsAg
| Univariate | Multivariate | Multivariate | ||||
|---|---|---|---|---|---|---|
| Model Ia | Model IIa | |||||
| HR (95% CI) | P | HR (95% CI) | P | HR (95% CI) | P | |
| Age, years <35/≥35 | 3.021 (1.165–7.833) | .023 | 3.742 (1.429–9.797) | .007 | 4.403 (1.572–12.334) | .005 |
| Gender Male/female | 1.097 (0.251–4.800) | .902 | ||||
| Genotype B/C | 1.168 (0.330–4.140) | .810 | ||||
| Cirrhosis Yes/no | 1.001 (0.228–4.402) | .999 | ||||
| FIB-4 fibrosis stage 3–4 Yes/no | 0.882 (0.200–3.882) | .868 | ||||
| HBV DNA, IU/mL | ||||||
| <104/≥104 | 2.583 (0.954–6.991) | .062 | ||||
| <105/≥105 | 2.562 (0.987–6.646) | .053 | NS | NS | ||
| HBsAg, IU/mL <1250/≥1250 | 4.107 (1.504–11.214) | .006 | 4.849 (1.760–13.361) | .002 | 5.686 (1.851–17.648) | .002 |
| ALT, U/L <140/≥140 | 1.060 (0.367–3.060) | .914 | ||||
| AST, U/L <80/≥80 | 1.876 (0.534–6/592) | .326 | ||||
| Total bilirubin, mg/dL <1.0/≥1.0 | 1.402 (0.518–3.792) | .506 | ||||
| Creatinine, mg/dL <0.9/≥0.9 | 1.327 (0.504–3.493) | .567 | ||||
| Platelet, × 1000/μL <150/≥150 | 0.981 (0.316–3.042) | .973 | ||||
| On treatment factors | ||||||
| HBsAg decline 1 log at week 24 Yes/no | 4.665 (1.620–13.431) | .004 | 5.660 (1.849–17.325) | .002 | ||
| 10% HBsAg decline at week 24 Yes/no | 28.992 (0.160–5213.389) | .204 | ||||
| On treatment ALT elevation Yes/no | 0.546 (0.125–2.387) | .421 | ||||
| On treatment AST elevation Yes/no | 0.635 (0.145–2.776) | .546 | ||||
| On treatment ALT flare Yes/no | 0.962 (0.128–7.258) | .970 | ||||
| On treatment AST flare Yes/no | 0.771 (0.102–5.813) | .801 | ||||
| Total PegIFN dosage Full dose/dose reduction | 0.791 (0.258–2.427) | .682 | ||||
| Sustained virological response Yes/no | 12.116 (3.477–42.213) | <.001 | 8.546 (1.878–38.887) | .006 | ||
Abbreviations: ALT, alanine aminotransferase; AST, aspartate aminotransferase; CI, confidence interval; FIB-4, fibrosis 4 index; HBsAg, hepatitis B surface antigen; HBV, hepatitis B virus; HR, hazard ratio; NS, not significant; PegIFN, peginterferon.
aModel I included only baseline factors. Model II included both baseline and on-treatment factors.
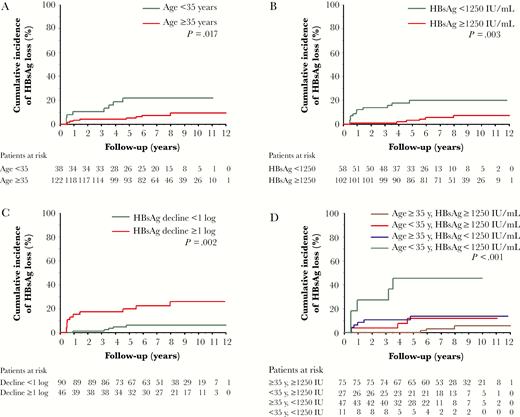
Cumulative incidence of hepatitis B surface antigen (HBsAg) loss stratified by baseline and on-treatment predictors: (A) age; (B) baseline HBsAg levels; (C) on-treatment HBsAg decline ≥1 log; and (D) age and baseline HBsAg levels.
Combining age younger than 35 years and baseline HBsAg <1250 IU/mL selected patients with the highest chance of HBsAg loss, with a cumulative incidence of 45.5% at year 4 and later years. In contrast, patients older than 35 years with baseline HBsAg ≥1250 IU/mL had the lowest chance of HBsAg loss, with the cumulative incidence of 5.6% at year 10 (P < .001; Figure 3D).
HBsAg Loss After PegIFN Therapy in Patients With and Without SVR
In patients with SVR, 21 (33.3%) cases developed HBsAg loss during the follow-up period. Among them, the cumulative incidence of HBsAg loss at 5 years was 57.1% in patients age younger than 35 years with baseline HBsAg <1250 IU/mL. Among patients either younger than 35 years or with baseline HBsAg <1250 IU/mL, the incidence of HBsAg loss were higher than 30% at year 5. But HBsAg loss was only 17% at 10 years in patients older than 35 years with baseline HBsAg ≥1250 IU/mL (P = .035; Figure 4A).

Cumulative incidence of hepatitis B surface antigen (HBsAg) loss stratified by age and baseline HBsAg levels in patients with and without sustained off-treatment virological response (SVR): (A) patients with SVR; (B) patients without SVR.
In patients without SVR, only 6 (3.5%) cases developed HBsAg loss during the follow-up period. The cumulative incidence of HBsAg loss at 5 years was 25% in patients age younger than 35 years with baseline HBsAg <1250 IU/mL, and only 2.1% at 10 years in patients older than 35 years with baseline HBsAg ≥1250 IU/mL (P = .031; Figure 4B).
Long-Term Retreatment Outcomes
During the follow-up period, 91 (39.1%) patients developed clinical relapse and were retreated with antiviral therapy, including 75 patients retreated with NUCs and 16 patients retreated with PegIFN. None of the patients who finally achieved HBsAg loss experienced clinical relapse during observation and required antiviral retreatment.
DISCUSSION
Although PegIFN has been one of the standard treatments for patients with CHB for more than a decade, the long-term HBsAg loss and HBsAg seroconversion rates after PegIFN therapy have rarely been reported in HBeAg-negative patients. In this multicenter long-term follow-up study with a median follow-up period of 7.4 years, we reported the annual incidence of HBsAg loss of 1.4% in the overall patients treated with 48 weeks’ PegIFN, while the HBsAg loss rate was much higher in patients achieving SVR, which was documented in about one-third with the annual incidence of 3.7%, indicating that SVR is an important milestone for PegIFN treatment in HBeAg-negative CHB.
The overall SVR rate of 28.9% in this study was consistent with previous reports for PegIFN therapy in HBeAg-negative patients [8, 12]. By multivariate analysis, baseline HBsAg <1250 IU/mL and on-treatment HBsAg decline were independent predictors of SVR. Baseline HBsAg levels have recently been found to predict SVR in HBeAg-negative patients [4, 11], while on-treatment HBsAg decline is a well-known predictor of SVR in both HBeAg-positive and HBeAg-negative patients [4, 15, 22, 23]. These data suggest that HBsAg is a valuable tool for both selection of patients suitable for PegIFN therapy and monitoring of patients during treatment.
The cumulative HBsAg loss rates of 4.7% and 9.4% at 3 and 5 years in this real-world study were slightly lower than the previously reported rates of 9% and 12% in the registration trial [12, 13], possibly due to the differences in race and infected HBV genotypes of the study populations. Nevertheless, our results showed that the HBsAg loss rates continuously increased to 11.8% at year 7 and 14.2% at year 10. The rate of HBsAg seroconversion after PegIFN therapy has not been reported before. We showed that HBsAg seroconversion developed in 88% of patients with HBsAg loss, with the annual incidence of 1.25% in the overall population and 3.06% in patients achieving SVR.
The incidence of a hepatitis flare related to PegIFN therapy varies among studies [24]. In our data, we did not observe an association of on-treatment ALT elevation or flare with SVR or HBsAg loss. But, interestingly, 5 of 27 cases experienced ALT elevation (>ULN, range 47–242 U/L) 3 months before the HBsAg loss in our cohort.
The reported annual rate of spontaneous HBsAg loss was about 1.2% in inactive HBV carriers and 1.5% in patients with cirrhosis [25]. In the REVEAL study cohort, the annual rate of HBsAg loss in HBeAg-negative patients with HBV DNA >2000 IU/mL was about 1%, while the annual rate of HBsAg loss was 1% and 1.8% for patients with genotype B and C, respectively [26, 27]. In HBV carriers with low viral loads, the annual rate of HBsAg loss has been shown to be 1.4%, 1.8%, and 1.9% in patients with age 28–39 years, HBsAg 100–999 IU/mL, and HBsAg 10–99 IU/mL, respectively [28]. Compared to the untreated patients, the annual HBsAg loss rate was much higher in responders to PegIFN therapy in this study (3.7%/year), and this advantage could be observed across all subgroups of patients achieving SVR by PegIFN, including cirrhosis (2%), without cirrhosis (3.93%), genotype B (3.38%), genotype C (2.71%), age younger than 35 (4.59%), and baseline HBsAg levels <1250 IU/mL (4.1%) (Supplementary Table 1).
In HBeAg-positive patients treated with PegIFN, previous report showed that 11% of overall patients and 30% of the initial responders developed HBsAg loss after a mean follow-up of 3 years [29]. In this study, the incidence rate of HBsAg loss at year 3 was 4.7% in overall patients and 15.9% in patients achieving SVR, suggesting that the probability of HBsAg loss after PegIFN therapy was lower in HBeAg-negative patients compared to HBeAg-positive cases.
In CHB patients under NUC therapy, Kim et al reported an annual HBsAg loss rate of 0.33% during a median follow-up period of 6 years [30]. Jeng et al recently showed that in HBeAg-negative patients who stopped NUCs therapy by the APASL stopping rule, the 6-year cumulative incidence of HBsAg loss was 13% with an estimated annual incidence of 1.78% [31]. These data suggest that the overall HBsAg loss rate was much higher in patients treated with PegIFN as compared to patients treated with NUCs, as the cumulative incidence of HBsAg loss reached 37% at 10 years in PegIFN responders. With the higher chance of HBsAg loss, PegIFN therapy should be encouraged in patients eligible for this therapy, especially for those with younger age and lower HBsAg levels.
Predictors of long-term HBsAg loss after PegIFN therapy have rarely been reported. In this study, we identified age younger than 35 years, baseline HBsAg levels lower than 1250 IU/mL, on-treatment HBsAg declines, and achieving SVR as independent predictors of HBsAg loss. Age and baseline HBsAg levels have been shown to predict SVR to PegIFN in HBeAg-negative patient and therefore could be associated with subsequent HBsAg loss in patients achieving SVR [11, 32].
On-treatment HBsAg decline, which is an important predictor of SVR [11, 15, 22, 23], has also been shown to predict long-term HBsAg loss after PegIFN therapy [14–16]. In this study, the annual incidence rate of HBsAg loss was 3.7% and 0.55% in patients with and without SVR, respectively, indicating that achieving SVR is the most predominant factor associated with long-term HBsAg loss. Because about one-third of patients with SVR developed HBsAg loss within 10 years, identifying those who had the highest chance with SVR before PegIFN therapy is of great clinical importance.
The optimal cutoff value of HBsAg to predict HBsAg loss in PegIFN-treated CHB has not been defined. In HBeAg-negative patients, previous studies showed that HBsAg level <10 IU/mL [28] or <20 IU/mL [33] was a strong predictor of HBsAg loss in the natural course of HBV infection. In HBeAg-negative patients treated with NUCs, HBsAg <100 IU/mL [31] or <120 IU/mL [34] at the end of treatment was shown to predict HBsAg loss after cessation of NUC therapy. In our study, we identified a cutoff value of baseline HBsAg predicting SVR and long-term HBsAg loss. The cutoff value of 1250 IU/mL predicting SVR was in accordance with previous reports [11, 32]. We also found that the cutoff value of 1250 IU/mL was most discriminative for predicting long-term HBsAg loss. The 5 year cumulative incidence of HBsAg loss was about 20% in patients with baseline HBsAg less than 1250 IU/mL (Figure 3B).
Age younger than 35 years and HBsAg less than 1250 IU/mL could select patients with the highest chance of HBsAg loss in the overall population as well as in patients with and without SVR (Figure 3D and Figure 4A and 4B). The 5-year incidence of HBsAg loss was about 57% in SVR patients fulfilling these criteria. Even in patients either younger than 35 years or with baseline HBsAg <1250 IU/mL, the cumulative incidence of HBsAg loss after achieving SVR was also higher than 30% at year 5. Further strategies, such as PegIFN combination therapies, to improve HBsAg loss rate require further exploration.
This study has some limitations. The main limitation is its retrospective design and only limited number of cases achieved HBsAg loss, even with combining data from 3 main medical centers in Taiwan. This reflects the fact that only a minority of CHB patients received PegIFN therapy and that HBsAg loss is not frequent. Second, not all patients had available HBsAg data at the end of treatment. Therefore, we could not evaluate the predictive value of HBsAg levels at end of treatment. Nevertheless, PegIFN therapy had a finite duration, and the HBsAg levels at end of treatment would not alter the treatment strategy. Our results provide the baseline predictors of long-term HBsAg loss that may help clinicians to identify those who would get most benefit from PegIFN therapy before starting treatment. Third, our study population was mainly infected with HBV genotype B (78%) and C (21%). Previous studies showed that patients with genotype A had higher rates of HBsAg loss after PegIFN therapy than other genotypes [35]. Therefore, we do not know whether the HBsAg cutoffs could be applied to other HBV genotypes.
In conclusion, in HBeAg-negative CHB patients treated with PegIFN, the probability of HBsAg loss continued to increase during long-term follow-up, with annual incidence of 1.4% in overall patients and 3.7% in patients achieving SVR. Age, baseline HBsAg levels, on-treatment HBsAg decline, and achieving SVR are key factors associated with HBsAg loss after PegIFN therapy.
Supplementary Data
Supplementary materials are available at The Journal of Infectious Diseases online. Consisting of data provided by the authors to benefit the reader, the posted materials are not copyedited and are the sole responsibility of the authors, so questions or comments should be addressed to the corresponding author.
Notes
Acknowledgments. The authors thank Clinical Research Core Laboratory, Taipei Veterans General Hospital for providing their facilities to help conduct this study.
Financial support. The work was supported by the Taipei Veterans General Hospital, Taipei, Taiwan (grant numbers V99C1-075, V100C-104, V101C-147, V103E2-001, V106B-021); and Ministry of Science and Technology, Taiwan (grant numbers NSC 100-2314-B-010-024 and MOST 105-2628-B-075-006-MY2).
Potential conflicts of interest. All authors: No reported conflicts of interest. All authors have submitted the ICMJE Form for Disclosure of Potential Conflicts of Interest. Conflicts that the editors consider relevant to the content of the manuscript have been disclosed.
Reference
Author notes
C.-Y. P and Y.-H. H contributed equally to this work.

