


Abstract
Dolutegravir (DTG) is an integrase strand-transfer inhibitor (INSTI) used for treatment of human immunodeficiency virus (HIV)–infected individuals. Owing to its high genetic barrier to resistance, DTG has been clinically investigated as maintenance monotherapy to maintain viral suppression and to reduce complication and healthcare costs. Our study aims to explain the underlying mechanism related to the emergence of a S230R substitution in patients who experienced virologic failure while using DTG monotherapy.
We evaluated the effect of the S230R substitution in regard to integrase enzyme activity, viral infectivity, replicative capacity, and susceptibility to different INSTIs by biochemical and cell-based assays.
The S230R substitution conferred a 63% reduction in enzyme efficiency. S230R virus was 1.29-fold less infectious than wild-type virus but could replicate in PM1 cells without significant delay. Resistance levels against DTG, cabotegravir, raltegravir, and elvitegravir in tissue culture were 3.85-, 3.72-, 1.52-, and 1.21-fold, respectively, in virus with the S230R substitution.
Our data indicate that the S230R substitution is comparable to the previously reported R263K substitution in some respects. Virologic failure during DTG monotherapy can occur through the development of the S230R or R263K mutation, without the need for high-level DTG resistance.
(See the and the .)
Human immunodeficiency virus type 1 (HIV-1) integrase is an enzyme that plays a critical role in the HIV-1 replication cycle by catalyzing the stable insertion of proviral DNA into the host genome in a 2-stage reaction process: 3ʹ processing and strand-transfer [1]. The new class of integrase strand-transfer inhibitors (INSTIs) inhibits the latter activity of HIV integrase and includes 3 clinically approved INSTIs to date: raltegravir (RAL), elvitegravir (EVG), and dolutegravir (DTG) [2]. Additionally, 2 investigational INSTIs, cabotegravir (CAB) and bictegravir, are currently undergoing clinical trials [3, 4].
DTG is effective in treating both treatment-naive and treatment-experienced HIV-positive individuals. DTG-based regimens showed statistically noninferior or superior virologic suppression rates when compared to combined first-line antiretroviral therapies containing RAL, efavirenz, or darunavir/ritonavir [5–7]. Unlike the 2 other approved INSTIs, DTG seems to possess a high genetic barrier to resistance, and it can be active against HIV isolates harboring certain major single RAL-associated and EVG-associated resistance mutations [8–10]. However, the preexistence of multiple major and minor RAL/EVG resistance mutations that predate DTG initiation, most notably changes in the Q148 or N155 resistance pathways, are associated with a higher rate of virologic failure with the latter drug [9]. As a consequence, when alternative treatment is not possible, DTG is commonly recommended as a 50-mg dose twice daily for individuals living with viruses that harbor INSTI resistance mutations [9]. In treatment-experienced, INSTI-naive individuals who used DTG as part of partly active combined antiretroviral therapy regimens in the SAILING clinical trial, DTG could select for the R263K integrase substitution [11]. In cell culture, R263K was also selected under DTG pressure, and this substitution was associated with low levels of resistance, decreased replicative capacity, and progressive decline in integration [12, 13]. In RAL or EVG resistance pathways, additional minor mutations often accumulate after primary resistance mutations, which further increase resistance levels and/or compensate for the reduction in replication imparted by primary mutations. By contrast, instead of restoring viral replication, R263K secondary substitutions—H51Y, M50I, and E138K—further decrease both replicative capacity and levels of integration, while increasing only modestly levels of resistance against DTG [14–16].
When used as part of a fully functional combination antiretroviral therapy regimen, DTG is robust against the emergence of resistance. In fact, only 1 patient with virologic failure involving a de novo resistance mutation has been described so far in this clinical setting: a treatment-naive patient who initiated treatment with a combination of DTG, abacavir, and lamivudine but was unable to adhere to treatment and eventually experienced treatment failure after 11.6 months with the development of a T66I substitution [17]. Somewhat surprisingly, 3.4% of treatment-naive participants (2 of 58) experienced treatment failure together with the development of resistance mutations in this study, the second case being linked to a M184V substitution in reverse transcriptase [17]. DTG-based dual therapy has proven to maintain HIV-1 suppression in a high proportion (>90%) of patients, even in highly treatment-experienced individuals with some cases of drug resistance development [3, 18–21]. During the past 2 years, clinical studies of the safety and efficacy of DTG as maintenance monotherapy have been conducted [3, 19–22]. In this clinical setting, individuals have experienced virologic failure with the development of resistance substitutions at various positions in the gene encoding integrase, including Q148H/R, N155H, or G118R [23, 24]. Results from the Dolutegravir as Maintenance Monotherapy for HIV (DOMONO) study [25], which was conducted to investigate the efficacy of DTG monotherapy as a switch maintenance option for HIV-infected patients with virologic suppression, are included in the companion article by Wijting et al [26] in this issue, which reports the characterization of viral isolates from patients who experienced virologic failure, including 3 in whom INSTI resistance–associated mutations developed at positions R263K, N155H, or S230R.
To date, the S230R substitution has not been exhaustively characterized in regard to viral replication and INSTI susceptibility. Similar to R263K, S230R is found within the integrase C-terminal domain, a region that exhibits high conformational flexibility during DNA binding [27]. This missense nonpolymorphic mutation was previously observed accompanying other primary mutations in tissue culture selection experiments with EVG or RAL, but it has little effect on HIV susceptibility to both drugs when tested as a primary single mutation [28, 29]. It may act in combination with other substitutions by moderately decreasing susceptibility to RAL and EVG [28]. The S230R substitution was also observed together with the A49G and R263K mutations in 1 participant with virologic failure in the SAILING trial [30]. Results from in vitro tissue culture selection experiments with DTG also showed infrequent and transient emergence of this substitution [31].
In our study, to understand the role of the S230R substitution in virologic failure among patients using DTG monotherapy, we characterized S230R in regard to integrase enzymatic activity, viral fitness, and resistance against INSTIs, using biochemical and cell-based assays. We found that S230R caused a >50% reduction of overall integrase activity but had minimal (<20%) impact on viral infectivity and replicative capacity. Phenotypic resistance analysis showed a 2–4-fold decrease in the half-maximal inhibitory concentration (IC50) of DTG. Our results suggest that mutations conferring low levels of drug resistance against DTG can be detected after virologic failure in very specific clinical circumstances, such as monotherapy or functional monotherapy. Whether such mutations are clinically relevant when DTG is used as part of a 3-drug fully active combination antiretroviral therapy regimen remains to be fully understood.
MATERIALS AND METHODS
Cells and Reagents
PM1, HEK 293T, and TZM-bl reporter cells were obtained from the National Institutes of Health (NIH) AIDS Reagent Program, National Institute of Allergy and Infectious Diseases, NIH, from Dr Marvin Reitz [32] (for PM1 cells), Dr Andrew Rice [33] (for HEK 293T cells), and Dr John C. Kappes, Dr Xiaoyun Wu and Tranzyme (for TZM-bl cells) [34–36]. Cell culture protocols were described previously [37]. RAL, EVG, DTG, and CAB were provided by Merck, Gilead Sciences, and GSK.
Expression and Purification of Recombinant Integrases
The pET-15b plasmid coding for subtype B integrase containing the S230R mutation (pET-15B-INS230R) was generated by site- directed mutagenesis, using pET-15b-INWT as a template and the following primers: S230R: 5ʹ-TTTCCAAACTGGATCTCT CCTGTCCCTGTAATAAACC-3ʹ (sense) and 5ʹ-GGTTTATTACAGGGACAGGAGAGATCCAGTTTGGAAA-3ʹ (antisense) [14]. Selected clones were sent for DNA sequencing to confirm the presence of the desired mutation. The protocol for expression and purification of His-tagged HIV-1 integrases, using the nickel–nitrilotriacetic acid affinity chromatography matrix (Qiagen) under native conditions, was previously described [12].
Cell-Free Strand Transfer Assay
Integrase strand-transfer activities of wild-type integrase (INWT) and integrase with the S230R mutation (INS230R) were executed by measuring time-resolved fluorescence, based on a protocol previously established in our laboratory [15]. A nonlinear regression Michaelis-Menten model within the GraphPad Prism 5.0 software was used to determine maximal strand-transfer activity (Vmax) and half of the concentration of DNA necessary to reach Vmax (Km).
Susceptibility of Purified Integrases to Antiviral Compounds
Strand-transfer experiments were performed in the presence of 0–1000 nM DTG, RAL, EVG, or CAB. A total of 25 μL of drug was added before adding 25 μL of target DNA duplexes to the 96-well plates, followed by incubation for 1 hour at 37°C. To calculate the inhibitor constant of each drug, Ki, which is the concentration required to yield 50% maximal inhibitory activity, all values were fit to sigmoid dose-response curve by using GraphPad Prism 5.0 software.
Viruses
The pNL4-3IN(S230R) infectious molecular clone containing S230R was produced by site-directed mutagenesis, using pNL4.3 as template [12]. The pNL4-3 plasmid was obtained through the NIH AIDS Reagent Program, from Dr Malcolm Martin [38]. The primer set used for mutagenesis was as described above, and the presence of mutations was confirmed by sequencing. WT and S230R homogenous viruses were produced by transfection, using 293T cells as previously described [37]. A reverse transcriptase assay was performed for quantification of viruses, as previously described [39]. Briefly, 10 μL of culture fluid was added to 0.5 U/mL of poly(rA)/p(dT)12–18 template/primer, 50 mM Tris-HCl, pH 7.8; 75 mM KCl; 5 mM dithiothreitol; 5 mM MgCl2; 0.05% Triton X-100; 2% ethylene glycol; 0.3 mM reduced glutathione; and 5 μCi of [3H]dTTP (70–80 Ci/mmol; 2.5 mCi/mL). Reverse transcription was allowed to occur at 37°C for 4 hours, followed by precipitation of products with 200 μL of 10% trichloroacetic acid and 20 mM sodium pyrophosphate for 30 minutes on ice. Radioactive precipitates were filtered through Millipore 96-well MultiScreen HTS FC filter plates, washed twice with 200 μL of 10% trichloroacetic acid and 150 μL of 95% ethanol, and quantified by liquid scintillation spectrometry, using a Perkin-Elmer 1450 MicroBetaTriLux microplate scintillation and luminescence counter.
Infectivity in TZM-bl Cells
Relative infectivity of the NL4-3IN(S230R) or NL4-3IN(WT) viruses was measured using a noncompetitive short-term infectivity assay in 30000 TZM-bl cells, as previously described [15]. Resulting luciferase activities were normalized relative to reverse transcriptase levels. Levels of viral infectivity were represented as the relative 50% effective concentration (EC50). The EC50 is the amount of virus needed to stimulate TZM-bl cells to produce half of the maximal luciferase activity. The results were analyzed by GraphPad Prism 5.0 software, using a log(agonist) versus response-variable slope model to determine EC50 values.
Drug Susceptibility Assays
In vitro drug susceptibility assays were performed by infection of 30000 TZM-bl cells with a volume of NL4-3IN(WT) or NL4-3IN(S230R) viruses equivalent to a reverse transcription activity of 67500 units. Cells were plated with serial dilutions from 0 to 10 µM of RAL, EVG, DTG, or CAB 24 hours before infection. Luciferase levels were measured 48 hours after infection, using a protocol similar to that of the infectivity assay, except that IC50 values were determined using a log(inhibitor) versus response-variable slope model in GraphPad Prism 5.0.
Replication Capacity in PM1 Cells
To monitor replicative capacity in tissue culture, 30000 PM1 cells were infected with 67500 reverse transcriptase units of either NL4-3IN(WT) or NL4-3IN(S230R) viruses in 96-well plates for 1 hours at 37°C, washed to remove unbound viruses, and then plated in Roswell Park Memorial Institute medium. At days 3, 6, 9, 13, 17, and 21 after infection, cell-free medium containing viruses was withdrawn to measure reverse transcriptase activity. At each time point, 100 μL of fresh medium containing 10000 uninfected PM1 cells was added to the culture to allow new rounds of viral infection to occur.
Statistical Analysis
Each experiment was performed independently at least 2 times, with experiments performed in triplicate each time, except when mentioned otherwise. Strand-transfer activities, relative infectivity indexes, and fold changes in EC50 and IC50 were normalized to WT values. Results are expressed as means ± standard errors of the mean (SEM) [28]. Student t tests were performed to measure the statistical significance of differences between data sets, defined as a P value of < .05. Analyses were performed using the OpenEpi Toolkit (available at: http://www.openepi.com).
RESULTS
S230R Substitution Decreases Integrase Strand-Transfer Activity
First, to determine the optimal concentration of enzymes for the strand-transfer assay, we used various concentrations of purified recombinant INWT and INS230R, ranging from 0 to 1600 nM, in the presence of a fixed amount of target DNA (20 nM). Figure 1A shows that maximal activities were achieved at 400 nM for both INWT (mean activity [±SEM], 4022 ± 448.9 relative fluorescence units [RFU]/hour) and INS230R (915.17 ± 105.6 RFU/hour). The enzymatic activity of INWT was 2–6-fold higher than that of INS230R at all protein concentrations tested (P = .0005 at 400 nM integrase, by the Student t test; n = 6). At 12.5 nM, the lowest protein concentration, the strand-transfer activity of INWT was 2-fold higher than that of INS230R, and this ratio reached 4.4– 6.2-fold for higher protein concentrations (Figure 1A). Increasing the concentration of purified integrases from 400 nM to 800 nM resulted in an approximately 50% reduction in catalytic activity for both enzymes.
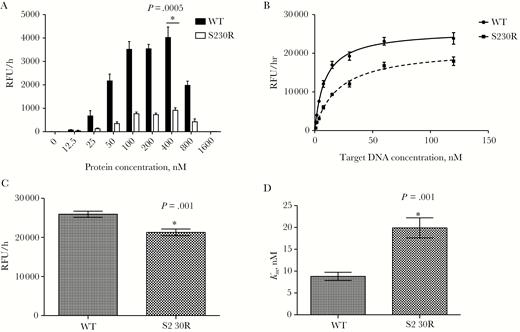
Mean strand-transfer activities (±standard errors of the mean) of purified recombinant wild-type integrase (WT) and integrase bearing the S230R substitution (S230R). *P < .05 compared to WT, by the Student t test (OpenEpi Toolkit). A, Strand-transfer activity in the presence of 20 nM target DNA and increasing concentrations of purified integrases. For each protein concentration, assays were performed twice independently, in triplicate, yielding 6 independent values. B, Strand-transfer activity in the presence of 400 nM purified WT or S230R integrase and increasing concentrations of target DNA. For each protein, assays were performed 3 times independently, in triplicates, yielding 9 independent values for each target DNA concentration and protein. C, Calculated maximum strand-transfer activities (Vmax) for WT and S23OR integrases, using protein concentrations specified in panel B. D, Half of the concentration of DNA necessary to reach Vmax (Km) for purified WT and S23OR integrases, using values from panel B.
To compare the overall enzyme efficiency of INWT and INS230R, we performed strand-transfer assays in the presence of various concentrations of target DNA, ranging from 0 to 128 nM. Maximal activity saturation curves were generated for both enzymes, from which the maximal strand-transfer activity of INS230R was calculated (Figure 1B). The calculated mean Vmax (±SEM) was 25917 ± 782.5 RFU/hours for INWT as compared to 21287 ± 851 RFU/hours for INS230R (Figure 1C and Table 1), which means that the reaction rate of INS230R was about 18% lower than that of INWT (P = .001 by the Student t test; n = 9). The mean Km (±SEM) was 8.9 ± 0.95 nM for INWT and 19.9 ± 2.30 nM for INS230R (P = .001 by the Student t test; n = 9), which was calculated by fitting the curve for each enzyme (Figure 1D and Table 1). This suggests that INS230R has an approximately 2.3-fold lower affinity than the WT enzyme for the DNA target. We also evaluated the overall enzyme performance by calculating the Vmax/Km ratios of INWT and INS230R, which reflect both binding and catalytic activities. We observed that S230R caused a 63% reduction in the overall catalytic strand-transfer efficiency of integrase (Table 1).
Comparison of Strand-Transfer Activity of Purified Recombinant Wild-Type and S230R Integrase
| Recombinant Enzyme | Vmax, RFU/h, Mean (95% CI) | Pa | Km, nM, Mean (95% CI) | Fold Change | Pa | Vmax/Km | Fold Change |
|---|---|---|---|---|---|---|---|
| Wild type | 25917 (24341–27494) | 8.9 (6.97–10.80) | 1 | 2918 | 1 | ||
| S230R | 21287 (19572–23001) | .001 | 19.9 (15.26–24.55) | 2.26 | .001 | 1070 | 0.37 |
Each experiment was repeated 3 times in triplicate for each integrase concentration.
Abbreviations: CI, confidence interval; Km, half of the concentration of DNA necessary to reach Vmax; RFU, relative fluorescence units; Vmax, maximal strand-transfer activity.
aCompared to wild-type enzyme, by the Student t test (OpenEpi Toolkit). Values < .05 are considered statistically significant.
Effects of the S230R Substitution on Susceptibility of Purified Integrases to DTG, RAL, EVG, and CAB
To evaluate the impact of S230R on phenotypic resistance of purified integrases to RAL, EVG, DTG, and CAB, we performed strand-transfer assays of purified INWT and INS230R in the presence of increasing drug concentrations (range, 0–1000 nM). Inhibition constants (Ki values), indicators of each inhibitor’s potency, were determined from the dose-response curves (Table 2). DTG inhibited INWT and INS230R, with Ki values of 1.27 nM and 3.33 nM, respectively, representing a 2.62-fold decrease in DTG susceptibility for INS230R (Table 2). S230R also exhibited low levels of resistance against CAB (1.92-fold), RAL (2.16-fold), and EVG (3.19-fold; P values are presented in Table 2).
In Vitro Susceptibilities of Purified Recombinant Integrase to Dolutegravir (DTG), Cabotegravir (CAB), Raltegravir (RAL), and Elvitegravir (EVG) in Biochemical Assays
| Recombinant Enzyme | DTG | CAB | RAL | EVG | ||||||||
|---|---|---|---|---|---|---|---|---|---|---|---|---|
| Ki, nM, Mean ± SEM | Relative Fold Change | Pa | Ki, nM, Mean ± SEM | Relative Fold Change | Pa | Ki, nM, Mean ± SEM | Relative Fold Change | Pa | Ki, nM, Mean ± SEM | Relative Fold Change | Pa | |
| Wild type | 1.27 ± 0.13 | 1 | 1.76 ± 0.41 | 1 | 6.40 ± 0.5 | 1 | 2.30 ± 0.13 | 1 | ||||
| S230R | 3.33 ± 0.22 | 2.62 | .004 | 3.38 ± 0.55 | 1.92 | .08 | 13.8 ± 5.5 | 2.16 | .3 | 7.34 ± 0.47 | 3.19 | .009 |
Each experiment was repeated 3 times in triplicate for each drug concentration.
Abbreviations: Ki, inhibitor constant; SEM, standard error of the mean.
aCompared to wild-type enzyme, by the Student t test (OpenEpi Toolkit). Values < .05 are considered statistically significant.
The S230R Substitution Slightly Decreases Viral Infectiousness
Given the clinical relevance of the S230R substitution, we also examined its effect on viral infectivity. In cell-based assays, the NL4.3IN(S230R) virus manifested a 1.29-fold impairment in viral infectivity, with an EC50 of 613834 reverse transcriptase units, compared with WT virus, which displayed an EC50 of 473473 reverse transcriptase units (Figure 2A). Differences in EC50 between NL4.3IN(WT) and NL4.3IN(S230R) were statistically significant (P = .016 by the Student t test).
![A, Mean relative viral infectivity (±standard error of the mean [SEM]) in TZM-bl cells of wild-type (WT) and S230R viruses, measured by luciferase fluorescence, 48 hours after infection. Values were calculated from 3 independent experiments, each performed in triplicate, yielding 9 values per point. B, Viral replication kinetics over a 21-day period in PM1 cells. PM1 cells were infected with the same amount of reverse transcriptase (RT) for all viral stocks. Levels of RT in cell-free culture fluids were monitored by quantitative RT assays. Means (±SEMs) of 3 different experiments, each performed in triplicate, for each virus are presented. EC50, 50% effective concentration; RLU, relative luminescence units; RTU, reverse transcriptase units. aCompared to wild-type genotype, by the Student t test (OpenEpi Toolkit). A value < .05 is considered statistically significant.](https://oup.silverchair-cdn.com/oup/backfile/Content_public/Journal/jid/218/5/10.1093_infdis_jiy175/2/m_jiy17502.jpeg?Expires=1749928591&Signature=Bl-cum6dZGX~4HmWQh16kodQCAXL6o9ScbaFlnmkdqDt5d7CTIHt1gBd9tWXHuCya2PfTpIEu44U12C1grXEnAAYaO7vxstHFbP5DzxmSuIR1sZ2EK8oNa-FB5zwUp7~qlhQ8KlWq~7ja-4G1I0srh9YfiN2TXkXGluf0qhUGI37NxVssxuWsJ0JMIZzen6H3n-6H2ZNgsLfFtdGAmV6BeV5bBQTPwpJCn3b0i-NJIhCPPoMgC7yvc~46QoZf~imrGnMMWydclgj71S-m2QKaq5mgbVDdlmHikgMH3ipXc8xiaUslbAV6wISy3nSa6osNahXg1VKkcN0EcIA9W60iQ__&Key-Pair-Id=APKAIE5G5CRDK6RD3PGA)
A, Mean relative viral infectivity (±standard error of the mean [SEM]) in TZM-bl cells of wild-type (WT) and S230R viruses, measured by luciferase fluorescence, 48 hours after infection. Values were calculated from 3 independent experiments, each performed in triplicate, yielding 9 values per point. B, Viral replication kinetics over a 21-day period in PM1 cells. PM1 cells were infected with the same amount of reverse transcriptase (RT) for all viral stocks. Levels of RT in cell-free culture fluids were monitored by quantitative RT assays. Means (±SEMs) of 3 different experiments, each performed in triplicate, for each virus are presented. EC50, 50% effective concentration; RLU, relative luminescence units; RTU, reverse transcriptase units. aCompared to wild-type genotype, by the Student t test (OpenEpi Toolkit). A value < .05 is considered statistically significant.
Replication Kinetics of NL4.3IN(S230R) Resistant Virus in PM1 Cells
To confirm whether S230R causes a replicative defect, we evaluated the ability of the NL4.3IN(S230R) virus to replicate in PM1 cells over a 21-day period, compared with the NL4.3IN(WT) virus (Figure 2B). At day 3 after infection, we obtained detectable and comparable reverse transcriptase activities from the culture fluids of cells infected by either WT or S230R mutant viruses, suggesting that the replication of S230R virus was not delayed as compared to that of WT virus. The reverse transcriptase levels continued to increase and reached their peaks at day 9 after infection for both viruses (Figure 2B). At both 6 and 9 days after infection, the average reverse transcriptase activities were 14% higher for the WT virus than for the S230R virus (P = .029 and P = .025, respectively, by the Student t test), suggesting that S230R decreases HIV-1 replicative capacity by 14%. At other time points, we observed nearly identical reverse transcriptase levels for WT and S230R viruses (Figure 2B).
Phenotypic Susceptibility of NL4.3IN(S230R) Virus Against DTG, CAB, EVG, and RAL in Tissue Culture
To confirm results of cell-free analysis of the effects of S230R on resistance to RAL, EVG, DTG, and CAB, we conducted phenotypic resistance assays by using TZM-bl cells. HIV-1 susceptibility to the inhibitory effects of INSTIs was measured using the IC50, which is the concentration of inhibitor required to reduce infection by half. As shown in Figure 3, S230R increased IC50 values of both DTG and CAB. Compared with the IC50 of WT virus and in agreement with data from strand-transfer assays in the presence of INSTIs, S230R caused a 3.8-fold decrease in susceptibility to DTG and CAB (Table 3). For RAL and EVG, S230R virus displayed 1.52-fold and 1.21-fold reductions in susceptibility, respectively, relative to WT virus (Table 3 and Figure 3). In sum, S230R conferred higher levels of resistance against DTG and CAB than against RAL and EVG.
Viral Susceptibilities of Wild-Type and S230R Viruses to Dolutegravir (DTG), Cabotegravir (CAB), Raltegravir (RAL), and Elvitegravir (EVG) in Cell-Based Assays
| Virus | DTG | CAB | RAL | EVG | ||||||||
|---|---|---|---|---|---|---|---|---|---|---|---|---|
| Relative IC50, nM, Mean (95% CI) | Fold Change | Pa | Relative IC50, nM, Mean (95% CI) | Fold Change | Pa | Relative IC50, nM, Mean (95% CI) | Fold Change | Pa | Relative IC50, nM, Mean (95% CI) | Fold Change | Pa | |
| Wild type | 2 (1.63–2.45) | 1 | 0.22 (.18–.27) | 1 | 9.33 (8.71–9.99) | 1 | 0.84 (.60–1.18) | 1 | ||||
| S230R | 7.69 (6.74–8.8) | 3.85 | .02 | 0.82 (.68–1) | 3.72 | .019 | 14.18 (13.24–16.68) | 1.52 | .013 | 1.02 (.66–1.59) | 1.21 | .57 |
Each experiment was repeated 3 times in triplicate for each drug concentration.
Abbreviations: CI, confidence interval; IC50, half-maximal inhibitory concentration.
aCompared to wild-type virus, by the Student t test (OpenEpi Toolkit). Values < .05 are considered statistically significant.
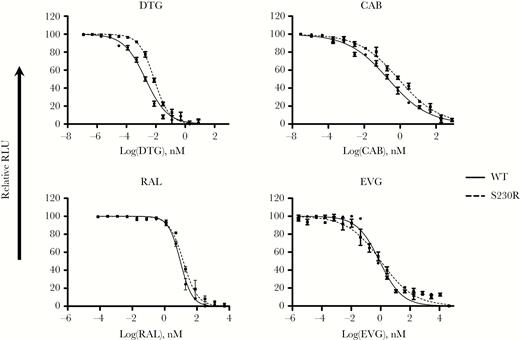
Dose-response infectivity curves in the presence of dolutegravir (DTG), cabotegravir (CAB), raltegravir (RAL), and elvitegravir (EVG) for wild-type (WT) and S230R viruses. Data reflect viral resistance to RAL, EVG, DTG, and CAB in TZM-bl cells. TZM-bl cells were infected with NL4.3IN(WT) or NL4.3IN(S230R) virus over 48 hours, and luciferase levels were measured. Infectivity of NL4.3IN(WT) virus is shown for comparison. Dose-response curves were produced from the compilation of 3 independent experiments, each performed in triplicate. Error bars indicate means (±standard errors of the mean). RLU, relative luminescence units.
DISCUSSION
Originally, S230R was described as a secondary resistance mutation selected in vitro with diketo acid L-708906, one of the first INSTIs to be developed [29]. Later, this substitution was observed as a S230R/S mixture combined with one or more of the major resistance substitutions at positions Q148R, E92Q, and/or T66I under EVG drug pressure [28]. In the phase 2 and 3 clinical trials that led to the regulatory approval of RAL, S230R was found to be associated with Y143 substitutions, preferentially Y143C, in patients who experienced virologic failure [40, 41]. The companion article in this issue, describing the results from the DOMONO study, reports the emergence of S230R in isolation in 2 patients who experienced virologic failure during DTG monotherapy [26]. The first patient had plasma HIV-1 RNA levels of 1570 copies/mL and had experienced virologic suppression during efavirenz/tenofovir disoproxil fumarate/emtricitabine treatment for 25 months before switching to DTG 50 mg once daily. The second patient had experienced virologic suppression during DTG/ABC/3TC treatment for 8 months before switching to DTG monotherapy. Viral loads in this patient remained <20 copies/mL until week 29, when they increased to 700 copies/mL and S230R was detected in the integrase sequence. Anecdotally, S230R was detected in viruses isolated from one humanized mouse that did not achieve durable suppression of HIV viremia after 4 months of DTG monotherapy [42]. It should be noted that S230N but not S230R is a natural polymorphism that has been observed in drug-naive patients [43]. Together, these data suggest that S230R is a genuine DTG resistance substitution. Accordingly, we characterized its effects in regard to integrase activity, viral replication, and susceptibility to INSTIs, to further appreciate its clinical implications for DTG therapy.
Our strand-transfer assays showed only a modest (18%) reduction in maximum strand-transfer activity with the INS230R enzyme compared to INWT (Figure 1C and Table 1). This is consistent with results of a previous study, which also did not show any significant reduction in strand-transfer activity for INS230R [29]. In addition, we found that S230R was associated with a 2.3-fold decrease in integrase binding affinity for target DNA. The Vmax/Km value revealed that S230R impaired the overall integrase performance to 63% of that of WT integrase (Table 1). This reduction is comparable to levels previously reported for R263K [12]. Most substitutions associated with resistance against INSTIs are mapped to the catalytic core domain of integrase, with only 2 residues (R263K and S230R/N) among 38 substitutions residing within the C-terminal domain. It has been reported that the C-terminal domain is important for integrase multimerization, interaction with host factors, and viral DNA binding. For both WT and S230R proteins, concentrations >400 nM resulted in an approximately 50% decrease in catalytic activity (Figure 1A), likely because of the formation of high-order inactive integrase multimers. Cross-linking studies demonstrated that the interaction between the integrase C-terminal domain and viral DNA involves residues 230, 246, 262, 263, and 264 [44–46]. Elsewhere, X-ray crystallography and cryoelectron microscopy revealed that R263 and surrounding residues participate in integrase interaction with viral DNA [47, 48]. Based on these structural models, in the context of active integrase tetramers, R263K may cause changes to the conformation of the catalytic site, through multiple relevant hydrogen bond interactions between amino acids, that explain its reported negative effect on integrase–viral DNA binding affinity [12]. It should also be noted that both S230 and R263 residues are located on flexible loops and turns lying at the surface of proteins that are often involved in different biochemical interactions [27]. It is thus possible that the S230R substitution behaves in a similar manner as R263K to impair strand transfer.
When S230R is present as an individual mutation, previous reports indicated that it did not cause a large reduction in EVG or RAL susceptibility in vitro [27–29]. Using both biochemical and cell culture assays, we confirmed these results in this study. In addition, we demonstrated that, in cell-free assays, both CAB and DTG may still remain active against the INS230R mutant, with <3-fold increases in Ki values for these drugs, compared with INWT. Similarly, S230R conferred an approximately 4-fold increase in resistance against DTG or CAB in cell culture. Our viral infectivity replication assays showed that the infectiousness of S230R-containing virus was 1.3-fold lower than that of the WT virus and that its replication kinetics were almost identical to those of WT. Only a minimal (14%) reduction in peak viral replication was observed, compared with WT. This contrasts with results from biochemical assays that showed that INS230R displayed a substantial (63%) loss of enzyme activity relative to INWT. In this regard, long terminal repeat–binding and 3ʹ-processing assays may further clarify the effect of S230R on integrase activities.
The same reasons may help explain the differences between resistance levels measured with purified recombinant enzymes (Table 2) and those obtained with viruses (Table 3). Notably, IC50 values are dynamic measures, whereas Ki values are constant values. Regarding viral fitness and INSTI susceptibility, R263K resulted in a 1.7-fold decrease in viral infectiousness and an approximately 3–4-fold increase in DTG IC50 values [12, 49]. Given its relative benign effect on fitness, the rare occurrence of the S230R substitution in the clinic or during in vitro selection may be because it typically requires a G-to-C transversion, rather than an easier G-to-A transition as for R263K [31, 50]. N155H was another substitution described to have a significant negative impact on strand-transfer activity (fold change in Km of 2.72 as compared to WT) and viral infectivity and to confer minor changes in IC50 of DTG in vitro, but the effects were sufficient to cause virologic failure in one patient during DTG monotherapy [49]. The current study demonstrates that the S230R substitution caused similar effects on strand-transfer activity, viral replicative capacity, and phenotypic resistance against DTG.
Notes
Acknowledgments. We thank Maureen Oliveira and Ilinca Ibanescu, for technical support; Dr Hongtao Xu, for helpful advice; and Estrella Moyal and Shalom Spira, for assistance with the preparation of the manuscript.
This article is dedicated to the memory of Dr Mark Wainberg, our mentor, colleague, and friend, who tirelessly advocated for better treatments for those affected by HIV.
Financial support. This work was supported by the CIHR Canadian HIV Trials Network (postdoctoral fellowship to H. T. P.).
Potential conflicts of interest. All authors: No reported conflicts. All authors have submitted the ICMJE Form for Disclosure of Potential Conflicts of Interest. Conflicts that the editors consider relevant to the content of the manuscript have been disclosed.

