


Abstract
Transmission is driving the global drug-resistant tuberculosis (TB) epidemic; nearly three-quarters of drug-resistant TB cases are attributable to transmission. Geographic patterns of disease incidence, combined with information on probable transmission links, can define the spatial scale of transmission and generate hypotheses about factors driving transmission patterns.
We combined whole-genome sequencing data with home Global Positioning System coordinates from 344 participants with extensively drug-resistant (XDR) TB in KwaZulu-Natal, South Africa, diagnosed from 2011 to 2014. We aimed to determine if genomically linked (difference of ≤5 single-nucleotide polymorphisms) cases lived close to one another, which would suggest a role for local community settings in transmission.
One hundred eighty-two study participants were genomically linked, comprising 1084 case-pairs. The median distance between case-pairs’ homes was 108 km (interquartile range, 64–162 km). Between-district, as compared to within-district, links accounted for the majority (912/1084 [84%]) of genomic links. Half (526 [49%]) of genomic links involved a case from Durban, the urban center of KwaZulu-Natal.
The high proportions of between-district links with Durban provide insight into possible drivers of province-wide XDR-TB transmission, including urban–rural migration. Further research should focus on characterizing the contribution of these drivers to overall XDR-TB transmission in KwaZulu-Natal to inform design of targeted strategies to curb the drug-resistant TB epidemic.
Drug-resistant tuberculosis (TB) is a global crisis, causing an estimated 1.2 million cases each year [1]. Extensively drug-resistant TB (XDR-TB) has now been reported from 123 countries and is associated with mortality rates of 50%–90% [2–4]. Although drug-resistant TB strains are initially created by selection of drug-resistant mutants during treatment (acquired resistance), recent studies show that the majority of drug-resistant TB cases now arise due to transmission of already drug-resistant strains [5, 6]. This shift makes clear the urgent need for interventions to prevent transmission.
Molecular epidemiology studies have consistently shown that close contacts account for only a minority of secondary TB cases in settings with high TB incidence, suggesting that a substantial proportion of transmission may occur as a result of “casual” contact in the community [7–11]. Although modeling and social mixing studies support this hypothesis and point to public transportation, schools, and workplaces as likely transmission sites, this has not been demonstrated directly [12–14]. Understanding the role of contacts proximate to or distant from the home can generate hypotheses about the modes of contact driving transmission. The advent of bacterial whole-genome sequencing (WGS) offers new opportunities to identify TB cases that are likely to be linked through transmission, by discriminating between TB isolates at the level of single-nucleotide polymorphisms (SNPs). Isolates from different patients that differ by small numbers of SNPs are considered likely to represent a transmission event. Recent studies have employed WGS to identify probable transmission events, map chains of transmission in TB outbreaks, and describe the burden of TB disease due to recent infection as compared to reactivation [10, 15–20]. However, WGS has been underutilized to describe broader, population-level patterns of transmission in TB-endemic settings.
The spatial scale of disease transmission can provide insight into the settings and, by extension, the modes of contact that contribute to transmission. Tuberculosis transmission requires air exchange—and therefore close proximity—between an infectious and susceptible person. The nature and location of these interactions define the relevant geographic scale for person-to-person interactions resulting in transmission [21, 22]. For example, short distances between transmission-linked cases may indicate that local contacts in, or close to, the household are most important in transmission. Alternatively, transmission links found across longer distances may indicate that long-distance contacts, may play an important role in disseminating disease. Previous geospatial analyses in TB have focused on the spatial distribution of cases, rather than the spatial scale of transmission links. Combining geospatial analysis with WGS data has the potential to provide more comprehensive information about the dynamic process of disease transmission.
We combined Mycobacterium tuberculosis (Mtb) WGS and geographic data to (1) evaluate the spatial scale of XDR-TB transmission in KwaZulu-Natal, South Africa, and (2) quantify the proportion of transmission occurring within and between municipal districts in KwaZulu-Natal. Understanding the spatial scale and patterns of TB transmission can identify specific geographic areas and demographic groups that contribute to ongoing transmission and toward which interventions can be targeted.
METHODS
Setting
South Africa has among the highest rates of TB globally, with 59% of TB patients coinfected with human immunodeficiency virus (HIV) [1, 23]. KwaZulu-Natal province, which comprises 11 districts and has a population of 10.3 million, has the highest TB and XDR-TB burden (3 per 100000) in South Africa [24–26]. The most populous district, eThekwini, is home to the city of Durban, a common destination for employment and educational opportunities. The population in KwaZulu-Natal is highly mobile; a recent study found that more than a third of the population had changed residence in the past 2 years [27].
Study Design and Procedures
The Transmission of HIV-Associated XDR-TB (TRAX) study is a cross-sectional study that enrolled culture-confirmed XDR-TB patients diagnosed from 2011 to 2014 in KwaZulu-Natal. Detailed methods of the TRAX study have been previously published [5]. In brief, we identified XDR-TB cases through the single referral laboratory that conducts drug-susceptibility testing for all public healthcare facilities in KwaZulu-Natal. All participants provided written informed consent; for deceased or severely ill participants, consent was obtained from next of kin.
We interviewed participants and performed medical record review to collect demographic information and medical history. Participants reported the locations of residences, schools, employment, hospital admissions, and other congregate locations frequented in the 5 years preceding XDR-TB diagnosis. A Global Positioning System (GPS) coordinate location was collected at the location of each participant’s home residence.
Whole-Genome Sequencing
The diagnostic XDR Mtb isolate was obtained for all participants and recultured on Löwenstein–Jensen slants. We conducted population sweeps, extracted genomic DNA, and prepared sequencing libraries using Nextera DNA kits (Illumina). Raw paired‐end sequencing reads were generated on the Illumina (MiSeq) platform and aligned to the H37Rv reference genome (NC_000962.3) using the Burrows–Wheeler Aligner. All isolates had reads covering >99% of the reference genome, and the lowest mean coverage depth for any isolate was 15×. SNPs were detected using standard pairwise resequencing techniques (Samtools version 0.1.19) against the reference and filtered for quality, read consensus (>75% reads for the alternate allele), and proximity to indels (>50 bp from any indel). SNPs in or within 50 bp of hypervariable PPE/PE gene families, repeat regions, and mobile elements were excluded [28]. Alignment files can be found at the National Center for Biotechnology Information Bioproject PRJNA476470.
Statistical Analysis
We defined a genomic link as a pair of XDR-TB cases (“case-pair”) with ≤5 SNP differences between their Mtb sequences [20, 29, 30]. We mapped and calculated median geographic distance between the home residences of genomically linked cases using the sp and geosphere packages in R 3.4.1 software [31, 32].
We stratified distances between genomically linked cases by sex, given historically distinct migratory behavior among male and females in sub-Saharan Africa. We also stratified by HIV coinfection, since the influence of HIV on the susceptibility, progression, and transmissibility of TB remains uncertain [9, 29, 33–35]. Last, we stratified by strain type, by comparing pairs of the most common Mtb strain type in KwaZulu-Natal, LAM4, with other strain types. We conducted our analysis at varying SNP thresholds (≤3 SNPs, ≤1 SNP) to assess the robustness of results to this choice.
To describe patterns of transmission by district of residence, we classified each case according to the district of their home residence and calculated the proportion of between- and within-district genomic links for all districts. We also calculated the proportion of pairs in each district with links to the urban district of eThekwini.
Sensitivity Analysis of Differential Enrollment in TRAX by District
To assess whether our results were sensitive to differential enrollment of XDR cases by district, we compared our results to those we might have observed had we enrolled all diagnosed cases. We used the complete register of diagnosed XDR-TB cases from the referral laboratory to calculate the fraction of diagnosed cases from each district that participated in TRAX (enrollment fraction). For within-district links, we adjusted the number of genomic links by a factor of the inverse enrollment fraction. For between-district links, we adjusted the number of links using the mean of the inverse enrollment fractions for both districts. We compared the proportions of within- and between-district links calculated using these enrollment fractions to the proportions we observed.
As cases from rural areas may have reduced access to high-quality healthcare services, we hypothesized they may be underdiagnosed, and thus less likely to be enrolled, compared to cases from the urban eThekwini district [36, 37]. To examine the effect of this potential source of bias, we varied our assumptions about the extent of this overenrollment (assuming the enrollment fraction was anywhere from 20% to 40% higher in eThekwini than in other districts) and repeated our analysis of between- and within-district links.
Ethical Considerations
The study was approved by the institutional review boards of Emory University, Albert Einstein College of Medicine, and the University of KwaZulu-Natal, and by the Centers for Disease Control and Prevention’s National Center for HIV/AIDS, Viral Hepatitis, STD, and TB Prevention.
RESULTS
Between 2011 and 2014, we screened 521 of 1027 (51%) culture-confirmed XDR-TB patients diagnosed in KwaZulu-Natal and enrolled 404 (78% of screened) (Figure 1). TRAX participants were similar to all diagnosed XDR-TB cases in terms of age (P = .52), sex (P = .76), and district of diagnosing facility (P = .70). Among the 404 participants, 234 (58%) were female, with a median age of 34 years (interquartile range [IQR], 28–43 years). Three hundred eleven (77%) participants were HIV infected, of whom 236 (76%) were on antiretroviral therapy and 155 (50%) were virologically suppressed at enrollment (viral load <400 copies/mL) (Table 1). Half (n = 204 [50%]) of participants reported living in urban subdistricts, and 133 (33%) participants lived in eThekwini district. Mobility of TRAX participants was high, with 89 (22%) participants reporting living at a different residence than their current residence in the previous 5 years; 41 (46%) of those residences were in a district other than their current residence. Interdistrict movement was also common; of those participants that reported spending >2 hours per week at congregate locations (n = 254), 93 (37%) named a congregate location in a different district than their current residence.
Characteristics of Participants in the Transmission of Human Immunodeficiency Virus–Associated Extensively Drug-Resistant Tuberculosis (TRAX) Study Cohort, and Comparison to Subset With Whole-Genome Sequencing Results and With Genomic Links—KwaZulu-Natal Province, South Africa
| Characteristic | TRAX Cohort (n = 404) | Cases With WGS (n = 344) | P Valuea | Genomically Linked Cases (≤5 SNPs) (n = 182) | P Valueb |
|---|---|---|---|---|---|
| Demographic characteristics | |||||
| Female sex | 234 (58) | 202 (59) | .44 | 111 (61) | .37 |
| Age, y, median (IQR) | 34 (28–43) | 34 (29–43) | .19 | 34 (29–44) | .97 |
| 0–15 | 16 (4) | 12 (3) | .21 | 9 (5) | .47 |
| 16–34 | 207 (51) | 171 (50) | 88 (48) | ||
| 35–54 | 150 (37) | 134 (39) | 71 (39) | ||
| ≥55 | 31 (8) | 27 (8) | 14 (8) | ||
| Monthly household income, South African rand | |||||
| <500 | 139 (34) | 120 (35) | .36 | 64 (35) | .27 |
| 500–2500 | 186 (46) | 153 (44) | 83 (46) | ||
| >2500 | 79 (20) | 71 (21) | 35 (19) | ||
| Clinical characteristics | |||||
| Current or former smoker | 39 (10) | 35 (10) | .47 | 18 (10) | .98 |
| Diabetes | 23 (6) | 22 (6) | .15 | 10 (5) | .47 |
| HIV infected | 311 (77) | 266 (77) | .70 | 145 (80) | .27 |
| Receiving ART | 236 (76) | 204 (77) | .49 | 108/145 | .32 |
| CD4 count, cells/μL, median (IQR) | 340 (117–431) | 240 (111–425) | .26 | 233 (104–316) | .54 |
| Virologic suppression (<400 HIV RNA copies/mL) | 155 (50) | 134 (39) | .56 | 74 (41) | .49 |
| Cough | |||||
| Patients with cough | 333 (82) | 284 (83) | .87 | 147 (81) | .35 |
| Median duration of cough (wk) | 8 (4–12) | 8 (4–12) | .22 | 8 (4–12) | .39 |
| Sputum smear positive for AFB | 270 (67) | 235 (68) | .31 | 118 (65) | .16 |
| Previous treatment for any TB | 291 (72) | 247 (72) | .81 | 127 (70) | .38 |
| Previous treatment for MDR-TB | 124 (31) | 105 (31) | .86 | 45 (25) | .01 |
Data are presented as No. (%) unless otherwise indicated.
Abbreviations: AFB, acid-fast bacilli; ART, antiretroviral therapy; HIV, human immunodeficiency virus; IQR, interquartile range; MDR, multidrug-resistant; SNP, single-nucleotide polymorphism; TB, tuberculosis; TRAX, Transmission of HIV-Associated XDR-TB study; WGS, whole-genome sequencing.
aP values compare cases with WGS (n = 344) to all TRAX participants (n = 404).
bP values compare linked cases (n = 182) to all cases with WGS (n = 344).
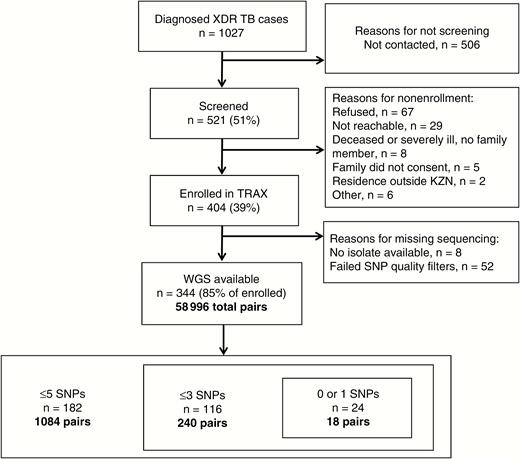
Study flowchart. Abbreviations: KZN, KwaZulu Natal; SNP, single-nucleotide polymorphism; TRAX, Transmission of HIV-Associated XDR-TB study; WGS, whole-genome sequencing; XDR-TB, extensively drug-resistant tuberculosis.
Mycobacterium tuberculosis isolates from 344 (85%) participants passed all sequencing quality filters and were available for analysis, creating a total of 58996 unique case-pairs. Cases with WGS were similar to all enrolled cases (Table 1). Among these case-pairs, 1084 (1.8%) differed by ≤5 SNPs, indicating a genomic link; these case-pairs involved 182 unique participants (Figure 1). Among these 182 cases, the median number of genomic links per case was 6 (IQR, 2–17), with 63 (35%) participants having >10 genomic links (Supplementary Figure 1). These 182 participants reported residences across all 11 districts in KwaZulu-Natal province, and were demographically similar to nonlinked cases (Tables 1 and 2; Figure 2).
Geographic Distribution of Extensively Drug-Resistant Tuberculosis Cases, by District
| District | No. (% of Total) | Population, Thousands | Genomically Linked (% of Total) |
|---|---|---|---|
| Amajuba | 4 (1.2) | 500 (4.9) | 1 (0.5) |
| eThekwini | 115 (33) | 3400 (33) | 53 (29) |
| iLembe | 11 (3.2) | 607 (5.9) | 7 (4) |
| Sisonke | 4 (1.2) | 461 (4.5) | 3 (2) |
| Ugu | 32 (9.3) | 722 (7.0) | 14 (8) |
| Umgungundlovu | 37 (10.8) | 1018 (10) | 26 (14) |
| Umkhanyakude | 19 (5.5) | 626 (6.1) | 9 (5) |
| Umzinyathi | 53 (15.4) | 510 (5.0) | 37 (20) |
| Uthukela | 15 (4.4) | 669 (6.5) | 9 (5) |
| Uthungulu | 30 (8.7) | 908 (8.8) | 16 (9) |
| Zululand | 24 (7.0) | 840 (8.2) | 7 (4) |
| Total | 344 | 10261 | 182 |
Population by district and percentage of cases in each district with at least 1 genomic link. Population statistics sourced from the Statistics South Africa 2011 Census (http://www.statssa.gov.za/).
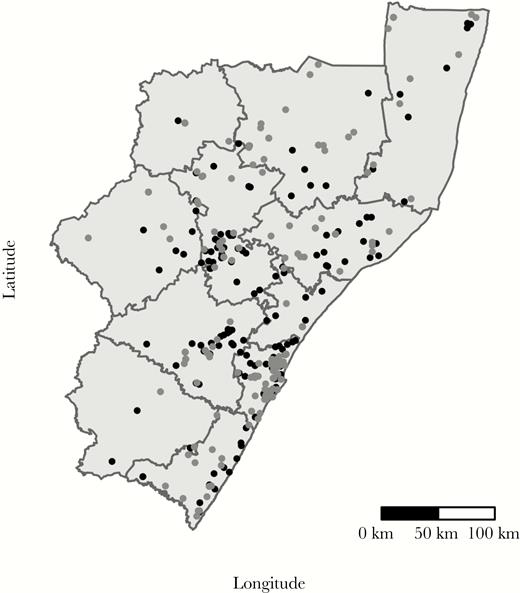
Black dots indicate locations of reported home residences of TRAX cases who are genomically linked; grey dots indicate those not genomically linked. The eleven districts of KwaZulu-Natal are labeled. The most populous district in KwaZulu-Natal is eThekwini, which includes the city of Durban. Note: As of 2015, Sisonke district is known as Harry Gwala district and as of 2016, Uthungulu district is known as King Cetshwayo district.
Geographic Distance Between Genomically Linked Participants
Among the 1084 genomically linked case-pairs, the homes of 3 (0.3%) case-pairs were within 1 km of one another, 12 (1%) were within 5 km of one another, and 29 (3%) were within 10 km of one another. The majority of case-pairs’ homes (871 [80%]) were ≥50 km apart, and the homes of more than half (589 [54%]) of case-pairs were >100 km apart. The median distance between the home residences of genomically linked cases was 108 km (IQR, 64–162 km). This distance was similar when we increased the stringency of the threshold for genomic links: Among pairs with <3 SNPs, the median distance was 117 km (IQR, 67–162 km); among pairs with <1 SNP difference, the median distance was 127 km (IQR, 59–152 km) (Figure 3). The median distance between case-pairs homes’ was >95 km for all strata of sex, HIV status, and strain type (Supplementary Table 1).
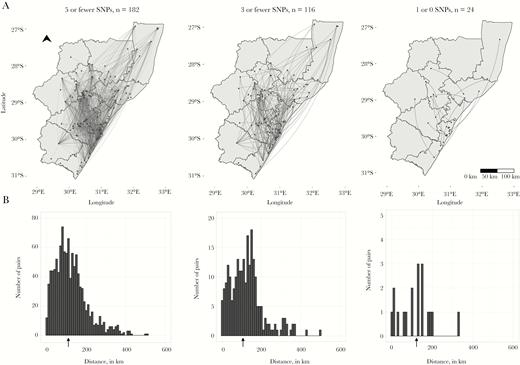
A, Dots indicate home residences of XDR-tuberculosis cases; lines represent genomic links between cases. B, Arrows under histograms indicate the median distance between homes of genomically linked case-pairs at each SNP threshold. Note differences in the y axis range across plots. Abbreviation: SNP, single nucleotide polymorphism.
Because some cases had multiple genomic links, we determined whether cases with distant links also had links close to home. We selected the geographically closest link for each case. Among the 182 cases involved in genomically linked case-pairs, 20 (11%) cases lived within 5 km of their closest link, 40 (22%) lived within 10 km, 68 (37%) lived >50 km from their closest geographic link, and 22 (12%) lived >100 km from their closest link. The median distance to the closest geographic link was 32 km (Supplementary Figure 2).
Within- and Between-District Links
Overall, 16% of genomic links were among case-pairs residing within the same district (172/1084), while 84% (912/1084) of genomically linked case-pairs lived in different districts of KwaZulu-Natal province (Figure 4; Table 3). Three districts had no within-district genomic links (Amajuba, iLembe, and Sisonke), and eThekwini had the highest proportion of within-district links (17%). Proportions of within- and between-district links were similar when the SNP threshold was reduced to <3 SNPs and <1 SNP (Supplementary Table 2).
Proportions of Within- and Between-District Genomic Links (≤5 Single-Nucleotide Polymorphisms) in KwaZulu-Natal
| District | Total Links | Within-District Links, No. (%) | Between-District Links, No. (%) | Links With eThekwini, No. (%) |
|---|---|---|---|---|
| Amajuba | 1 | 0 (0) | 1 (100) | 0 (0) |
| eThekwini | 526 | 91 (17) | 435 (83) | … |
| iLembe | 32 | 0 (0) | 32 (100) | 10 (31) |
| Sisonke | 61 | 0 (0) | 61 (100) | 12 (20) |
| Ugu | 236 | 12 (5) | 224 (95) | 75 (32) |
| Umgungundlovu | 313 | 23 (7) | 290 (93) | 100 (32) |
| Umkhanyakude | 97 | 1 (1) | 96 (99) | 25 (26) |
| Umzinyathi | 334 | 32 (10) | 302 (90) | 104 (31) |
| Uthukela | 160 | 7 (4) | 153 (96) | 45 (28) |
| Uthungulu | 171 | 5 (3) | 166 (97) | 50 (29) |
| Zululand | 65 | 1(2) | 64 (99) | 14 (22) |
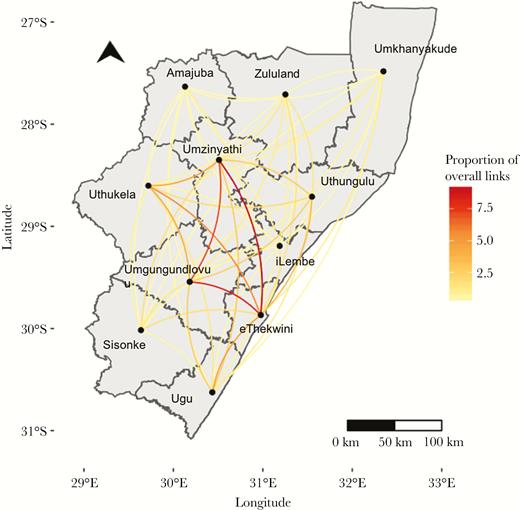
The proportion of genomic links between each district out of the total number of links involving that district is represented by the color of the line. Amajuba district, which had only one genomic link, was excluded from this analysis.
Approximately half (n = 526 [49%]) of all case-pairs were linked to the urban district of eThekwini. In every district except for 2 (Sisonke and Amajuba), the plurality of genomic links included a case that lived in eThekwini (Figure 4; Table 3; Supplementary Table 3). eThekwini district had the highest proportion (20%) of links with Umzinyathi.
At the individual case level, nearly a third of genomically linked cases (53 [29%]) lived in the metropolitan district of eThekwini. Of note, 37 of these 53 (70%) cases were genomically linked to at least 1 other case within eThekwini, and nearly all (n = 51 [96%]) were genomically linked to at least 1 case outside of eThekwini. Among the 129 cases who lived outside of eThekwini, approximately half (n = 59 [46%]) had at least 1 genomic link within their home district. Nearly all (n = 127 [96%]) had at least 1 genomic link outside their home district, and 76 (61%) of those cases had at least 1 genomic link with a case in eThekwini.
Adjustment for Differential Enrollment by District
Enrollment fractions, based on the total number of diagnosed cases in each district, ranged from 0.22 in Sisonke and Amajuba to 0.50 in Umkhanyakude. Adjusting for enrollment, the proportion of within- and between-district links was 15% and 85%, respectively, which is nearly identical to the proportions in the unadjusted analysis. District-specific proportions of within- and between-district links were also similar to the unadjusted proportions (Supplementary Table 4). When we varied the proportion of cases enrolled in eThekwini relative to other districts (assuming enrollment was up to 40% higher in eThekwini than in other districts), eThekwini still accounted for the plurality of links in all but 2 districts.
DISCUSSION
We aimed to define the spatial scale and identify geographic patterns of XDR-TB transmission in KwaZulu-Natal, South Africa. We found that genomically linked pairs of XDR-TB cases generally lived far apart, and that the majority (84%) of genomic links were between cases who lived in different districts. Nearly half of all genomically linked case-pairs involved a case in eThekwini district. Taken together, this evidence suggests that movement across districts, as well as into and out of eThekwini, may play a central role in the dissemination of XDR-TB across the province.
The median geographic distance between genomically liked cases was 108 km, which is remarkably high considering that TB cases with genetically similar strains have been found to be geographically clustered in other settings [38, 39]. We found similarly high geographic distances at more stringent thresholds of 3 and 1 SNPs. Although there is no universal SNP threshold for defining a direct transmission link, there is general agreement that the threshold should be tailored to local TB epidemiology [40, 41]. Furthermore, we also examined median distance by strain type, given that the genomic epidemiology of XDR-TB in KwaZulu-Natal is dominated by a single, highly clonal strain (LAM4) [42]. The median distance between genomically linked cases was similarly high among pairs of cases with the LAM4 strain and among non-LAM4 pairs. Although the LAM4 strain accounted for the majority of genomic links in our study, the phenomenon of the predominance of an individual clone is common in other settings with a high prevalence of drug-resistant TB [43, 44].
The high proportions of between-district links and links with eThekwini suggest that cross-district movement, and perhaps movement into and out of eThekwini, plays a central role in patterns of XDR-TB transmission in KwaZulu-Natal. While previous studies have shown concentrations of TB cases in urban areas, suggesting that these settings are conducive to transmission, they have not examined the role of urban settings in driving transmission patterns and incidence in broader geographic areas [13, 45]. Although our convenience sample of XDR-TB cases diagnosed during the study period (n = 404 [39%]) does not provide a complete set of transmission links, we performed several analyses to assess the robustness of our results to potential selection bias. First, the demographic characteristics of TRAX cases were similar to all diagnosed cases in terms of age, sex, and the district of diagnosing facility. Second, our bias analysis showed that the proportions of between-district links and links with eThekwini remained high under scenarios of differential enrollment by district. Last, given that most cases of TB progress to active disease within 2 years of infection, it is likely that we captured the majority of relevant transmission links among TRAX cases, and that these links reflect larger transmission patterns in KwaZulu-Natal [46].
Collectively, these findings provide insight into possible drivers of XDR-TB transmission in KwaZulu-Natal. Human movement and migration can transport pathogens across long distances, resulting in transmission that occurs far from an individual’s home. Cyclical migration between rural and urban areas for employment is common in South Africa and in other rapidly developing countries, and effectively creates “bridge” populations between urban and rural areas. This type of migration, which has previously been linked to HIV transmission, could also be driving TB transmission [33]. As such, it could explain both the large distances between the homes of genomically linked cases and the fact that cases were more likely to be linked to eThekwini district than to another case in their home district.
In addition to migration for employment, individuals may move between districts for other reasons. A previous analysis of TRAX participants showed that 36% of cases who were diagnosed with XDR-TB in eThekwini lived in a different district, indicating that travel from rural to urban areas for healthcare is common [47]. Importantly, travel to seek TB diagnosis and treatment is likely to coincide with an individual’s infectious period, potentially providing abundant opportunities for transmission. Interdistrict travel, be it for employment, healthcare, or other reasons, expands the geographic range of settings that are relevant for transmission. Indeed, almost a quarter of congregate locations reported by TRAX participants were outside of their home district, further suggesting that many locations that are potential settings of exposure or transmission may be distant from home.
There are several limitations to this study. Underdiagnosis of XDR-TB remains a challenge in resource-limited settings where insensitive diagnostic tools are commonly used and limited laboratory capacity curbs access to comprehensive drug susceptibility testing. As a result, transmission patterns observed among diagnosed cases provide only a limited characterization of province-wide patterns. In this study, however, we employed WGS to identify case-pairs with a high likelihood of transmission based on stringent SNP thresholds. The spatial scale we observed suggests an important role of migration, even if intermediate cases in the transmission chain were not diagnosed or enrolled in TRAX. Second, we captured participants’ homes as only 1 location. In a setting like KwaZulu-Natal where migration is common, individuals may have multiple “current” or recent residences, all of which may be possible locations of TB exposure and transmission. Thus, the 22% of cases that reported living in a different residence in the past 5 years may represent a lower bound on the proportion of cases that occupy multiple residences throughout the year. Future studies should aim to understand the role of cyclical migratory patterns and multiple residences in defining the settings relevant for TB exposure and transmission. Last, “mixed” infections, or genetically distinct populations within the same host, present potential challenges for inferring transmission based on a single Mtb isolate [48]. Yet, we do not expect mixed infections to be differential with respect the location of participants’ homes, suggesting that our results are robust to the potential effects of within-host bacterial heterogeneity.
Evidence that the drug-resistant TB epidemic is increasingly attributable to transmission of drug-resistant strains has highlighted the importance of understanding transmission patterns to prevent incident cases [5, 6, 49, 50]. Despite the challenges of measuring transmission, the use of next-generation bacterial sequencing technologies brings us a step closer to understanding the settings and modes of contact sustaining TB transmission in high-burden settings. By defining the spatial scale of transmission, we provide preliminary data about transmission patterns and lay the foundation for further studies that more explicitly examine associations between casual contact in urban settings, migratory behavior, and the ongoing spread of XDR-TB. Ultimately, this knowledge can inform the development of tailored prevention strategies that target geographic areas and demographic groups that contribute disproportionately to transmission.
Supplementary Data
Supplementary materials are available at The Journal of Infectious Diseases online. Consisting of data provided by the authors to benefit the reader, the posted materials are not copyedited and are the sole responsibility of the authors, so questions or comments should be addressed to the corresponding author.
Notes
Acknowledgments. We are grateful to the study team at the University of KwaZulu-Natal for their tireless efforts in data collection, record abstraction, participant recruitment, and interviews. We also thank the participants and their families who consented to participate in this study.
Disclaimer. The findings and conclusions in this manuscript are those of the authors and do not necessarily represent the official position of the funding agencies. The funders had no role in study design, data collection and analysis, decision to publish, or preparation of the manuscript.
Financial support. This study was primarily funded by the US National Institute of Allergy and Infectious Diseases (NIAID) of the National Institutes of Health (NIH) (grant numbers R01AI089349, R01AI087465, and K24AI114444 to N. R. G.; K23AI083088 to J. C. M. B., and K23AI134182 to S. C. A.); the Emory Center for AIDS Research (CFAR) (grant number P30AI050409); the Einstein CFAR (grant number P30AI051519); and the Einstein/Montefiore Institute for Clinical and Translational Research (grant number UL1 TR001073).
Potential conflicts of interest. All authors: No reported conflicts of interest. All authors have submitted the ICMJE Form for Disclosure of Potential Conflicts of Interest. Conflicts that the editors consider relevant to the content of the manuscript have been disclosed.
Presented in part: Conference on Retroviruses and Opportunistic Infections, Seattle, Washington, February. Abstract 660.
References
et al.

