


Abstract
Detection of human papillomavirus (HPV) DNA in genital samples may not always represent true infections but may be depositions from infected sexual partners. We examined whether sexual risk factors and a biomarker (Y chromosome DNA) were associated with genital HPV partner concordance and estimated the fraction of HPV detections potentially attributable to partner deposition.
The HITCH study enrolled young women attending a university or college in Montréal, Canada, and their male partners, from 2005 to 2010. We tested baseline genital samples for Y chromosome DNA and HPV DNA using polymerase chain reaction.
Type-specific HPV concordance was 42.4% in partnerships where at least one partner was HPV DNA positive. Y chromosome DNA predicted type-specific HPV concordance in univariate analyses, but in multivariable models the independent predictors of concordance were days since last vaginal sex (26.5% higher concordance 0–1 vs 8–14 days after last vaginal sex) and condom use (22.6% higher concordance in never vs always users). We estimated that 14.1% (95% confidence interval [CI], 6.3–21.9%) of HPV DNA detections in genital samples were attributable to vaginal sex in the past week.
A substantial proportion of HPV DNA detections may be depositions due to recent unprotected vaginal sex.
The detection of human papillomavirus (HPV) DNA in male and female genital samples is generally interpreted as an HPV infection at these sites. However, indirect evidence supports the hypothesis that some detections of HPV DNA may not represent true productive infections in the tested individuals, but depositions of HPV DNA from an infected sex partner. DNA of genital HPV types is frequently detected on hands [1] and on environmental surfaces [2] despite their tropism for mucosal epithelium. Also, HPV requires several hours to days to attach to and enter basal epithelial cells [3–5], and infected epithelial cells take several weeks to reach the top layers of the epithelium for desquamation, during which the expression and replication of the viral genome is tightly regulated to avoid host detection [3]. The viral generation time is estimated to take at least 3 weeks [6]. It is therefore unlikely that HPV DNA newly detected within days of a sexual contact represents a productive infection. Genital HPV DNA concordance between sex partners is highest the day following vaginal sex and declines with the number of days since sexual intercourse, and this excess concordance has been hypothesized to be due to partner deposition [1, 7–9]. Potential sources of HPV DNA include deposited HPV virions, free viral DNA, infected exfoliated epithelial cells from the partner, or infected sperm cells [10].
Little is known about what fraction of HPV DNA detections is likely to represent depositions rather than productive infections. However, this issue is of increasing importance as more and more jurisdictions adopt HPV DNA testing for cervical cancer screening. The majority of incident genital HPV DNA detections are not detected upon retesting 6–12 months later [11, 12]. Depositions may partly explain these “transient infections”, which are associated with a lower risk of oncogenic progression than “persistent infections” of HPV DNA detected on consecutive visits [13], but it is currently impossible to determine which HPV DNA detections reflect true productive infections.
Biomarkers of partner cell deposition could help elucidate the fraction of HPV DNA detections that are depositions. Y chromosome DNA is present in male epithelial cells and Y-chromosome–carrying sperm cells, and is a biomarker of recent sexual activity in women. It can be detected in 87%–100% of vaginal samples the day after unprotected vaginal sex and up to 15 days thereafter [14–16]. We hypothesized that Y chromosome DNA might be a direct biomarker of HPV-infected male cells deposited in the vaginal tract (eg, if HPV DNA deposition occurs through infected sperm/epithelial cells), and would therefore be associated with a higher probability of partner HPV type-specific concordance due to deposition. Alternatively, Y chromosome DNA detection may also be a correlate of the sexual behaviors that cause viral shedding and deposition. Our objectives were to measure whether recent sexual behaviors and Y chromosome DNA in vaginal samples were independently associated with type-specific HPV DNA genital concordance between sex partners, and estimate the proportion of all HPV DNA detections that may be attributed to deposition.
METHODS
Study Design
The HITCH (HPV Infection and Transmission Among Couples Through Heterosexual Activity) cohort study enrolled women, 18–24 years old, attending a university or college in Montréal, Canada, and their male partners ≥18 years old, from 2005 to 2010 [7, 17, 18]. Eligible couples were in a sexual relationship of no more than 6 months. The study was approved by the ethical Institutional Review Boards from both universities (McGill, Concordia). Subjects provided written informed consent to study participation, and for the storage and use of their specimen in future studies shedding light into mechanisms of transmission of HPV infection.
At the baseline visit, both men and women independently completed self-administered online questionnaires on sexual behaviors with their HITCH partner, as well as those with previous and any concurrent partners since the start of the partnership. Condom use was measured as the proportion of protected sex acts since the start of the partnership. Women were asked to self-report if they had received the HPV vaccine. Women self-collected a vaginal specimen with a Dacron™ swab after receiving instructions by the research nurse. Men provided a specimen of epithelial cells from the penis and scrotum using gentle exfoliation with ultrafine emery paper (3M 600A-grit Wetordry™ Tri-M-ite) followed by swabbing with a cotton Dacron™ swab.
HPV and Y Chromosome DNA Detection
Polymerase chain reaction (PCR) assays for HPV DNA detection and genotyping, and Y chromosome DNA detection and quantification, have been previously described [7]. Briefly, we performed a linear array HPV genotyping assay (LA-HPV) (Roche Molecular Systems, Laval, Canada) to detect 36 HPV genotypes (HPV-6/11/16/18/26/31/33/34/35/39/40/42/44/45/ 51/52/53/54/56/58/59/61/62/66/67/68/69/70/71/72/73/81/82/83/84/89), with additional testing for HPV-52 due to cross-reactive probes [19]. We coamplified a segment of the β-globin gene to act as a cellular control and identify the presence of inhibitors. We used a validated PCR protocol [20] to detect and amplify the SRY gene DNA sequences specific to Y chromosomes. We estimated the quantity of SRY with the use of a standard curve produced by serial dilutions of DNA from quantified cells of prostatic origin available in our laboratory. We also estimated the number of cells contained in the sample with a real-time PCR targeting the β-globin gene as described elsewhere [21]. Samples were evaluated in duplicate with the Light Cycler PCR and detection system (Roche Molecular Systems, Laval, Québec). Sample processing and testing was done by female research assistants only to prevent contamination. All negative controls were negative in PCR assays. The proportion of male cells in vaginal samples was determined by dividing the quantity of SRY copies by the total number of cells inferred via the real time PCR β-globin assay.
Statistical Analysis
We analyzed the data from participants’ baseline clinic visit and questionnaires. We restricted analyses to partnerships with valid β-globin DNA test results, and partnerships where at least one partner is HPV DNA positive. Our outcome was type-specific HPV DNA concordance between partners, defined as the detection of the same HPV type in both partners’ genital samples, conditional on at least one of the partners being positive for that type. We considered Y chromosome DNA in women as both a binary (positive/negative) exposure and as a quantitative (proportion of male cells among all exfoliated vaginal cells) exposure. We included in multivariable models the sexual behaviors significantly associated with HPV DNA concordance in univariate analyses. We considered the number of days since a woman’s last vaginal sex to be the latest between either (1) the last date she reported having vaginal sex with her HITCH partner or any other sex partner(s), or (2) the last date her male HITCH partner reported having vaginal sex with her. If participants only recalled the month but not the day of their last vaginal sex, we imputed the date as occurring halfway through that month. We averaged the responses of both partners for other partnership-level variables, and averaged the frequency of giving and receiving oral and digital sex into pooled summary measures. We included log and square root transformations of continuous variables (number of lifetime sexual partners, cumulative number of sex acts, Y chromosome DNA quantity) in the models to account for nonlinear relationships with concordance.
We used multiple linear regression to model concordance. The model assumes there is a baseline level of concordance between partners that is expected due to chance and due to cumulative transmission since the start of the partnership. Increases in concordance associated with predictors (Y chromosome DNA, recent sexual behaviors) are the cases of concordance that are assumed potentially attributable to deposition. This analysis considers deposition is only possible in cases where both partners are HPV DNA positive for the same type. We considered each HPV type as an individual observation, so partnerships with multiple types of HPV contributed multiple observations to the analyses. We accounted for within-subject correlation between HPV types using generalized estimation equations (GEE), with a working exchangeable correlation or exchangeable log-odds ratio structure.
We examined the interaction between days since last vaginal sex and condom use by including interaction terms between these variables in linear models. Partners were classified as “inconsistent” users if they reported condom use between 1% and 99% of the time. Interaction analyses were adjusted for all variables previously included in multivariable analyses.
We used a modified calculation method for the population attributable fraction to estimate the proportion of HPV DNA detections that were depositions (see Supplementary Material for technical details). Briefly, in cases where an HPV type was detected in only one partner we assumed the detection reflected a true infection. In cases where an HPV type was detected in both partners, we used model-adjusted type-specific HPV DNA concordance prevalence differences as measures of effect to estimate the number of excess cases of concordance attributable to vaginal sex in the last 0–7 days and due to Y chromosome DNA positivity. For “excess” concordant partners predicted by the GEE model, the calculation assumed one partner had a true HPV infection and one partner had HPV DNA deposition. This analysis makes no assumption regarding which gender has the deposition and which has the true infection. The estimate should be interpreted as the fraction of all HPV DNA type-specific detections in men and women combined that could be depositions attributable to each exposure.
RESULTS
Population Characteristics
At the baseline visit, 494 of the 502 enrolled women had valid β-globin DNA test results (Table 1). The median time since partners reported starting having vaginal sex was 3.9 months (interquartile range 2.6–5.1) and the median reported number of vaginal sex acts since the start of the partnership was 62 (interquartile range 33–102). The majority (62.3%) of women reported vaginal sex in the past 2 days. Only 2.8% of women and 3.2% of men reported vaginal sex with another partner in the past week. There were 15.1% of women who reported having received the HPV vaccine.
Partnership Characteristics, Type-specific HPV DNA Detections, and Type-Specific Probability of HPV DNA Concordance Conditional on at Least one Positive Partner
| Type-specific HPV DNA detections (n)a | Type-specific concordance (%)b | |||||||
|---|---|---|---|---|---|---|---|---|
| Variable | Partnerships (n) | Either | Women | Men | Both | Either | Women | Men |
| Overall | 494 | 1099 | 768 | 797 | 466 | 42.4 | 60.7 | 58.5 |
| Vaginal sample Y chromosome DNA | ||||||||
| Negative | 267 | 539 | 377 | 355 | 193 | 35.8 | 51.2 | 54.4 |
| Positive | 227 | 560 | 391 | 442 | 273 | 48.8 | 69.8 | 61.8 |
| Days since woman’s last reported vaginal sexc | ||||||||
| 0–1 | 111 | 288 | 218 | 213 | 143 | 49.7 | 65.6 | 67.1 |
| 2 | 194 | 431 | 299 | 325 | 193 | 44.8 | 64.5 | 59.4 |
| 3 | 67 | 148 | 99 | 105 | 56 | 37.8 | 56.6 | 53.3 |
| 4 | 24 | 70 | 45 | 42 | 17 | 24.3 | 37.8 | 40.5 |
| 5–7 | 49 | 79 | 51 | 53 | 25 | 31.6 | 49.0 | 47.2 |
| 8–14 | 22 | 48 | 26 | 34 | 12 | 25.0 | 46.2 | 35.3 |
| ≥15 | 23 | 31 | 26 | 21 | 16 | 51.6 | 61.5 | 76.2 |
| Condom used | ||||||||
| Never (0%) | 47 | 106 | 69 | 91 | 54 | 50.9 | 78.3 | 59.3 |
| Rarely (1%–25%) | 134 | 346 | 242 | 278 | 174 | 50.3 | 71.9 | 62.6 |
| Sometimes (26%–75%) | 132 | 321 | 226 | 230 | 135 | 42.1 | 59.7 | 58.7 |
| Most times (76%–99%) | 87 | 150 | 107 | 102 | 59 | 39.3 | 55.1 | 57.8 |
| Always (100%) | 89 | 175 | 123 | 95 | 43 | 24.6 | 35.0 | 45.3 |
| Average frequency of vaginal sex acts (/week)d | ||||||||
| ≤2 | 85 | 163 | 99 | 121 | 57 | 35.0 | 57.6 | 47.1 |
| >2–4 | 185 | 381 | 267 | 249 | 135 | 35.4 | 50.6 | 54.2 |
| >4 | 219 | 554 | 401 | 426 | 273 | 49.3 | 68.1 | 64.1 |
| Pooled frequency of oral sex both partners performed on each othere | ||||||||
| Never/rarely (0%–25%) | 84 | 131 | 95 | 81 | 45 | 34.4 | 47.4 | 55.6 |
| Sometimes (26%–75%) | 240 | 501 | 350 | 374 | 223 | 44.5 | 63.7 | 59.6 |
| Most times (76%–99%) | 157 | 441 | 305 | 324 | 188 | 42.6 | 61.6 | 58.0 |
| Always (100%) | 13 | 26 | 18 | 18 | 10 | 38.5 | 55.6 | 55.6 |
| Pooled frequency of digital sex both partners performed on each othere | ||||||||
| Never/rarely (0%–25%) | 28 | 61 | 34 | 47 | 20 | 32.8 | 58.8 | 42.6 |
| Sometimes (26%–75%) | 180 | 379 | 261 | 276 | 158 | 41.7 | 60.5 | 57.3 |
| Most times (76%–99%) | 238 | 567 | 409 | 400 | 242 | 42.7 | 59.2 | 60.5 |
| Always (100%) | 48 | 92 | 64 | 74 | 46 | 50.0 | 71.9 | 62.2 |
| Concurrent partners (woman) | ||||||||
| No | 426 | 875 | 608 | 634 | 367 | 41.9 | 60.4 | 57.9 |
| Yes | 68 | 224 | 160 | 163 | 99 | 44.2 | 61.9 | 60.7 |
| Concurrent partners (man) | ||||||||
| No | 437 | 922 | 648 | 671 | 397 | 43.1 | 61.3 | 59.2 |
| Yes | 56 | 172 | 117 | 123 | 68 | 39.5 | 58.1 | 55.3 |
| HPV vaccine receipt (woman) | ||||||||
| Yes | 60 | 123 | 81 | 96 | 54 | 43.9 | 66.7 | 56.3 |
| No/don’t know | 338 | 764 | 533 | 569 | 338 | 44.2 | 63.4 | 59.4 |
Abbreviations: HPV, human papillomavirus.
aEach HPV type is considered an individual observation. Either, an HPV type is detected in the man OR the woman’s genital samples. Both, an HPV type is detected in the man AND the woman’s genital samples.
bProbability that both partners are HPV DNA positive for the same type if at least one partner is positive (Either), if the woman is positive (Women), and if the man is positive (Men).
cLatest date between any of the following: last date of vaginal sex woman reported with male HITCH partner, last date of vaginal sex her male HITCH partner reported with her, last date she reported vaginal sex with concurrent partners.
dAverage of both partners’ reports.
eAverage of woman’s reported frequency of giving oral/digital sex, woman’s reported frequency of receiving oral/digital sex, man’s reported frequency of giving oral/digital sex, and man’s reported frequency of receiving oral/digital sex.
Overall Type-Specific HPV DNA Concordance
There were 56.6% of women and 57.1% of men who were positive for at least one HPV type (Table 1). There were in total 1565 type-specific HPV DNA detections (768 in women, 797 in men), 1099 instances of type-specific HPV DNA detections in either partner, and 466 instances of type-specific HPV DNA detection in both partners. If HPV DNA was detected in either partner, there was a 42.4% probability both partners were positive for the same HPV type. Overall concordance was similar between genders: if the woman was positive for a given HPV type, there was a 60.7% probability that her partner was positive for the same type, and if the man was positive for a given type there was a 58.5% probability his partner was positive for the same type. Concordance did not substantially vary by HPV species group (Supplementary Table 1).
Associations With Y Chromosome DNA
Conditional on either partner being HPV DNA positive, there was a 12.5% (95% confidence interval [CI], 5.0–19.9) higher prevalence of type-specific concordance in partnerships where the woman was Y chromosome DNA positive than in partnerships where the woman was Y chromosome DNA negative (Table 2). The association between concordance and Y chromosome DNA positivity was stronger when we conditioned on women being HPV DNA positive than when we conditioned on men being positive. However, Y chromosome DNA positivity was no longer associated with concordance in either sex once we adjusted for partners’ reported sexual behaviors. We found similar results when we modeled Y chromosome DNA in women’s samples as a quantitative exposure (Figure 1). The square root-transformed proportion of male cells among women’s exfoliated vaginal cells was a significant crude predictor of concordance between partners (P = .0005), but was no longer associated once we adjusted for reported sexual behaviors (P = .42).
Prevalence Differences in the Type-specific HPV Concordance Between Partners Predicted by Linear Generalized Estimation Equations (GEE) Regression, Conditional on Either Partner, the Woman, or the Man Being HPV DNA Positive
| Conditional on either partner HPV DNA positive | Conditional on woman HPV DNA positive | Conditional on man HPV DNA positive | ||||
|---|---|---|---|---|---|---|
| Variable | Crude PD (%) (95% CI) | Adjusteda PD (%) (95% CI) | Crude PD (%) (95% CI) | Adjusteda PD (%) (95% CI) | Crude PD (%) (95% CI) | Adjusteda PD (%) (95% CI) |
| Y chromosome DNA | ||||||
| No | (ref) | (ref) | (ref) | (ref) | (ref) | (ref) |
| Yes | 12.6 (5.0, 20.0) | 0.1 (−7.9, 8.1) | 16.9 (7.9, 25.9) | 4.2 (−4.5, 12.9) | 7.8 (−0.6, 16.2) | −4.1 (−13.5, 5.3) |
| Days since woman’s last reported vaginal sexb | ||||||
| 0–1 | (ref) | (ref) | (ref) | (ref) | (ref) | (ref) |
| 2 | −6.2 (−15.9, 3.4) | −7.1 (−16.6, 2.3) | −2.4 (−13.4, 8.6) | 0.2 (−10.6, 10.2) | −8.9 (−19.2, −1.4) | −10.2 (−20.3, −0.1) |
| 3 | −10.5 (−23.2, 2.3) | −7.9 (−19.9, 4.2) | −9.5 (−24.8, 5.8) | −4.5 (−19.6, 10.5) | −11.6 (−25.8, 2.5) | −10.0 (−24.1, 4.1) |
| 4 | −24.0 (−41.2, −6.8) | −28.6 (−41.2, −16.1) | −18.9 (−46.9, 9.1) | −24.7 (−43.8, −5.7) | −30.9 (−48.9, −13.0) | −36.1 (−53.6, −18.7) |
| 5–7 | −20.4 (−34.1, −6.8) | −17.0 (−29.9, −4.0) | −21.4 (−39.2, −3.6) | −14.8 (−30.1, 0.5) | −21.4 (−38.2, −4.6) | −19.3 (−37.2, −1.4) |
| 8–14 | −25.5 (−36.8, −14.2) | −26.5 (−40.0, −12.9) | −21.4 (−37.7, −5.2) | −25.0 (−42.3, −7.8) | −30.8 (−45.9, −15.7) | −27.8 (−45.6, −10.1) |
| ≥15 | −3.5 (−26.2, 19.1) | 6.5 (−16.2, 29.2) | −13.8 (−38.3, 10.7) | −1.1 (−25.6, 23.4) | 7.2 (−16.8, 31.3) | 11.7 (−17.5, 40.9) |
| Condom use with HITCH partnerc | ||||||
| Never (0%) | 26.6 (12.4, 40.9) | 22.6 (9.7, 35.6) | 39.3 (23.0, 55.6) | 33.0 (19.1, 46.9) | 13.7 (−3.3, 30.7) | 11.9 (−4.8, 28.6) |
| Rarely (1%–25%) | 24.7 (14.2, 35.2) | 22.5 (12.7, 32.3) | 32.7 (18.8, 46.7) | 23.9 (10.8, 36.9) | 15.7 (2.1, 29.4) | 15.6 (2.3, 28.9) |
| Sometimes (26%–75%) | 16.3 (5.4, 27.3) | 15.3 (5.7, 24.9) | 20.6 (6.2, 35.0) | 13.8 (0.5, 27.2) | 11.7 (−3.0, 26.3) | 13.7 (−0.4, 27.7) |
| Most times (76%–99%) | 13.0 (0.1, 25.8) | 12.8 (2.8, 22.8) | 17.0 (−0.2, 34.2) | 14.5 (−0.6, 29.5) | 10.5 (−5.8, 26.8) | 12.8 (−2.4, 28.1) |
| Always (100%) | (ref) | (ref) | (ref) | (ref) | (ref) | (ref) |
| Average frequency of vaginal sex acts (/week)c | ||||||
| ≤2 | (ref) | (ref) | (ref) | (ref) | (ref) | (ref) |
| >2–4 | −0.1 (−11.4, 10.2) | −6.8 (−16.9, 3.2) | −7.4 (−22.0, 7.2) | −17.9 (−31.7, −4.1) | 4.3 (−8.5, 17.2) | −0.0 (−14.3, 14.2) |
| >4 | 13.1 (2.8, 23.4) | −1.8 (−13.0, 9.4) | 7.1 (−6.3, 20.4) | −13.0 (−27.6, 1.5) | 15.8 (3.7, 27.9) | 2.4 (−12.3, 17.0) |
| Pooled frequency of oral sex both partners performed on each otherd | ||||||
| Never/rarely (0%–25%) | (ref) | (ref) | (ref) | |||
| Sometimes (26%–75%) | 6.2 (−5.2, 17.5) | 9.0 (−4.7, 22.7) | 2.9 (−10.9, 16.7) | |||
| Most times (76%–99%) | 5.7 (−5.8, 17.1) | 7.4 (−6.5, 21.3) | 2.5 (−11.6, 16.5) | |||
| Always (100%) | 8.1 (−17.0, 33.1) | 9.1 (−19.6, 37.8) | 3.5 (−25.7, 32.7) | |||
| Pooled frequency of digital sex both partners performed on each otherd | ||||||
| Never/rarely (0%–25%) | (ref) | (ref) | (ref) | (ref) | (ref) | (ref) |
| Sometimes (26%–75%) | 9.3 (−4.7, 23.3) | 5.9 (−7.4, 19.1) | 4.9 (−12.0, 21.7) | 0.1 (−16.0, 16.3) | 12.8 (−5.2, 30.8) | 6.2 (−10.0, 22.3) |
| Most times (76%–99%) | 8.8 (−4.8, 22.4) | 5.6 (−7.5, 18.7) | 0.6 (−15.8, 17.0) | −0.0 (−15.8, 15.8) | 15.4 (−2.3, 33.0) | 8.9 (−7.4, 25.1) |
| Always (100%) | 21.5 (3.6, 39.4) | 20.4 (2.9, 37.8) | 14.7 (−4.7, 34.2) | 11.6 (−6.0, 29.1) | 20.7 (−0.1, 42.0) | 19.1 (0.7, 37.6) |
| Concurrent partners (woman) | ||||||
| No | (ref) | (ref) | (ref) | |||
| Yes | 0.1 (−9.8, 10.0) | −2.1 (−14.0, 9.8) | 1.6 (−9.2, 12.4) | |||
| Concurrent partners (man) | ||||||
| No | (ref) | (ref) | (ref) | |||
| Yes | −4.4 (−15.2, 6.4) | −3.4 (−16.8, 10.1) | −5.8 (−18.2, 6.5) | |||
| Woman’s lifetime number of sex partners (per additional log)e | 2.3 (−9.1, 13.7) | f | 7.1 (−5.2, 19.5) | |||
| Man’s lifetime number of sex partner (per additional log)e | 6.2 (−2.1, 14.6) | 6.4 (−0.2, 13.0) | 14.0 (4.7, 23.2) | 13.1 (5.7, 20.6) | f | |
| Cumulative number of vaginal sex acts with HITCH partner (per additional log)c,e | 10.3 (6.8, 13.8) | 7.3 (−0.5, 15.0) | 17.0 (14.8, 19.2) | 13.9 (4.3, 23.6) | 5.3 (−3.5, 14.1) | 2.5 (−7.0, 12.1) |
Abbreviations: HPV, human papillomavirus; PD, prevalence difference; CI, confidence interval; ref, reference category.
aAdjusted in linear GEE regression models for Y chromosome DNA positivity in woman’s vaginal sample, days since woman’s last reported vaginal sex, condom use, frequency of vaginal sex, frequency of digital sex, man’s number of lifetime partners (except for model conditioned on man being HPV positive), and cumulative number of vaginal sex acts.
bLatest date between any of the following: last date of vaginal sex woman reported with male HITCH partner, last date of vaginal sex her male HITCH partner reported with her, last date she reported vaginal sex with concurrent partners.
cAverage of both partners’ reports.
dAverage of woman’s reported frequency of giving, woman’s reported frequency of receiving, man’s reported frequency of giving, and man’s reported frequency of receiving oral or digital sex.
eModels included both the linear and log-transformed lifetime number of sexual partners and cumulative number of sex acts as predictors.
fNot considered for model inclusion as analyses are already conditioned on that gender being HPV DNA positive.
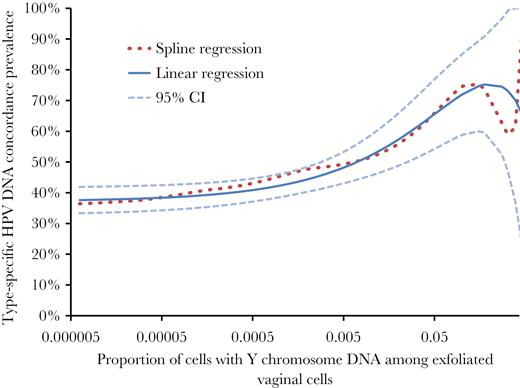
Type-specific human papillomavirus (HPV) DNA partner concordance prevalence (conditional on either partner being infected with a type) by the proportion of male cells (with Y chromosome DNA) among women’s exfoliated vaginal cells, as predicted by spline regression and linear generalized estimation equation (GEE) regression models. The more flexible spline regression is shown for comparison to provide qualitative verification that the linear regression appropriately models the data. The linear GEE regression model includes a square root transformation of the proportion of male cells to account for the nonlinear relationship. Dashed lines are the 95% confidence intervals predicted by linear regression. The x axis is on a logarithmic scale. Abbreviation: CI, confidence interval.
Associations With Sexual Behaviors
The days since the woman’s last reported vaginal sex, condom use, frequency of digital sex, the man’s lifetime number of sex partners, and cumulative number of vaginal sex acts since the start of the partnership were significantly associated with type-specific HPV DNA concordance between partners in multivariable models (Table 2). If at least one partner was HPV DNA positive, the adjusted probability of type-specific HPV concordance was 26.5% (95%CI, 12.9–40.0) higher in partnerships in which women reported vaginal sex 0–1 days ago than in those in which women reported they last had vaginal sex 8–14 days ago, and 22.6% (95%CI, 9.7–35.6) higher between partners who reported never using condoms than between partners who reported always using condoms. The association between concordance and reported condom use differed by sex: when we conditioned on women being HPV DNA positive, there was a larger association with the probability their male partner was concordant than when we conditioned on men being HPV DNA positive. Frequency of reported oral sex, concurrent partners, and women’s number of lifetime sexual partners were not associated with concordance. We performed sensitivity analyses where we excluded HPV-6/11/16/18 observations from couples where the woman reported being vaccinated, but this did not impact model estimates (results not shown).
The adjusted association between days since last reported vaginal sex and type-specific HPV DNA concordance conditional on either partner being infected was modified by reported condom use (Figure 2). For partners who reported never using condoms, the adjusted type-specific HPV concordance was 42.1% higher (95%CI, 22.4–61.7) 0–1 days after last reported vaginal sex than ≥4 days after. For partners who reported always using condoms, the adjusted type-specific HPV concordance was 10.0% higher (95%CI, −13.5 to 33.5) 0–1 days after last reported vaginal than ≥4 days after. For partners who reported last having vaginal sex 0–1 days ago, the adjusted type-specific HPV concordance was 32.1% higher (95%CI, 1.8–62.3) between partners who reported never using condoms than partners who reported always using condoms. For partners who reported they last had sex ≥4 days ago, the adjusted type-specific HPV concordance was 4.7% higher (95%CI, −14.3 to 23.6) between partners who reported never using condoms than between partners who reported always using condoms.
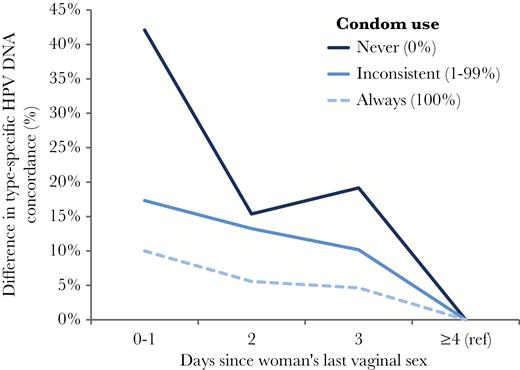
Additional type-specific human papillomavirus (HPV) DNA partner concordance (conditional on either partner being HPV DNA positive) predicted by linear generalized estimation equation (GEE) regression by days since last vaginal sex and by self-reported condom use. Women who reported last having vaginal sex ≥4 days ago are the reference category (ref). Differences are adjusted for frequency of vaginal sex acts ( per week), frequency of digital sex, man’s number of lifetime sexual partners, and cumulative number of vaginal sex acts since the start of the partnership.
Fraction of Detections Attributable to Deposition
Using adjusted concordance prevalence difference model estimates, we estimate that 14.1% (95%CI, 6.3–21.9%) of all type-specific HPV DNA detections in men and women were depositions attributable to vaginal sex reported in the last week (≤7 days). No HPV DNA detections were estimated to be strictly attributable to Y chromosome DNA positivity (0.2%, 95%CI, −2.8 to 3.1%).
DISCUSSION
We hypothesized that Y chromosome DNA might plausibly be associated with HPV DNA detection through two mechanisms: (1) Y chromosome DNA could be a direct biomarker of HPV-infected male cells deposited in the vaginal tract, or (2) Y chromosome DNA detection could be merely a correlate of sexual behaviors that lead to viral shedding and deposition (which may or may not lead to infection). Our results support the second hypothesis, as Y chromosome DNA in vaginal samples was no longer associated with type-specific HPV DNA concordance once we adjusted for reported sexual behaviors. To our knowledge, only one other study, by Silva et al., has studied and found a strong crude association between Y chromosome DNA and HPV DNA (odds ration [OR], 2.9) [22]. Y chromosome DNA positivity in the general population is likely to identify women in a current sexual relationship, and at increased risk for HPV deposition and transmission. We likely found a weaker association because our study recruited women conditional on being in a recent sexual partnership. While it is possible HPV DNA could decay at a different rate than Y chromosome DNA, this is biologically unlikely as nucleases are not known to target specific DNA signatures. Should it exist, differential decay would be expected to lead to an underestimation of the crude association between Y chromosome DNA and HPV DNA. However, if Y chromosome DNA were a mediating factor, it would still be expected to retain an association with HPV concordance in adjusted analyses, which was not the case in our analysis. Our results suggest the detection of male cells in vaginal samples has no causal effect on HPV DNA detection beyond being a correlate of recent sexual activity.
Our estimated cross-sectional type-specific HPV concordances between partners are similar to those measured by Widdice et al. in a comparable population of young couples (67%–70%) [1]. Our results build on previous observations of an association between time since last sex and partner concordance [7–9] by showing that this strong association is independent of other sexual behaviors increasing cumulative HPV transmission between partners (for example cumulative number of sex acts). This supports the hypothesis that excess concordance associated with vaginal sex in the last few days is likely to reflect deposition rather than infection. The timescales we measured are more consistent with deposition (days) than true infection (weeks). Our study also suggests that condom use may prevent some HPV DNA deposition: the largest decline in concordance over the days since last vaginal sex was seen in partners who never use condoms, and the lowest decline was in partners who always used condoms. Previously, Nyitray et al. reported no association between condom use and concordance [9], but this may be because they grouped together partners who always and sometimes used condoms, which would dilute any protective association.
We estimated that 14.1% of cross-sectional HPV DNA detections in our sample could be depositions. This population-attributable fraction assumes that the confounder-adjusted excess concordance associated with vaginal sex in the last week reflected deposition. The proportion of HPV detections that are depositions will be population-specific depending on the distribution of days since last vaginal sex and of condom use, and would likely be smaller in populations where less individuals have had vaginal sex in the last few days (eg, older individuals [23], or the general population which includes singles). Nevertheless, even a small proportion of depositions misclassified as true “infections” could cause important biases in studies [24]. For example, clinical trials observed a lower HPV vaccine efficacy against all incident HPV-16/18 DNA detections (73.6%) than against 6-month persistent detections (94.3%) in young women in according-to-protocol analyses [25, 26], as would be expected if some of the incident detections were only depositions rather than true replicating infections.
The main limitation of our analysis is that it is cross-sectional, so it is not possible to determine whether deposition might be more likely in women or men as we do not know which partner was infected first. There was also likely some misclassification of the number of days since last vaginal sex, especially in categories of increasing days since last vaginal sex due to declining recall over time. Partnerships categorized as ≤4 days since last vaginal sex had a median absolute difference between men and women’s reports of 0 days (interquartile range [IQR] 0–1), indicating good agreement and recall. However, those partnerships categorized as ≥15 days since last vaginal sex had a median difference of 8 days (IQR 5–16) between men and women’s reports and a higher proportion of missing response from either partner indicating poorer recall and a higher likelihood of misclassification. There are likely some observations classified as ≥15 days since last vaginal sex that have a more recent date of vaginal sex that was poorly recalled and reported. Upon examination, partners in this category did not have other identifiable behaviors that could plausibly explain their increased concordance (they reported on average higher condoms use and a lower weekly frequency of vaginal sex than other categories). We therefore hypothesize the unexpected increase in partner concordance in the partners who reported ≥15 days since last vaginal sex is likely due in part to some misclassification of the time since last vaginal sex and in part to the low number of observations in this category. It is also possible there might be some unmeasured confounders we have not accounted for.
Deposition has important implications for cervical cancer screening with HPV DNA testing [16]. Deposition is likely to contribute to lowering the specificity of HPV DNA testing, as only infected cells can progress to cervical neoplasia and cancer [27]. Even small declines in screening specificity have important implications at the population level, increasing the number of false positives and leading to many unnecessary interventions in women causing physical and psychological harms [28–30]. Our results suggest that research is required to understand whether time since last vaginal sex and recent condom use affect the positive predictive value of a positive HPV test in a screening context. However, clinically validated HPV assays used in cervical cancer screening are calibrated to yield positive results at higher thresholds of HPV viral load than the highly sensitive Linear Array PCR used in the HITCH study, thus conceivably making HPV deposition less likely to be translated into a screening positive result.
In conclusion, our study suggests that a proportion of cross-sectional HPV DNA detections in sexually active individuals may be depositions due to recent vaginal sex. The probability of type-specific HPV DNA concordance between partners was strongly and independently associated with self-reported days since last vaginal sex and condom use. Our results suggest Y chromosome DNA in vaginal samples is a correlate of sexual behaviors, but that the presence of male cells is coincidental to viral HPV deposition and transmission rather than its causal mechanism. Future research should evaluate whether time since last vaginal sex and recent condom use affect the positive predictive value of a positive HPV test in a cervical cancer screening context.
Supplementary Data
Supplementary materials are available at The Journal of Infectious Diseases online. Consisting of data provided by the authors to benefit the reader, the posted materials are not copyedited and are the sole responsibility of the authors, so questions or comments should be addressed to the corresponding author.
Notes
Contributors. A. N. B. and E. L. F. conceived and designed HITCH and obtained funding. A. N. B. oversaw operational aspects of HITCH (recruitment, data collection, provision of HPV test results to participants, database design). P. P. T. oversaw clinical activities and recruitment. F. C. and J. G. performed laboratory analyses and developed the PCR assays. M. E. Z. and A. N. B. managed the HITCH database. T. M. and E. L. F. designed the concordance analysis. T. M. performed statistical analyses and wrote the first draft of the manuscript. All authors reviewed the manuscript for intellectual content and assisted in interpretation of results.
Funding. This work was supported by Canadian Institutes of Health Research (operating grant 68893 and a team grant 83320 to E. L. F., and a Fellowship Award to T. M.); the US National Institutes of Health (grant AI073889 to E. L. F.); the Reseau FRSQ Fonds de la Recherche en Santé du Québec AIDS and Infectious Disease Network (SIDA-MI) support for optimization of molecular techniques to F. C.; and supplementary and unconditional funding by Merck-Frosst Canada Ltd and Merck & Co Ltd. The funders played no role in the writing of the manuscript, the collection/analysis of the data, or the decision to submit it for publication. The corresponding author had full access to all the data in the study and had final responsibility for the decision to submit for publication.
Potential conflicts of interest. T. M. reports research funding from the Canadian Institutes of Health Research (CIHR) during the conduct of the study. E. L. F. reports research funding from CIHR, grants from Merck, and grants from the National Institutes of Health during the conduct of the study; personal fees from Roche, personal fees from Becton, Dickinson and Company, personal fees from Merck, and personal fees from GlaxoSmithKline outside of the submitted work. P. P. T. has received payment for lectures by Merck-Frosst Canada and Bayers. F. C. reports personal fees from participation in an expert group on HPV vaccination by Merck Sharp & Dohme outside the submitted work. A. N. B., M. E. Z., and J. G. have no conflicts of interest to disclose.
Previous presentation. Results included in this paper were previously presented at the 31st International Papillomavirus Conference in Cape Town, South Africa 28 February to 4 March 2017, and will be presented at the EUROGIN conference in Amsterdam, the Netherlands 8–11 October 2017.
References
Author notes
Additional collaborators in the HITCH study group: McGill Student Health Services: Gail Kelsall, Suzanne Dumais; Concordia University Student Health Services: Melanie Drew; Research nurses: Gail Kelsall, Suzanne Dumais, Natalia Morykon, Amela Rocamora, Nathalie Slavtcheva. Study management: Allita Rodrigues. Study promotion: Vicky D’Anjou-Pomerleau, Jennifer Selinger, Elizabeth Montpetit-Dubrule, Jessica Sammut, Emilie Lapointe, Johanna Bleecker, Shady Rahayel; HPV DNA testing laboratories: Hélène Voyer, Véronique Legault, Julie Guénoun, Emilie Comète.

