


Abstract
Colonization of the gastrointestinal tract (GIT) generally precedes infection with antibiotic-resistant Enterococcus faecium . We used a mouse GIT colonization model to test differences in the colonization levels by strains from different E. faecium lineages: clade B, part of the healthy human microbiota; subclade A1, associated with infections; and subclade A2, primarily associated with animals. After mono-inoculation, there was no significant difference in colonization (measured as the geometric mean number of colony-forming units per gram) by the E. faecium clades at any time point ( P > .05). However, in competition assays, with 6 of the 7 pairs, clade B strains outcompeted clade A strains in their ability to persist in the GIT; this difference was significant in some pairs by day 2 and in all pairs by day 14 ( P < .0008–.0283). This observation may explain the predominance of clade B in the community and why antibiotic-resistant hospital-associated E. faecium are often replaced by clade B strains once patients leave the hospital.
Enterococcus faecium, a common colonizer of the gastrointestinal tract (GIT) of healthy individuals and animals [ 1 ], has emerged as an important cause of hospital-associated infections, including bacteremias, urinary tract infections (UTIs), and even endocarditis [ 2 ]. The treatment of E. faecium infections is particularly challenging owing to the intrinsic resistance of these organisms to several antibiotics and their remarkable capacity to acquire resistance to others via mutation or horizontal gene transfer [ 3 ]. Early population biology studies of E. faecium indicated that the majority of E. faecium strains responsible for hospital-associated outbreaks and infections were genotypically different from the majority of commensal isolates [ 4–6 ]. More-recent whole-genome analyses found a deep phylogenetic split into 2 E. faecium clades, the hospital-associated clade, known as clade A, and the community-associated clade, known as clade B [ 7 , 8 ]; in addition, Lebreton et al revealed a further split within clade A, into subclade A1 (associated with hospital infections) and subclade A2 (associated with animals and sporadic human infections) [ 7 ].
Although studies have demonstrated the existence of large differences in the accessory [ 7 , 9 , 10 ] and core genome [ 7 , 8 ] between the clades, very little is known about the factors that promote the predominance of subclade A1 strains in the hospital setting. Some have suggested that the transition of E. faecium from commensal to pathogen is a consequence of the enriched accessory genome of subclade A1 strains, including acquired antibiotic resistance determinants [ 11 ], genomic islands [ 9 ], and insertion sequences [ 12 , 13 ]. Putative virulence factors are also found to be enriched in subclade A1 strains [ 14 ]; however, only a few of these have been experimentally proven to contribute to pathogenesis [ 15 , 16 ].
GIT colonization with antibiotic-resistant enterococci generally precedes infection [ 17 ] . In addition, it has been demonstrated that, during hospitalization, ampicillin-resistant E. faecium strains rapidly replace ampicillin-susceptible, commensal E. faecium strains [ 18 , 19 ] . Interestingly, after a patient is discharged from the hospital, ampicillin-resistant E. faecium tend to wane [ 18 ]. Although the replacement of commensal clade B strains by subclade A1 E. faecium in the hospital environment could be related to the greater fitness, colonization capacity, or virulence potential of subclade A1 strains, our hypothesis is that commensal clade B strains have a better ability to colonize the GIT than clade A isolates, which would explain the vast predominance of clade B in humans in the community and why antibiotic-resistant E. faecium strains are often replaced once patients leave the hospital. In an attempt to better understand the dynamics of E. faecium colonization, we evaluated the ability of 12 E. faecium strains from clades A1, A2, and B to colonize the GIT of mice, individually as well as in competition with a strain of a different clade.
MATERIALS AND METHODS
Bacterial Strains, Routine Growth Conditions, and General Techniques
E. faecium used from subclades A1 and A2 and clade B and their relevant characteristics are listed in Table 1 , including 5 strains that grouped genetically into subclade A1, 3 strains from subclade A2, and 4 strains from clade B. The strains were chosen to cover a spectrum of ampicillin minimum inhibitory concentrations (MICs) and to represent different sequence types (STs; Table 1 ). Pulsed-field gel electrophoresis (PFGE) was performed as previously described [ 25 ], with some modifications, to confirm that the strains selected were not closely related (data not shown). Isolates were routinely grown at 37°C using brain heart infusion (BHI) broth or agar (Becton, Dickinson, and Company [BD, Franklin Lakes, New Jersey]). Mueller Hinton II broth (cation adjusted; BD) was used for susceptibility testing, while enterococcosel agar (EA; BD) was used to grow bacteria recovered from animals.
Enterococcus faecium Strains Used in This Study and Minimum Inhibitory Concentrations (MICs) of Select Antimicrobial Agents
| Subclade or Clade, Strain | Source (Isolation Site) | Country of Isolation/Year | MLST | MIC, μg/mL | Reference | |||
|---|---|---|---|---|---|---|---|---|
| AMP | ERY | GEN | VAN | |||||
| A1 | ||||||||
| C68 | Hospitalized patient (feces) | USA/1996 | 16 | 128 | >256 | >1024 | 128 | [ 20 ] |
| 1.230.933 | Hospitalized patient (blood) | USA/2005 | 18 | 128 | >256 | 16 | >256 | [ 10 ] |
| TX82 | Endocarditis patient (blood) | USA/1999 | 17 | 64 | 256 | 4 | >256 | [ 21 ] |
| TX0133A | Endocarditis patient (blood) | USA/2006 | 17 | 64 | >256 | 16 | >256 | [ 22 ] |
| TX16 (DO) | Endocarditis patient (blood) | USA/1992 | 18 | 16 | >256 | 16 | 0.5 | [ 23 ] |
| A2 | ||||||||
| EnGen12 | Hospitalized patient (ascites) | Netherlands/1995 | 27 | 0.5 | >256 | 16 | >256 | [ 7 ] |
| EnGen35 | Hospitalized patient (gut) | Netherlands/1979 | 66 | 1 | 4 | 8 | 0.5 | [ 7 ] |
| EnGen21 | Hospitalized patient (feces) | Netherlands/2002 | 5 | 8 | >256 | 8 | >256 | [ 7 ] |
| B | ||||||||
| Com15 | Healthy volunteer (feces) | USA/2007 | 583 | ≤0.25 | 16 | 8 | 1 | [ 10 ] |
| TX1330 | Healthy volunteer (feces) | USA/1994 | 107 | 1 | 0.25 | 8 | 1 | [ 24 ] |
| E980 | Healthy volunteer (feces) | Netherlands/1998 | 94 | ≤2 | 32 | 8 | 0.5 | [ 9 ] |
| 1.141.733 | Hospitalized patient (wound) | USA/2005 | 327 | 2 | 16 | 16 | 1 | [ 10 ] |
Abbreviations: AMP, ampicillin; ERY, erythromycin; GEN, gentamicin; MLST, multilocus sequence type; VAN, vancomycin.
Susceptibility Testing
MICs of ampicillin (Sigma-Aldrich, St. Louis, Missouri), erythromycin (Sigma-Aldrich), gentamicin (Sigma-Aldrich), and vancomycin (Sigma-Aldrich) were determined by broth microdilution according to Clinical and Laboratory Standards Institute (CLSI) guidelines.
Murine GIT Model
These studies were performed following a preapproved protocol and in compliance with guidelines by the Animal Welfare Committee of the University of Texas Health Science Center at Houston. GIT colonization studies used 6-week-old female ICR mice (Harlan Laboratories). Mice were prescreened for enterococci before and after decolonization ( Supplementary Figure 1 ) by plating dilutions of fecal pellets on EA, a selective medium for enterococci, with 8 μg/mL of nitrofurantoin (EA-NIT8). We used a decolonization regimen, with some modifications, that has been previously used to successfully establish enterococci in the GIT of mice [ 26–28 ]. In brief, 5–7 mice per strain in the mono-inoculation assays and 4 mice per combination in the competitions assays were first decolonized for 4 days with 1 mg/mL of gentamicin [ 26 ] in drinking water plus subcutaneous injections of clindamycin (2.4 mg/day/mouse) [ 27 ]. Antibiotics were stopped 24 hours prior to gavage of bacteria, to allow elimination of drug ( Supplementary Figure 1 ) [ 28 ]. Each strain was administered individually (for the mono-inoculation assays; Supplementary Table 1 ) or in combination (for the competition assays) with a strain of a different clade ( Supplementary Table 2 ) in a suspension estimated by OD 600 to contain approximately 10 7 –10 9 colony-forming units (CFUs); the actual number of CFUs was determined by plating serial dilutions of each inoculum made in 0.9% saline onto EA-NIT8 (all E. faecium strains studied grew well on EA-NIT8; Supplementary Tables 1 and 2 ). Fresh stool pellets, one per mouse obtained by gentle abdominal massage, were collected directly in sterile preweighted Eppendorf tubes on days 2, 4, 7, and 10 or 14 after inoculation of the bacteria ( Supplementary Figure 1 ), weighted, serially diluted in 0.9% saline, and plated on EA-NIT8. After incubation for 48 hours at 37°C, E. faecium colonies were initially counted, based on colony appearance; to further confirm their identity, 12 random colonies in the mono-inoculation assays and 47 random colonies in the competition assays per animal and time point were picked and grown overnight in microtiter plates containing BHI broth plus 15% glycerol. The colonies were then replica plated onto Hybond -N+ membranes placed on BHI agar, and, after overnight growth, bacteria were lysed for DNA hybridization under high-stringency conditions. Hybridization DNA probes for ddl Efm , for species confirmation [ 29 ]. IS 16 [ 13 ], present only in the subclade A1 strains, and acm [ 30 ], absent from 2 A2 subclade isolates, were used for distinguishing the strains ( Supplementary Tables 1 and 2 ). In addition, when antibiotic selection could be used (Table 1 and Supplementary Tables 1 and 2 ), colonies were replica plated onto EA with 256 μg/mL of erythromycin and/or EA with 128 μg/mL of vancomycin. Results were used to calculate the number of CFUs per gram (for the mono-inoculation assays) and percentages of bacteria recovered (for the competition assays) from fecal pellets. PFGE was performed using random colonies from each experiment to confirm the strain identity (data not shown).
Growth Curves and In Vitro Competition Assays
To assess growth characteristics, bacteria from overnight cultures were inoculated at an initial OD 600 of 0.05 and grown for 24 hours at 37°C with gentle shaking. OD 600 readings were taken every hour from 0 to 8 hours, with a final reading at 24 hours. In addition, aliquots were removed at 0, 2, 4, 8, and 24 hours for CFU determination on BHI agar [ 31 ]. For the in vitro competition studies, we performed 3 independent replicates with 3 different strain pairs (2 pairs involving A1 versus B and 1 pair involving A2 versus B). In brief, the strains grown individually overnight were inoculated at an approximately 1:1 ratio into 10 mL of BHI broth and grown for 24 hours at 37°C with gentle shaking. At time 0, 4, and 24 hours, samples were collected, and serial dilutions obtained as described above were plated onto BHI agar. To distinguish and obtain the percentage of each strain, at least 47 colonies per time point were randomly selected and plated onto BHI and antibiotic selective plates (vancomycin 128 μg/mL and erythromycin 256 μg/mL) or hybridized with the acm probe, as described above for the in vivo competition assays ( Supplementary Table 2 ).
Statistical Analysis
Statistical analyses were performed using GraphPad Prism, version 4.00 (GraphPad Software, San Diego, California). Differences in the geometric mean log 10 CFUs per gram from the mono-inoculation assays were evaluated using an unpaired t test. A paired t test was used to analyze the data from the in vitro and in vivo competition experiments, comparing the percentages of each strain recovered at different time points versus the percentages in the inoculum.
RESULTS
Representatives of E. faecium Clades Colonize the GIT of Mice at Similar Levels After Mono-inoculation
We studied 12 E. faecium strains, of which 5 grouped genetically into subclade A1, 3 were from subclade A2 [ 7 ], and 4 were from clade B (Table 1 ); for clarity, the clade or subclade designation is at times written as a subscript. Compared with the clade B strains, the clade A strains generally showed higher MICs; of note, MICs of ≥ 128 μg/mL of erythromycin and vancomycin were only observed within clade A (Table 1 ).
We first evaluated the effectiveness of antibiotic pretreatment, previously used to facilitate colonization of enterococci by reducing the endogenous flora [ 26–28 ]; as shown in Supplementary Figure 2 , this treatment was effective in reducing the load of bacteria. To assess clade-related differences in colonization capacity of the E. faecium strains, we next evaluated the ability of the 12 strains to colonize the GITs of mice after mono-inoculation. The geometric mean log 10 CFUs per gram for each strain recovered from the fecal pellets are shown in Figure 1 (see also Supplementary Figure 3 for detailed results). The greatest number of CFUs per gram were observed at day 2, with most strains recovered in the range of 10 8 to 10 9 CFUs/g, except TX82 A1 (4.91 × 10 7 CFUs/g) and TX0133A A1 (1.51 × 10 7 CFUs/g). As time progressed, the number of enterococcal CFUs found in the fecal pellets decreased, although the majority of strains were still present in high levels at day 4 (between 10 7 to 10 9 CFUs/g), and counts of only TX0133A A1 , TX1330 B , and E980 B were below this range. At day 7, some strains were still present at high levels, including C68 A1 , 1.230.933 A1 , TX16 A1 , EnGen12 A2 , and Com15 B (range, 10 7 –10 8 CFUs/g), while the others were recovered at lower levels (range, 10 3 –10 6 CFUs/g). All strains except TX0133A A1 were detected at day 14 after inoculation (Figure 1A and Supplementary Figure 3 A ). To determine whether there were overall differences in the levels of colonization between the clades, we compared the composite geometric mean log 10 CFUs/g by clades and found no statistically significant differences in the colonization levels at any of the time points evaluated ( P > .05; Figure 2 ).
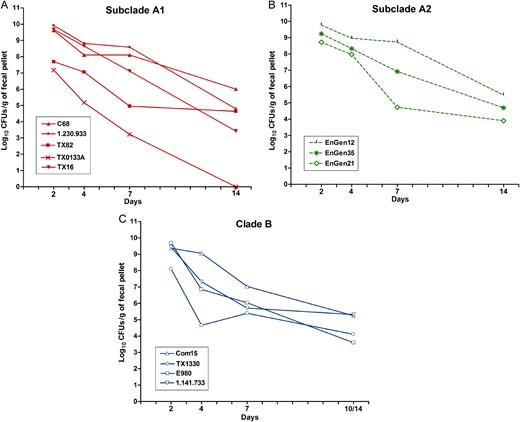
Gastrointestinal tract (GIT) colonization by different Enterococcus faecium strains after mono-inoculation. Geometric mean log 10 colony-forming units (CFUs) per gram of each strain recovered from fecal pellets on days 2–14 on enterococcosel agar with 8 μg/mL nitrofurantoin (EA-NIT8) after orogastric administration of subclade A1 strains (1.4 × 10 8 –4 × 10 9 CFUs; A ), subclade A2 strains (5 × 10 7 –3.3 × 10 9 CFUs; B ), and clade B strains (2.05 × 10 9 –3.6 × 10 9 CFUs; C ). Inoculum counts of each strain are available in Supplementary Table 1 . Each symbol represents the geometric mean CFUs per gram recovered from fecal pellets of 5–7 mice per strain Detailed results are available in Supplementary Figure 3 .
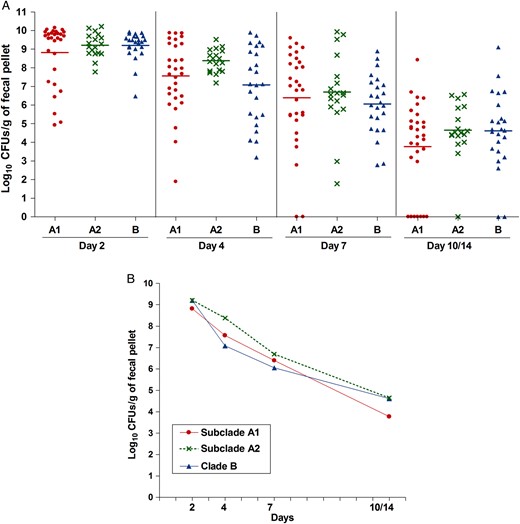
Aggregate gastrointestinal tract (GIT) colonization by the different Enterococcus faecium clades after mono-inoculation of 12 strains. A , Distribution of the numbers of bacteria recovered from fecal pellets on days 2–14 on enterococcosel agar with 8 μg/mL nitrofurantoin after orogastric administration of the 12 E. faecium strains. Each symbol represents the log 10 colony-forming units (CFUs) per gram recovered from fecal pellets of individual mice; the horizontal lines indicate the geometric mean log 10 CFUs per gram of all strains of each clade or subclade. B , Composite comparison of numbers of bacteria by clades. Each symbol represents the geometric mean log 10 CFUs per gram recovered from fecal pellets of 30, 18, and 24 mice after orogastric administration of the subclade A1, subclade A2, and clade B strains, respectively.
E. faecium Clade B Strains Outcompete Clade A Strains as Persistent Colonizers of the GITs of Mice When Present Together (Competition Assay)
To access the effect on colonization of inoculating strains together, we again first pretreated mice as described above. Then, a bacterial suspension containing an approximately 1:1 ratio, based on the OD 600 , of a strain from one clade and a strain from a different clade were administered to the mice ( Supplementary Figure 1 ); the actual ratio was later determined by plating to assess the number CFUs of each strain in the inoculum ( Supplementary Table 2 ). The results of in vivo competition assays are shown in Figures 3 and 4 . When subclade A1 strains were evaluated with clade B strains (4 different strain pairs were tested; Supplementary Table 2 ), although the dynamics of colonization varied between pairs, in 3 of 4 strain pairs tested, the commensal clade B strain significantly outcompeted the hospital-associated subclade A1 strain at day 14 ( P < .0008–.0118; Figure 3 ). Specifically, Com15 B predominated over the subclade A1 strains C68 A1 (Figure 3A ) and TX82 A1 (Figure 3B ); this difference was statistically significant at days 7 and 14 for both pairs and, for Com15 B versus TX82 A1 , at day 2 as well (Figure 3B ). Interestingly, TX1330 B , although significantly outcompeted at early time points (days 2 and 4), eventually outcompeted C68 A1 at days 7 and 14 (Figure 3C ). Only with TX16 A1 versus E980 B did the A1 strain predominate at all time points (Figure 3D ).
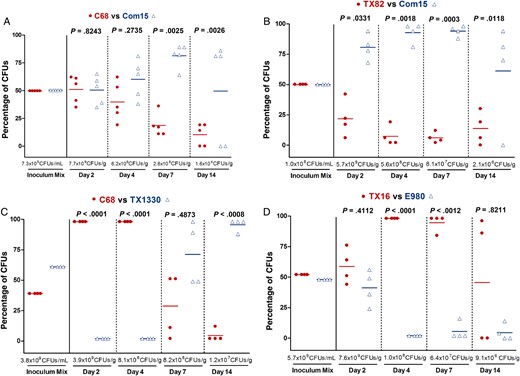
Gastrointestinal tract (GIT) colonization by Enterococcus faecium subclade A1 versus clade B strains after mixed inoculation. Percentage of colony-forming units (CFUs) of subclade A1 versus clade B from the inoculum mix and from fecal pellets recovered 2, 4, 7, and 14 days after mixed inoculation of the A1 versus B strain pairs C68 versus Com15 ( A ), TX82 versus Com15 ( B ), C68 versus TX1330 ( C ), and TX16 versus E980 ( D ). The horizontal lines indicate the means; the geometric mean log 10 CFUs per gram of E. faecium recovered from fecal pellets on enterococcosel agar with 8 μg/mL nitrofurantoin are indicated at the bottom of each graph below the x -axes. The P values were calculated using a paired t test for the percentage of bacteria recovered in the fecal pellets versus that of the inoculum mix.
Competition between clade A2 and clade B was also evaluated, using 3 different strains from each clade (3 strain pairs were tested; Supplementary Table 2 ). With these pairs, we observed the predominance of the clade B strain over the clade A2 strains as early as day 2 (Figure 4 ); for the strain pairs EnGen35 A2 versus Com15 B (Figure 4B ) and EnGen21 A2 versus E980 B (Figure 4C ), this difference was significant from day 2 onward, while TX1330 B significantly predominated over EnGen12 A2 from day 4 onward ( P = .0092; Figure 4A ). These results support our hypothesis that, in the absence of concurrent antibiotics, when commensal clade B strains are present with clade A strains, the former are better able to persist as colonizers of GIT.
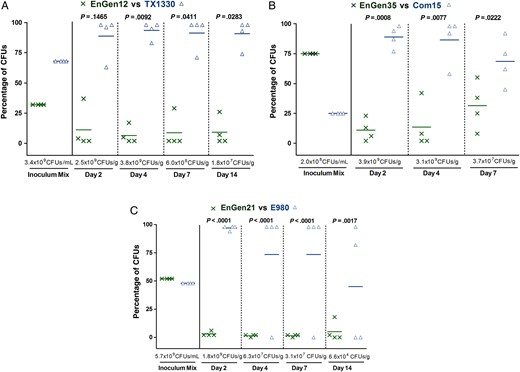
Gastrointestinal tract (GIT) colonization by Enterococcus faecium subclade A2 versus clade B strains after mixed inoculation. Percentage of colony-forming units (CFUs) of subclade A2 versus clade B from the inoculum mix and from fecal pellets recovered at days 2, 4, 7, and 14 after mixed inoculation of the A2 versus B strain pairs EnGen12 versus TX1330 ( A ), EnGen35 versus Com15 ( B ), and EnGen21 versus E980 ( C ). The horizontal lines indicate the means; the geometric mean log 10 CFUs per gram of E. faecium recovered from fecal pellets on enterococcosel agar with 8 μg/mL nitrofurantoin are indicated at the bottom of each graph below the x -axes. The P values were calculated using paired t test for the percentage of bacteria recovered in the fecal pellets versus that of the inoculum mix.
We also asked whether differences in colonization exist when a strain of subclade A1 is co-inoculated with a strain of subclade A2 ( Supplementary Table 2 ). As depicted in Supplementary Figure 4 , in 2 of 3 pairs evaluated, the subclade A1 strain outcompeted the subclade A2 strain, whereas with 1 pair, EnGen35 A2 predominated over TX82 A1 at all time points ( Supplementary Figure 4 ).
E. faecium Clade B Strains Also Predominated Over the Clade A Strains In Vitro
The clear predominance of clade B strains versus clade A in the in vivo competition assays led us to study the in vitro growth of selected strains. When grown individually, the clade B strains studied, TX1330 and Com15, showed equivalent growth kinetics based on OD 600 (data not shown) and CFU counts ( Supplementary Figure 5 A ). In contrast, the subclade A1 strains, C68 and TX82, showed a slight and prominent growth delay, respectively, evidenced by decreased OD 600 (data not shown) and CFU counts ( Supplementary Figure 5 A ). Consistent with the growth kinetics of the individual strains, in in vitro growth competition, the clade B strains also predominated over the subclade A1 strains ( Supplementary Figures 5 B and 5 C ), and this difference was significant with the pair TX82 A1 versus Com15 B (6.6% versus 93.4% and 2.8% versus 97.2% at 4 hours and 24 hours, respectively; Supplementary Figure 5 C ). When the subclade A2 strain (EnGen35) and the clade B strain (Com15) were grown individually, similar growth kinetics at the earlier time points (2 and 4 hours) were observed; however, EnGen35 A2 had fewer CFUs per milliliter than Com15 B at the later time points (8 and 24 hours; Supplementary Figure 6 A ). In the in vitro competition assay, a slight predominance of Com15 B over EnGen35 A2 was observed at 4 hours, although almost equal percentages of each strain were present at 24 hours ( Supplementary Figure 6 B ). In summary, the differences seen in the in vitro competition growth generally mirrored the differences seen in growth curves when grown alone; that is, the clade B strain grew better than clade A strains when grown alone and they also grew better (outcompeted) the clade A strains when grown together.
DISCUSSION
GIT colonization and in particular intestinal overgrowth by antibiotic-resistant enterococci are recognized risk factors for infection [ 17 ]. Clade B (community-associated) E. faecium are commonly found in healthy individuals but rarely cause infections; conversely, subclade A1 (hospital-associated) strains are responsible for the majority of infections and hospital outbreaks worldwide but are rarely reported colonizing healthy individuals in the community [ 7 , 8 ]. The complex dynamics of GIT colonization by E. faecium and the different health/disease associations of the E. faecium clades prompted us to investigate the ability of representative E. faecium strains from each clade to colonize the GIT of mice. After administering each strain individually, we were able to establish all strains, regardless of clade, in the GITs of mice (Figure 1 and Supplementary Figure 3 ); while the colonization dynamics varied between the strains, we did not find significant differences (Figure 2 ) in the ability of the clades to colonize the mouse GIT, as assessed by pooled CFU comparison. Interestingly, our in vitro growth curves, albeit with a limited number of strains, suggested a reduction in fitness for the clade A strains ( Supplementary Figures 5 A and 6 A ); however, this reduced growth in vitro of the clade A strains did not seem to parallel the density of the strain achieved in vivo after mono-inoculation (Figure 1 and Supplementary Figure 3 ), an outcome that is not unexpected since laboratory media do not replicate the complex conditions that bacteria may encounter in the GIT (eg, availability of nutrients, host immune response, and presence of competitors). In addition, the fact that the pan-genome of E. faecium is predicted to be unlimited [ 9 ] suggests that a clade could acquire genes that have the potential to increase its fitness under certain environmental conditions; indeed, one gene cluster encoding a carbohydrate phosphotransferase system specifically enriched in isolates of clinical origin (clade A) was found important for GIT colonization during antibiotic treatment [ 32 ] (differential use of carbohydrates has been suggested as one of the main drivers of the divergent evolution of the different E. faecium clades [ 7 ]).
Since competition assays have been suggested to be more sensitive for measuring fitness [ 33 ], we also asked whether differences in the colonization capacity of the clades could be observed when a strain from one clade was co-inoculated into mice with a strain from a different clade. Interestingly, we observed predominance of the clade B strains over the clade A strains in 6 of 7 pairs tested (Figures 3 and 4 ). In addition, the vitro competition assays also suggested a competition advantage of clade B strains over clade A strains ( Supplementary Figures 5 B, 5 C, and 6 B ), just as their growth also appeared better when grown alone, as mentioned above. What is surprising is that the in vivo mono-inoculation experiments did not show an in vivo difference when the strains were inoculated alone. Whether clade B strains, in competition, are better able to acquire nutrients, tolerate stress of the GIT, withstand host innate immune responses, or directly suppress clade A strains is not known. In any case, these results support our hypothesis that clade B strains have a colonization advantage over clade A, at least in the absence of concurrent antibiotic treatment. This outcome is similar to findings from a recent study of E. faecalis , in which it was shown that a commensal isolate was more persistent than the nosocomial isolate in a murine GIT colonization model [ 34 ]. A previous search for clade-specific orthologs (ie, genes present in all isolates of one clade but absent in the other) revealed that the E. faecium clade B, but not clade A, harbors a set of genes that encode factors that could potentially mediate an interaction with eukaryotic cells, suggesting the possibility that clade B strains may be more closely associated with cells of the GIT than clade A strains [ 10 ]. In addition, it is possible that the increased occurrence of resistance genes in clade A strains (Table 1 ), compared with clade B strains, could pose a fitness cost for the bacteria in the absence of antibiotics, resulting in growth rate reduction and/or a decrease in their competitive ability in vivo and in vitro, as previously suggested. [ 33 , 35 ]. Although we did not evaluate isogenic strains to determine the fitness cost of a particular resistance determinant, it is interesting to note that the only instance in which a subclade A1 strain outcompeted a clade B strain was when a vancomycin-susceptible subclade A1 strain, TX16 (also known as DO), was in competition with the clade B strain, E980 (Figure 3D ). Indeed, the acquisition of VanA-type vancomycin resistance by enterococci [ 36 ], as well as in other species [ 37 ], has been associated with a substantial fitness cost. In addition, among the subclade A1 strains evaluated, TX16 showed the lowest MIC of ampicillin (Table 1 ). The absence in TX16 of certain resistances associated with clade A1 strains [ 38 , 39 ] and its relatively early isolation suggest that this strain may have arisen early in the evolution of clade A1.
In summary, we showed that clade B strains displayed an in vitro growth advantage over subclade A1 strains both when grown alone as well as when grown in mixed cultures. Interestingly, in vivo, after mono-inoculation, subclade A1 strains showed no significant defect in their ability to colonize the GIT of mice, as they were recovered in approximately equal numbers to clade B and subclade A2 strains. However, we demonstrated the predominance of clade B strains over clade A strains in an in vivo competition model of GIT colonization, perhaps as a consequence of a direct antagonistic interaction between the strains or a better ability to compete for the same niche. These results appear to explain the vast predominance of clade B versus clade A in humans in the community and the observation that ampicillin- and vancomycin-resistant E. faecium acquired during hospitalization diminish in number and/or seem to disappear with time after patients leave the hospital [ 18 , 40 , 41 ], while commensal isolates seem to reemerge in these individuals [ 18 ].
Notes
Acknowledgments. We thank Karen Jacques-Palaz, Ester Pietta, Isabel Reyes, Serap Savasan, and Hilmi Cengiz, for their technical assistance; and Dr Michael Gilmore, for providing the 3 A2 subclade strains used in this study.
Financial support. This work was supported by the National Institutes of Health from the Division of Microbiology and Infectious Diseases, National Institute of Allergy and Infectious Diseases (grant R21 AI103260-01 to B. E. M.).
Potential conflicts of interest. B. E. M. declares relevant financial activities outside this work with Cubist, Forest, Theravance, Rib-X, and GlaxoSmithKline. All other authors report no potential conflicts. All authors have submitted the ICMJE Form for Disclosure of Potential Conflicts of Interest. Conflicts that the editors consider relevant to the content of the manuscript have been disclosed.
References
Author notes
Presented in part: American Society for Microbiology Interscience Conference of Antimicrobial Agents and Chemotherapy, San Diego, California, September 2015.
M. C. M. and K. V. S. contributed equally to this work.

