


Abstract
Subsurface temperatures were used to evaluate the effects of both urbanization and groundwater flow in three megacities in Japan. The magnitude of the heat island and time of the start of urbanization are preserved in subsurface temperature, and these signatures are clarified by meteorological data from these three cities. Heat conduction–convection analyses of subsurface temperature under the conditions of surface warming show that the ranges of the subsurface temperature indicate the magnitude of the regional groundwater flow in these three megacities in Japan.
Introduction
Subsurface temperatures are used to reconstruct past climate change, because the signature of changes in ground surface temperature is preserved in the subsurface thermal regime (Birch 1948, Lachenbruch and Marshall 1986, Beck 1982, Chapman and Harris 1993, Beltrami et al1995, Bodri and Cermak 1998, Harris and Chapman 1997, Pollack et al1998, Huang et al2000). Studies on the effects of heat from urbanization on subsurface temperature are limited, but have been done in some urbanized areas in Europe (Bodri and Cermak 1999) and in Asia (Okubo et al2003).
Heat in the subsurface is transported not only by conduction but also by convection due to groundwater flow. Kukkonen and Clauser (1994), Clauser et al (1997), Kohl (1998), Taniguchi (1993) and Taniguchi et al (1999a, 1999b, 2003) evaluated the effects of both heat conduction and convection caused by groundwater flow on temperature–depth profiles under the condition of surface temperature changes including climate changes.
However, previous studies on the effects of both surface warming and groundwater flow on subsurface temperature are limited to studies within local areas (Ferguson and Woodbury 2004). No comparison has been made between any aquifers to evaluate aquifer characteristics and the magnitude of urbanization (the heat island) using subsurface temperatures. The purpose of this study is to evaluate the effect of urbanization in three megacities, Tokyo, Osaka and Nagoya, and to evaluate difference in aquifer characteristics using subsurface temperature.
Study area and temperature–depth profiles in three megacities in Japan
The study areas are three megacities in Japan: the Tokyo, Osaka and Nagoya metropolitan areas (figure 1). The populations in Tokyo, Osaka and Nagoya are 12, 9 and 7 million, respectively. The topography of the three cities is characterized by alluvial plains, terraces and hills. The surface geology of the three cities comprises an alluvium underlain by a diluvial formation which consists of main unconfined and confined aquifers. The hydrogeology of these three cities is described in detail by Taniguchi et al (1999) for Tokyo, Taniguchi and Uemura (2005) for Osaka, and Uchida and Sakura (1999) for Nagoya.
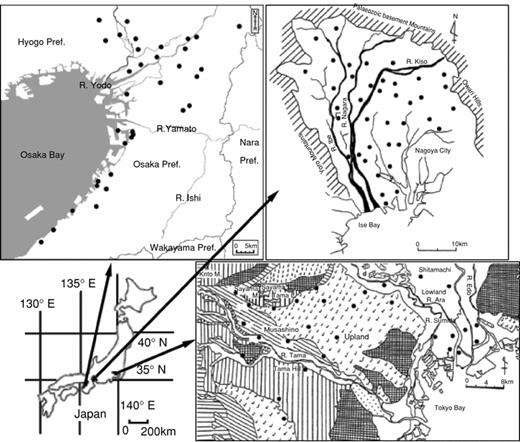
Location of the study areas (top left: Tokyo, top right: Nagoya, bottom right: Osaka).
Borehole temperatures were measured at a 1 m depth interval in 29 boreholes in Tokyo from November to December 1992 (Dapaah-Siakwan and Kayane 1995), in 37 boreholes in Osaka from August to November 2003 (Taniguchi and Uemura 2004), and in 36 boreholes in Nagoya from May 1992 to November 1994 (Uchida and Sakura 1999), by means of thermistor thermometers (Technol Seven Ltd, Japan) which can read temperature to a resolution of 0.01 °C. The boreholes are all located in the basin, including the groundwater recharge and groundwater discharge areas. The diameter and depth of the boreholes in Tokyo are 8–20 cm (mostly 15 cm) and 126–450 m (mostly 200–300 m), respectively. Well diameters in Osaka are 10–40 cm (mostly 20 cm) and depths range from 47 to 465 m (mostly 60 to 200 m). The diameter and depth of the boreholes in Nagoya are 10–20 cm (mostly 20 cm) and 50–400 m (mostly 100–300 m), respectively. The logged boreholes are cased, and the drilling was done before 1980s. Therefore, the water temperatures in the boreholes represent the temperature of groundwater surrounding the boreholes. General geothermal gradients in the study areas are estimated to be 0.022 °C m-1 in Tokyo (Taniguchi et al1999a), 0.028 °C m-1 in Osaka (Taniguchi and Uemura 2005), and 0.020 °C m-1 in Nagoya (Uchida and Sakura 1999).
All temperature–depth profiles observed in three cities are shown in figure 2. As can be seen from figure 2, there is a huge variability of the profiles. Some of them are affected by groundwater pumping (Uchida and Sakura 1999). One of the reasons for this huge variability in the temperature–depth profiles is the effect of regional groundwater flow. According to Domenico and Palciauskas (1973), temperature–depth profiles with downward water fluxes in recharge areas are concave, and those with upward fluxes in discharge areas are convex, though the temperature gradient is constant without vertical water flow. Subsurface temperature itself is higher in the discharge area than in the recharge area of the groundwater flow system (Taniguchi et al1999a). The colour profiles are located in the recharge area, and warmer profiles in the discharge area (Taniguchi et al 1999, Uchida and Sakura, 1999, Taniguchi and Uemura, 2005). Therefore, the range of temperature difference at the same depths may serve as an indication of the magnitude of groundwater flow. As can be seen from figure 2, the range of temperature difference at the same depths is larger in Nagoya than in Tokyo or Osaka, indicating greater groundwater flow in Nagoya.
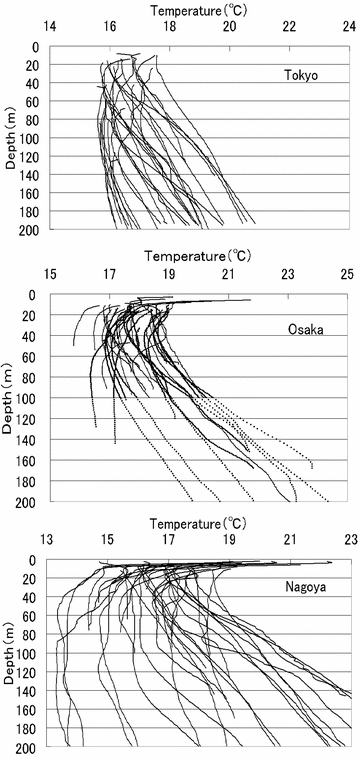
Observed temperature–depth profiles in the three cities (top: Tokyo; middle: Osaka; bottom: Nagoya).
Effects of urbanization on subsurface temperature
The averages of all temperature–depth profiles observed in the three cities with standard deviations and average thermal gradients are shown in figure 3. Although subsurface temperature shifts upwards at 150 to 200 m depth in Osaka because many boreholes at that range are located in the discharge area (concave profiles), the averaged temperature–depth profiles in the three cities show evidence of surface warming. The difference in extrapolated surface temperature between the observed temperature and thermal gradient is estimated to be 2.4 °C in Tokyo (figure 3 top), 2.0 °C in Osaka (figure 3 middle), and 1.7 °C in Nagoya (figure 3 bottom).
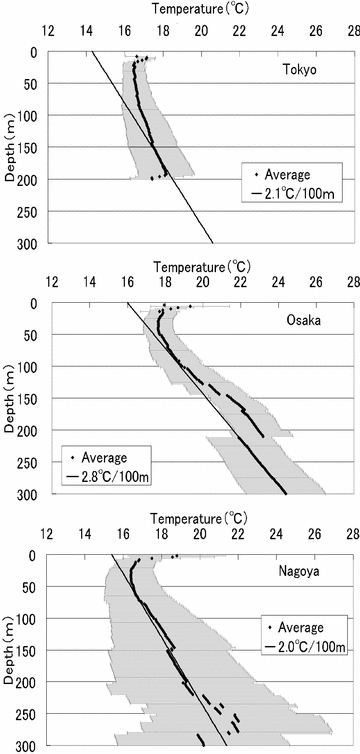
Effects of urbanization on subsurface temperature (top: Tokyo; middle: Osaka; bottom: Nagoya).
Air temperature records in the three cities are shown in figure 4. As can be seen from figure 2, air temperature increased during the last 100 years by 2.96 °C (R2 = 0.8015) in Tokyo, 2.11 °C (R2 = 0.6563) in Osaka, and 1.47 °C (R2 = 0.393) in Nagoya. According to the analyses of global trends of air temperature change by Hansen and Lebedeff (1987), the magnitude of global warming is about 0.5 °C/100 years. The estimated increase in surface temperature from borehole temperature by Huang et al (2000) is also about 0.5 °C/100 years. Therefore, the increased air temperature in Tokyo, Osaka and Nagoya include not only global warming but also other factors. These three cities are developed and urbanized rapidly during the last century, in particular after the Second World War. Therefore, the most reasonable explanation for the increase in air temperature greater than global warming is the urbanization of these three cities.
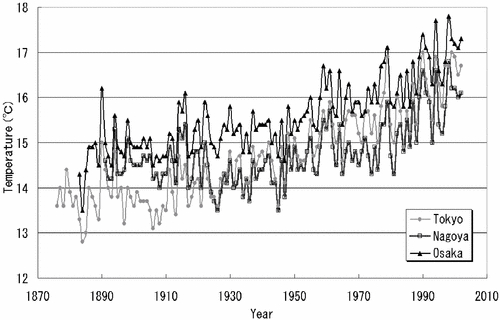
Changes in air temperature in the three cities.
As well as the magnitude of surface warming due to urbanization, the depth apart from the thermal gradient (figure 3) is greatest in Tokyo (130 m), followed by Osaka (80 m) and Nagoya (60 m). The analyses of subsurface temperature using heat conduction–convection theory under the condition of surface warming showed that the depth of the minimum temperature in the profile increased with the time lapse from the beginning of surface warming (Taniguchi and Uemura 2005). According to the air temperature changes in the three cities (figure 1), air temperature started to increase in Tokyo first, followed by Osaka and Nagoya. Therefore, the depth apart from the thermal gradient may show differences in the history of urbanization in the three cities. In this paper, we rather focus on the differences between the cities—Tokyo, Osaka and Nagoya. The differences within a city (in Osaka) was discussed by Taniguchi and Uemura (2005).
Effects of groundwater flow on subsurface temperature
Thermal and hydraulic parameters for the three cities.
| T0 (°C) | TG (°C) | B (°C year-1) | t (year) | α (m2 s-1) | cρ (J m-3 °C-1) | K (m s-1) | i | |
| Tokyo | 14.0 | 0.021 | 0.025 | 100 | 6 × 10⁻⁷ a | 2.6 × 10⁶a | 1 × 10⁻⁵ (10-4–10-6) a | 2 × 10⁻³ (10-2–10-3) a |
| Osaka | 15.0 | 0.031 | 0.020 | 100 | 6 × 10⁻⁷ b, c | 2.7 × 10⁶ b, c | 5 × 10⁻⁵ (10-4–10-5) b | 3 × 10⁻⁴ (10-3–10-4) b |
| Nagoya | 14.0 | 0.030 | 0.015 | 100 | 6 × 10⁻⁷ d | 2.9 × 10⁶d | 6 × 10⁻⁴ (10-3–10-4) d | 1 × 10⁻⁴ (10-3–10-5) d |
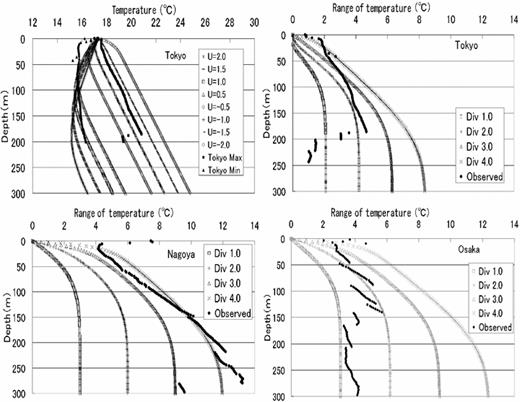
Effects of groundwater flow on subsurface temperature (top left: temperature–depth profiles in Tokyo; top right: ranges of temperature–depth profiles in Tokyo; bottom left: ranges of temperature–depth profiles in Nagoya, bottom right: ranges of temperature–depth profiles in Osaka). DIV shows the range of U.
Temperature differences (maximum–minimum) versus depth profiles observed and calculated with U = ±0.5 m year-1 (DIV: 1.0 m year-1, DIV shows the range of U), U = ±1.0 m year-1 (DIV: 2.0 m year-1), U = ±1.5 m year1-1 (DIV: 3.0 m year-1), and U = -2.0 m year-1 (DIV: 4.0 m year-1) for the three cities are shown in figure 5 (top right, bottom right, bottom left) for Tokyo, Osaka and Nagoya, respectively. As can be seen from figure 5 (top right), the observed values agree with the calculated ones with U = ±1.0 m year-1 (DIV: 2.0 at a deep level) to U = ±1.5 m year-1 (DIV: 3.0 at a shallow level) for Tokyo. Assuming values of 4.18 × 10³ J kg-1 °C-1 and 103 kg m-3 for c0 and ρ0, and thermal parameters of the aquifer (table 1), the estimated groundwater flux is from 0.62 to 0.93 m year-1 with an average of 0.78 m year-1. On the other hand, the groundwater flux obtained from the hydraulic gradient and conductivity (i and K in table 1) is 0.6 m year-1 for Tokyo. The groundwater flux estimated from subsurface temperature agrees well with the value obtained from hydraulic parameters for Tokyo.
According to figure 5 (bottom right, bottom left), the observed values agree with the calculated ones with U = ±0.5 m year-1 (DIV: 1.0 at a deep level) to U = ±1.0 m year-1 (DIV: 2.0 at a shallow level) for Osaka, and with U = ±1.5 m year-1 (DIV: 3.0 at a shallow level) to U = ±2.0 m year-1 (DIV: 4.0 at a deep level) for Nagoya. Using thermal parameters shown in table 1, the estimated groundwater flux is from 0.32 to 0.65 m year-1 with an average of 0.48 m year-1 for Osaka, and from 0.93 m year-1 to 1.24 m year-1 with an average of 1.08 m year-1 for Nagoya. Groundwater fluxes obtained from the hydraulic gradient (i in table 1) and conductivity (K in table 1) are 0.45 m year-1 for Osaka and 1.8 m year-1 for Nagoya, respectively. The groundwater fluxes estimated from subsurface temperature agree well with the values obtained from hydraulic parameters for Osaka and Nagoya.
The analyses are based on a very simple one-dimensional model with a uniform velocity of the vertical. Although the variability of the temperature–depth profiles within each city is huge and two-dimensional (2D) analyses may be needed, the simple 1D model can tell us that the range of the temperature at the same depth may indicate the magnitude of the regional groundwater flow in each city.
Conclusions
The main conclusions of this study are summarized as follows:
The observed temperature–depth profiles in three cities show evidence of surface warming. The difference in extrapolated surface temperature between the observed temperature and thermal gradient was estimated to be 2.4 °C in Tokyo, 2.0 °C in Osaka and 1.7 °C in Nagoya, which agree well with the air temperature records during the last 100 years in the three cities.
The observed temperature–depth apart from the thermal gradient was deeper in Tokyo than that in Osaka and Nagoya, which shows that the start of urbanization was earlier in Tokyo than in Osaka and Nagoya. This is also in agreement with the meteorological data.
The difference between maximum and minimum temperatures at the same depth indicates the magnitude of groundwater flux.
The calculated groundwater flux using the difference between maximum and minimum temperatures at the same depth is in agreement with the groundwater flux obtained from hydraulic parameters in the three cities.
Acknowledgment
This research was financially supported in part by JSPS research grant 14654081 from MESC, Japan.
