


Abstract
Collision risk (CR) assessment is necessary for avoiding collisions with other ships. The CR can be used to make decisions on collision avoidance. In this respect, the ship domain and the closest point of approach (CPA)-based methods have been proposed to assess the CRs. However, the ship domain method is limited in terms of the quantitative calculation of the CR, whereas the CPA-based method does not guarantee reliable collision avoidance. In this study, an improved method is proposed for the quantitative calculation of the CR in ship navigation that combines the advantages of two existing methods. The proposed method calculates the CR using the CPA and defines the ship domain as a critical value of the CR to ensure reliable collision avoidance. In this process, the CR value of another ship on the boundary of the ship domain is calculated as 1, which implies that collision occurs, and the coefficients for the CR calculation are adjusted considering the distance from the ship domain. Furthermore, the manoeuvring performance and the heading angle of the ships are considered in the calculation of the CR. To evaluate the proposed method, it is applied to various examples, including a comparison with previous methods. The results show that the proposed method can be used to obtain a quantitative CR for collision avoidance.
This study proposes an improved method for the quantitative calculation of the collision risk.
The generalized ship domain considering the manoeuvring performance is defined.
The proposed method mitigates the issues of discontinuity and overestimation for non-risky ships.
Simulations are performed using actual automatic identification system data to evaluate the applicability of the proposed method.
1. Introduction
1.1. Research background
Human error is believed to be the main cause of most ship collision accidents. The results of previous studies have shown that 60% of collision and grounding cases are caused by human error (Gale & Patraiko, 2007). When considering human errors, “insufficient assessment of the situation” (24%) and “poor lookout” (23%) are the two major causes. Numerous studies have been conducted to minimize collisions caused by human errors, and one of them is the risk assessment in collision situations.
Two representative methods for assessing the collision risk (CR) of ships are the ship domain method (Fujii & Tanaka, 1971; Coldwell, 1983; Zhu et al., 2001; Wang, 2010; Wang & Chin, 2016; Mou et al., 2020) and the closest point of approach (CPA)-based method (Kearon, 1977; Imazu & Koyama, 1984; Kijima & Furukawa, 2001; Mou et al., 2010; Ahn et al., 2012; Zhen et al., 2017; Hu & Park, 2020). The closest point describes the position whereby the own ship and the target ship (this is regarded as the most dangerous ship among those near the own ship) are the closest when the current heading angle and speed are maintained. The ship domain method is an approach for defining the shape of the ship domain and preventing other ships from entering this domain to ensure safety (Szlapczynski & Szlapczynska, 2017; Ozturk & Cicek, 2019). The CPA-based method is an approach for the quantitative calculation of the CR of a ship. In addition to these two methods, there is a velocity-based method, which is represented as a velocity obstacle (VO) to complement the aforementioned methods (Zhao et al., 2016; Huang & van Gelder, 2020). The advantages and disadvantages of representative methods are summarized in Table 1.
Advantages and disadvantages of the methods of the CR assessment.
| Method | Output | Advantages | Disadvantages |
|---|---|---|---|
| Ship domain method | Ship domain | - Ensure reliable collision avoidance | - Cannot calculate quantitative CR |
| CPA-based method | Quantitative CR | - Calculate the quantitative CR | - Does not reliably guarantee collision avoidance |
| Velocity-based method | VO | - Ensure reliable collision avoidance | - Cannot calculate quantitative CR |
| The proposed method | Quantitative CR and ship domain | - Ensure collision avoidance while calculating the quantitative CR |
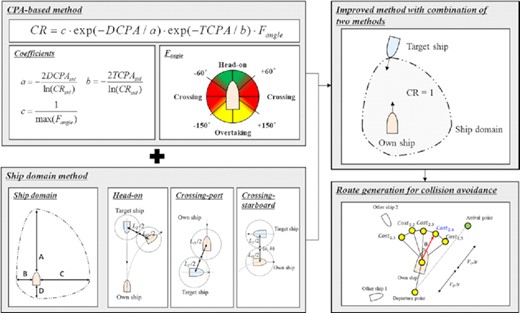
The ship domain and CPA-based methods have several advantages and disadvantages. The former can ensure collision avoidance but cannot quantitatively calculate the CR, whereas the latter cannot reliably guarantee collision avoidance but facilitates the quantitative calculation of the CR. Therefore, this study aims to develop an improved method for calculating the quantitative CR for ship navigation that combines the advantages of these two methods. The proposed method calculates the CR using the CPA and defines the ship domain in shape using a combination of ellipses as a critical value of the CR to ensure reliable collision avoidance. In this process, the CR of another ship on the boundary of the ship domain is calculated as 1, which implies that the collision occurs. The coefficients for the CR calculation are then adjusted, considering the distance from the ship domain. Furthermore, the manoeuvring performance and the heading angle of the ships are considered in the calculation of the CR.
1.2. Related studies
In this section, various studies on CR assessment are described by classifying them into the ship domain method and the CPA-based method. The ship domain is defined as the area around a ship and is used as part of the safety criterion for ship navigation. Fujii and Tanaka (1971) proposed a ship domain method using global positioning system data from Tokyo Bay. In this case, the ship’s principal dimensions, speed over ground (SOG), and location information were utilized, and regression analysis was performed using such information to define a ship domain with an elliptical shape. Subsequent to the initial proposal of this method, numerous studies have been conducted to improve the shape of the ship domain. Given that “International Regulation for Preventing Collisions at Sea (COLREGs)” generally requires ships to take avoidance action by starboard, most ship domains have an asymmetrical shape to allow for more distance margin on the right side (International Maritime Organization, 1972). Coldwell (1983) used radio detection and ranging data for 64 hours from the Grimsby area to define the ship domain. Although the study was applied only to a specific region, a ship domain with a different shape was obtained by separating encounter situations into the categories of head-on and overtaking. Recently, several studies have been conducted to consider various factors, such as the SOG and the principal dimensions of the ship. Zhu et al. (2001) proposed a method to define the ship domain using a neural network based on the information obtained for 60 ships. The ship domain was defined by considering a variety of CR factors, such as the distance between ships and other relevant information. Wang (2010) proposed a method for defining a fuzzy quaternion ship domain to identify the level of navigational safety. The ship domain was defined as an elliptical shape considering the ship’s length and the SOG, and consisted of a series of rings to indicate various levels of navigational safety. Wang and Chin (2016) proposed a ship domain method based on the data obtained for ships in Singapore Strait. To define the ship domain, a speed function determined by the SOG was formulated. The defined ship domain was evaluated based on comparison with previous studies. Mou et al. (2020) defined a ship domain with an elliptical shape and performed collision avoidance using the VO method. In determining the route of the own ship, manoeuvring equations were used to ascertain its viability for an actual ship.
There are also velocity-based methods to consider spatiotemporal proximity between ships in velocity space while ensuring collision avoidance (Chen et al., 2019). Zhao et al. (2016) studied collision avoidance of unmanned vessels using the CPA and VO. They proposed the optimal reciprocal collision avoidance algorithm, which is an extension of the VO, and performed real-time collision avoidance while satisfying COLREGs. Huang and van Gelder (2020) proposed a method for calculating a time-varying CR and calculated the CR by using the VO method to calculate the quantitative CR while ensuring collision avoidance.
Also, there has been an attempt to assess the CR by combining the ship domain method and the CPA-based method. Szlapczynski and Szlapczynska (2016) combined the ship domain method and the CPA method to calculate a CR based on the domain violation using an ellipse-shaped ship domain. However, there was a limitation in that the CR cannot be evaluated for situations where there is no domain violation.
Table 2 summarizes several studies on CR assessment.
Related studies on CR assessment.
| Research | Method | Input | Consideration of manoeuvrability |
|---|---|---|---|
| Fujii and Tanaka (1971) | Ship domain method | SOG | No |
| Coldwell (1983) | – | No | |
| Zhu et al. (2001) | Distance between ships | No | |
| Wang (2010) | Ship length, SOG | Yes | |
| Wang and Chin (2016) | Ship length, SOG | No | |
| Mou et al. (2020) | Ship’s relative speed | Yes | |
| Kearon (1977) | CPA-based method | DCPA, TCPA | No |
| Kijima and Furukawa (2001) | DCPA, TCPA | Yes | |
| Mou et al. (2010) | DCPA, TCPA, relative heading angle | No | |
| Ahn et al. (2012) | DCPA, TCPA | No | |
| Zhen et al. (2017) | DCPA, TCPA | No | |
| Hu and Park (2020) | DCPA, TCPA, vulnerability factor | No | |
| Zhao et al. (2016) | Velocity-based method | DCPA, TCPA, SOG | No |
| Huang and van Gelder (2020) | DCPA, SOG | Yes | |
| Szlapczynski and Szlapczynska (2016) | Combined method of ship domain and CPA | TCPA, ship’s length | No |
| This study (2020) | DCPA, TCPA, ship’s relative speed, distance between ships | Yes |
However, most previous studies focused only on ship navigation of a specific ocean area and did not consider the manoeuvrability of ships in their calculations of CR. Therefore, it is difficult to apply these approaches to different ocean regions. Moreover, there are limited published studies on a generalized method to define the ship domain that consider manoeuvring characteristics of a ship. In this study, a method for defining the ship domain that can be applied to all ocean environments that consider the ship’s manoeuvring performance and specifications is proposed. To consider the manoeuvrability of the own ship, 3-DOF manoeuvring equations are used.
The remainder of this paper is organized as follows. In Section 2, the ship domain for collision avoidance is defined. Section 3 describes the quantitative calculation of the CR using the CPA. Section 4 introduces the method of route generation for collision avoidance. Section 5 describes the verification of the proposed method. In Section 6, several applications of the proposed method and the results are presented. Finally, Section 7 summarizes the findings and examines future studies.
2. Definition of the Ship Domain
As previously indicated, current ship domain methods can be applied under certain conditions, such as for a specific area or speed. In this study, we proposed a generalized method for defining the ship domain, considering the manoeuvring performance of the own ship. There are numerous ships whose specifications, such as the type and length, are unknown even in the AIS data. To calculate the CR for these ships, we defined the ship domain with only the position and relative speed of the target ship. The following assumptions are made to define the ship domain:
Other ships do not take action to avoid collisions.
The own ship follows COLREGs.
2.1. The rules for collision avoidance: COLREGs
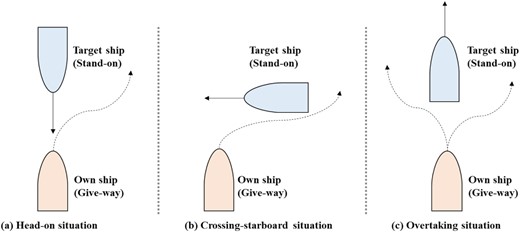
COLREGs define how a ship should take action to avoid collisions in head-on, crossing, and overtaking situations. In this section, the rules for these three situations in which the own ship should avoid the target ship are explained. In this case, the target ship is the most dangerous among the other nearby ships in terms of the CR. Each ship can be defined as a stand-on or give-way according to the rules. The rules for the head-on situation are shown in Fig. 1.
COLREGs for each encountering situation of two ships.
As shown in Fig. 1, the own ship in the head-on situation should avoid the target ship in the direction of the starboard (see Fig. 1a). The own ship in the crossing situation must alter the course to the starboard (see Fig. 1b). The own ship in the overtaking situation can set a course in any direction of the target ship (see Fig. 1c). In this study, the CR was calculated according to these COLREGs.
2.2. 3-DOF manoeuvring equations of the ship
2.3. Definition of the ship domain
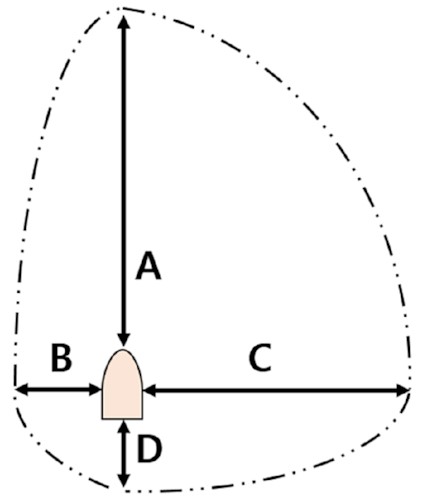
The ship domain can be regarded as the minimum area for collision avoidance between the own ship and other ships, which prevents the other ships from passing through the ship domain of the own ship. Considering COLREGs, the ship domain can be depicted as a combination of ellipses, as shown in Fig. 2.
Ship domain of a ship.
The ship domain is separated into four regions as described in Fig. 2. A, B, C, and D refer to the front, left, right, and backside of the ship domain, respectively. As described in Section 2.1, in most situations, the ship should avoid collisions in the direction of the starboard. Thus, the shape of the ship domain is a combination of ellipses, which is also highlighted in several previous studies (Zhu et al., 2001; Wang & Chin, 2016). Each length (LA, LB, and LC) of the regions A, B, and C can be determined by performing a simulation for collision avoidance of the own ship and the target ship for head-on, crossing-port, and crossing-starboard situations. In this respect, manoeuvring equations in Section 2.2 can be used. The length LD of region D can be determined for a given situation when the target ship approaches the astern of the own ship.
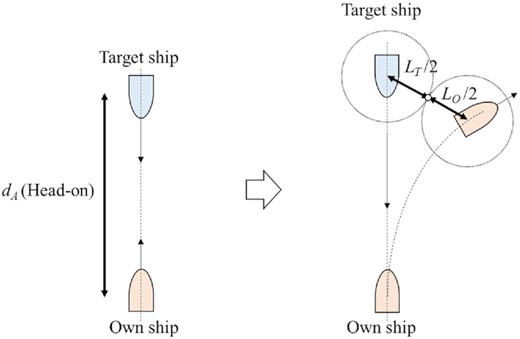
Three situations were assumed to define the ship domain in this study. The first is the head-on situation wherein the own ship and the target ship are head-on. As assumed in this section, the target ship does not take action to avoid other ships, and the own ship avoids the target ship while satisfying COLREGs. When the own ship avoids the target ship, it is assumed that the own ship turns right with the maximum rudder angle, as shown in Fig. 3. Then, the minimum distance (dA) for which the own ship avoids the target ship can be calculated. Thus, the distance between the ships at the closest point is (LO + LT)/2, where LO refers to the length of the own ship and LT refers to the length of the target ship. In this study, the front length (LA) of the ship domain was determined as dA.
Definition of the ship domain in the head-on situation.
To determine the left length (LB) of the ship domain, a crossing-port situation in which the target ship approaches the port side of the own ship is used. In this situation, the ship is a stand-on, and there is no obligation for collision avoidance, as shown in Fig. 4. The initial distance (dB) before collision avoidance for which the distance between the own ship and the target ship is equal to (LO + LT)/2 can then be calculated using manoeuvring equations. Thus, the left length (LB) of the ship domain was determined to be dB.
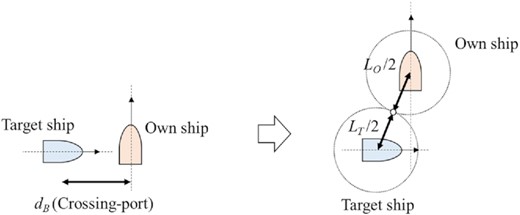
Definition of the ship domain in the crossing-port situation.
To determine the right length (LC) of the ship domain, a crossing-starboard situation in which the target ship approaches the starboard side of the own ship can be used (see Fig. 5). The own ship takes action to avoid the target ship.
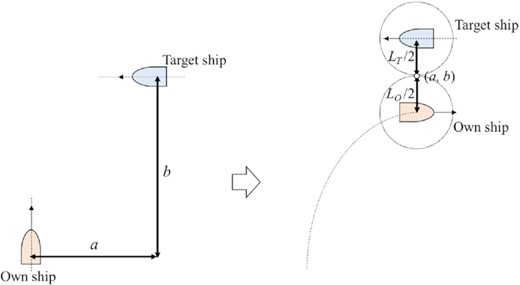
Collision avoidance in the crossing-starboard situation.
In this situation, the closest point (a, b), where the distance between the own ship and the target ship is equal to (LO + LT)/2, can be calculated by using manoeuvring equations. Assuming that an ellipse passes the point (a, b), the short radius (dC) of the ellipse can be obtained, which is determined to be the right length (LC) of the ship domain (see Fig. 6).
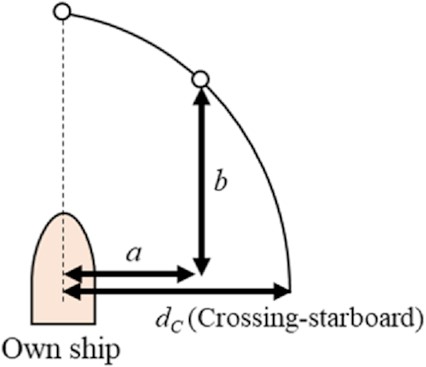
Definition of the ship domain in the crossing-starboard situation.
According to COLREGs, it is not a ship’s responsibility to avoid other ships in the rear; however, for safety, some distance between the ships is required. As such, the backside length (LD) of the ship domain was determined as (LO + LT)/2 in this study.
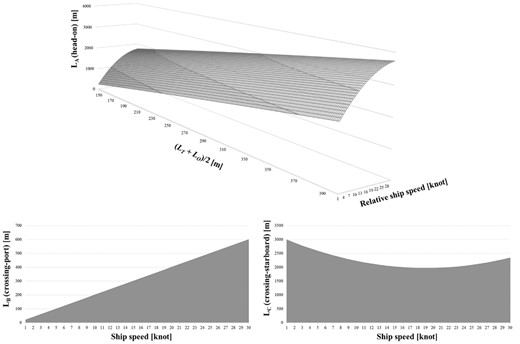
Lengths of the ship domain according to the ship length and the relative ship speed.
The backside length (LD) of the ship domain was determined as (LO + LT)/2 regardless of the ship’s speed.
3. Calculation of the CR
Various methods for the quantitative assessment of CR using a mathematical model have been proposed, as described in Section 1.2. Among them, Mou et al. (2010) and Zhen et al. (2017) used negative exponential functions to express the CR using a combination of DCPA and TCPA. Mou et al. (2010) also considered the effect of the relative heading angle by introducing the factor Fangle, as shown in equation (2). In this section, we present a method for calculating the CR by improving the previous studies.
3.1. Improvement of the CPA-based method
The methods proposed in previous studies, such as the method by Mou et al. (2010), have two limitations. First, a discontinuous change in the CR calculation occurs when the heading angle is changed. Second, the CR values of other ships moving away from the own ship and settled ships are overestimated. To improve the discontinuity of the CR, a continuous value of Fangle is proposed. As shown in Fig. 8, the value of Fangle for each situation is modified to obtain a continuous value depending on the heading angle.
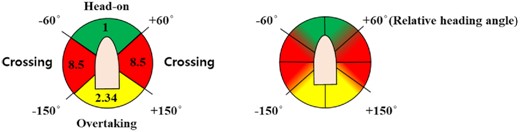
The value of Fangle of Mou et al. (2010) (left) and the proposed method (right).
In the method by Mou et al. (2010), for the target ship with a relative heading angle of 60 deg or less, the value of Fangle for the head-on situation is used. For ships with relative heading angles between 60 and 150 deg, the value of Fangle for the crossing situation is used. Otherwise, the value of Fangle for the overtaking situation is used. Thus, the value of Fangle at 60 and 150 deg changes discontinuously. To solve this problem, the values of Fangle at 45 to 60 deg and 150 to 165 deg were adjusted, as shown in Fig. 9, so that the values are continuous.
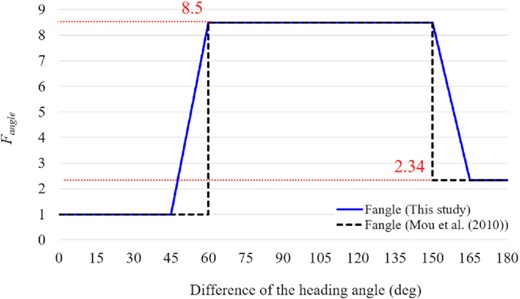
Fangle of Mou et al. (2010) and the proposed method.
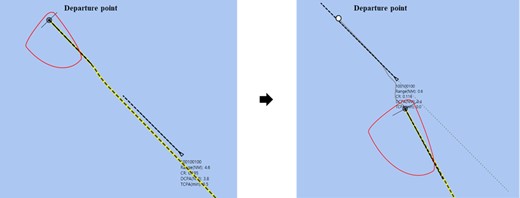
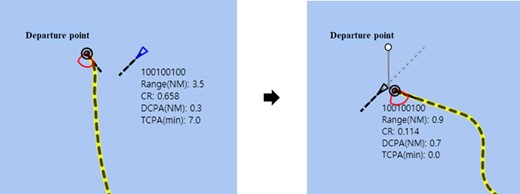
In addition, in the proposed method, the value of Fangle for the target ship heading away from the own ship (TCPA = 0) or the settled ship is determined to be 1. However, if we calculate the CR using the method of Mou et al. (2010), this value is overestimated. Figure 10 shows an example of the CR calculation and route generation for collision avoidance by Mou et al. (2010) and this study.
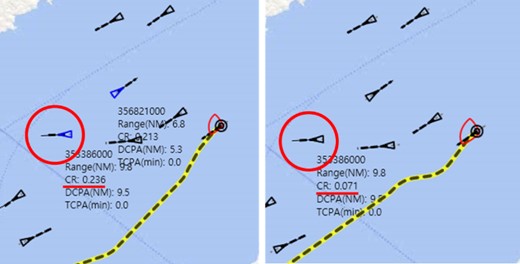
Comparison of the CR and the route for collision avoidance between the method by Mou et al. (2010) (left) and the proposed method (right).
The symbols for the own ship and other ships are defined as shown in Fig. 11 following the guidelines of the International Maritime Organization (International Maritime Organization, 2019).
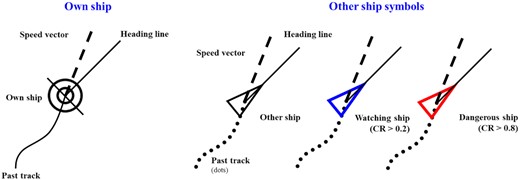
Symbols for the own ship and other ships.
The own ship is represented by black circles, and the other ships are represented by black, blue, or red triangles. In Fig. 10, the other ships with a CR of 0.2 or higher are represented in blue, and dangerous ships with a CR of 0.8 or higher are identified in red. The heading line of each ship is represented by a straight line, and the speed vector is represented by a dotted line. A route for collision avoidance is indicated by a yellow dotted line. In Fig. 10, the highlighted target ship with an MMSI (Maritime Mobile Service Identities) of 353 386 000 in the red circle is currently moving away from the own ship with TCPA = 0. According to the method by Mou et al. (2010), the value of Fangle for this ship was calculated to be high, and thus the CR was overestimated to be 0.236. However, the CR of the highlighted target ship was reasonably reduced from 0.236 to 0.071 in the method, eliminating the need to be cautious of the non-risky ship.
3.2. Calculation of the CR considering the ship domain
In previous studies on the calculation of CR, the range of the CR value was not determined. Therefore, although the probability of collision was considered to be high as the CR value increased, it was difficult to determine whether the collision occurred depending on this value. Therefore, in this study, a quantitative method for determining the CR is proposed so that this parameter has a value of 1 at the boundary of the ship domain (see Fig. 12), and a smaller value (minimum value is 0) as the distance increases. In the ship domain, the own ship and the target ship are not close enough to collide, but the conservative ship domain is set to a CR value of 1 in consideration of the actual collision avoidance situation. Given that the range of the CR value is fixed and its maximum value for a collision is defined, the CR can be easily associated with the actual probability of collision, and the occurrence of a collision can be quantitatively determined.
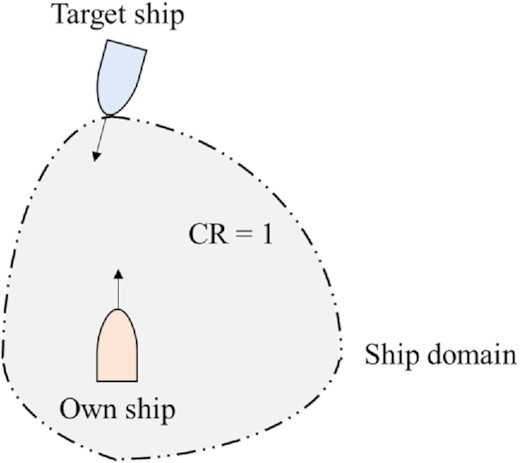
The CR value on the boundary of the ship domain.
In these equations, DCPAstd is the DCPA of the standard CR, and TCPAstd is the TCPA of the standard CR. Coefficients a and b were determined by considering the length and speed of the own ship and the target ship, and the distance at which the ships generally start to avoid a collision in the actual situation. In addition, their values were set such that the target ship has the standard CR (CRstd) when it is located at the distance DCPAstd from the boundary of the ship domain. CRstd is the value of the CR, which is set as a criterion to determine whether the own ship should start to avoid the target ship.
4. Route Generation for Collision Avoidance
To analyse the CR of the own ship using actual AIS data and to evaluate whether the proposed method applies to collision avoidance, a method for generating the route based on the proposed CR calculation method is introduced in this section.
In this study, the greedy algorithm was used to describe the generation of the route, considering the locations of other ships obtained from the AIS data. To consider the manoeuvring performance of a ship, the isometric-based greedy algorithm was used instead of the grid-based method, in which the direction of the ship is restrained. We used the isometric-based greedy algorithm in which the action spaces are in the form of isochrones. The method for generating the route using this algorithm is shown in Fig. 13.
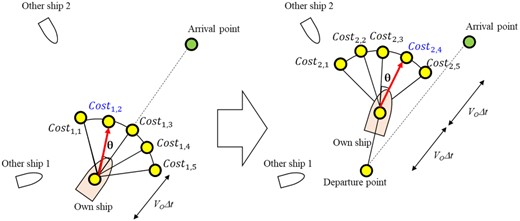
Generation of the route using the isometric-based greedy algorithm.

Process of collision avoidance route calculation.
Among the points on the same isochrone, we select the point with the minimum cost value, and the own ship moves to the selected point (red arrow in Fig. 13) after a time interval. Subsequently, new isochrones and temporary points are generated. By repeating this process for the arrival point, we can generate a route that can minimize the CR and the deviation.
5. Verification
To check the applicability and effectiveness of the proposed method, its verification was made using simple examples. For this, the examples for the head-on, crossing-starboard, and crossing-port situations were defined. In these situations, it is assumed that the target ship’s speed is 20 knots, and each ship starts the simulation at a distance of 6.5 km. The input data of the own and other ships for the simulations are summarized in Table 3.
Input data for the own and other ships for the applications.
| Ship | Item | Value |
|---|---|---|
| Own ship | L (length) | 230.66 m |
| B (breadth) | 32 m | |
| T (draft) | 10.7 m | |
| MMSI | 500 500 500 | |
| SOG | 15 knots | |
| Departure point, way points, arrival point | Specified in Table 4 | |
| Recognizable distance to other ships | 20 km | |
| Allowable distance deviated from the route | 10 km | |
| Other ships | Location, MMSI, SOG, COG, heading | Given from the AIS data |
The simulation result for the head-on situation in which the direction difference between the ships is 180 deg is shown in Fig. 15. As a result of the simulation, the maximum CR was 0.30. The collision avoidance was done in the direction of the starboard according to COLREGs.
Simulation result for the head-on situation.
The simulation result for the crossing-starboard situation in which the direction difference between the ships is 105 deg is shown in Fig. 16. As a result of the simulation, the maximum CR was 0.573. The collision avoidance was done in the direction of the starboard according to COLREGs.
Simulation result for the crossing-starboard situation.
The simulation result for the crossing-port situation in which the direction difference between the ships is 90 deg is shown in Fig. 17. As a result of the simulation, the maximum CR was 0.658. The collision avoidance was done in the direction of the starboard according to COLREGs.
Simulation result for the crossing-port situation.
From the verification, we can see that collisions were successfully avoided in all situations considering COLREGs.
6. Applications
In this section, more simulations of collision avoidance for two scenarios using actual AIS data are presented. For each scenario, the route for collision avoidance was determined using the isochrone algorithm defined in Section 4, based on the calculation method for CR proposed in this study. The results for each scenario were compared with the results of the previous representative studies by Mou et al. (2010) and Kearon (1977).
6.1. Input data and coefficients for collision avoidance
The input data of the own and other ships for the simulations are summarized in Table 3.
As shown in Table 3, the own ship was assumed to be a container ship 231 m in length, 32 m in breadth, and 46 070 m3 in displacement. The coefficients required to solve the manoeuvring equations were taken from the study of Perez and Blanke (2002). The recognizable distance of the other ships from the own ship was limited to 20 km, and the allowable distance of the own ship that deviated from the base route was assumed to be 10 km.
The coefficients of the methods of Kearon (1977) and Mou et al. (2010) were also determined for a comparative test using the proposed method. The coefficients cDCPA and cTCPA in equation (1) were set to be 4.0 × 10⁻⁵ [1/m] and 0.01 [1/sec] to set the range of CR from 0 to 1.
6.2. Simulation case definition
For the simulations, two scenarios were defined. The CR value and the route for collision avoidance are presented as the output. A summary of the simulation results for the two scenarios is shown in Table 4.
Summary of each case.
Summary of each case.
For each scenario, three cases (Cases 1 to 3 for Scenario A and Cases 4 to 6 for Scenario B) were defined using the different methods for calculating the CR. For comparison, the CR values from the previous methods were normalized from 0 to 1, by dividing by the maximum value obtained for each method.
6.3. Simulation results and discussion
The result for each case in Scenario A is shown in Fig. 18. In this figure, the dashed lines represent the route generated for collision avoidance based on each method for calculating the CR. The red dashed line represents the result for Mou et al. (2010)’s method (Case 1), the black dashed line the approach by Kearon (1977)’s method (Case 2), and the green dashed line the proposed method (Case 3).
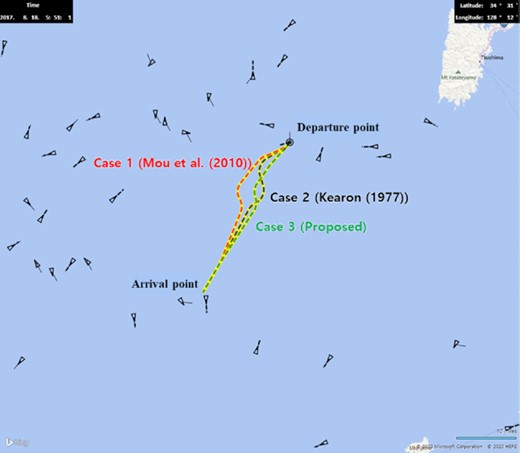
Routes for collision avoidance of each case in Scenario A.
Figure 19 shows the history of the CR values for target ships depending on the sailing distance in Scenario A.
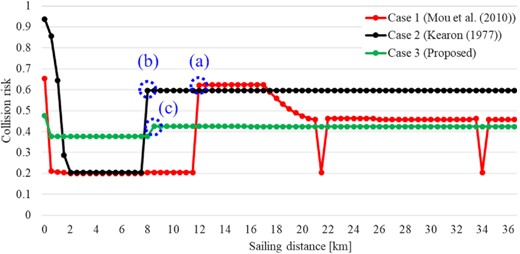
History of the CR value of each case in Scenario A.
As shown in Fig. 19a, the CR value increased discontinuously and severely at a sailing distance of 12 km in Case 1. The situation of Fig. 19a is shown in Fig. 20. The target ship, with an MMSI of 440 102 960, which is highlighted by the red circle, was the most dangerous ship with a CR value of 0.622. Although the target ship was moving away from the own ship with TCPA = 0, the situation was determined to be dangerous in Case 1. It is observed that the non-risky ship tends to have a high CR value in Case 1.
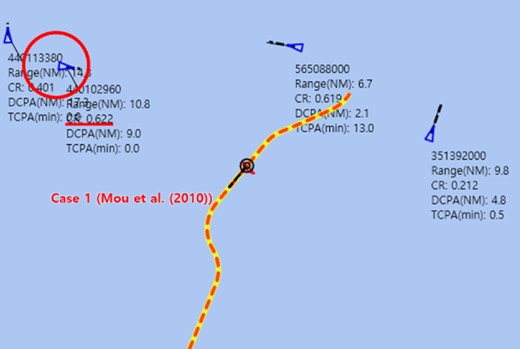
The situation at the sailing distance of 12 km (Fig. 19a) in Case 1.
As shown in Fig. 19b, the CR value increased rapidly at a sailing distance of 7.5 km in Case 2. The situation of Fig. 19b is shown in Fig. 21. The own ship turned to the port side at 7.5 km to avoid the ship with an MMSI of 440 102 960. As the route of the own ship changed, the TCPA of the ship with an MMSI of 351 392 000 that is highlighted by the red circle decreased, and the CR value increased unreasonably although this ship moved away from the own ship. Since the proposed method calculated the CR value in the form of negative exponential functions, this value did not increase unreasonably in Case 3.
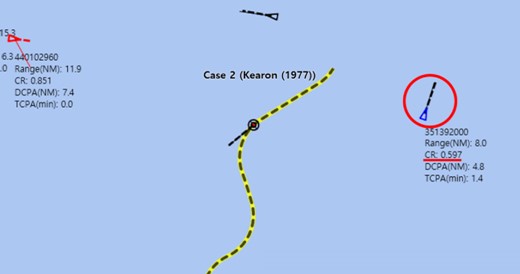
The situation at the sailing distance of 7.5 km (Fig. 19b) in Case 2.
As shown in Fig. 19c, the CR value increased stably at a sailing distance of 8.5 km in Case 3, unlike Fig. 19a and b. The situation of Fig. 19c is shown in Fig. 22. As shown in Fig. 22, the CR values of the ships, which were the most dangerous in Fig. 19a and b, were calculated reasonably low. Since both ships with an MMSI of 440 102 960 and 351 392 000 were moving away from the own ship, the proposed method calculated the CR values considering the heading angle between the ships based on the value of Fangle in equation (11).
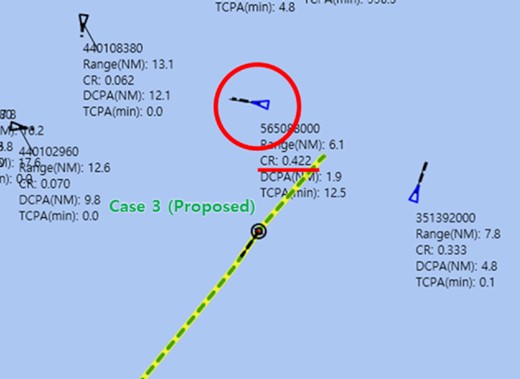
The situation at the sailing distance of 8.5 km (Fig. 19 c) in Case 3.
Table 5 summarizes the simulation results for Scenario A.
Simulation results for each case in Scenario A.
Simulation results for each case in Scenario A.
Given that the CR is calculated by adding the square terms in Case 2, it has an excessively high maximum value of 0.93. All cases resulted in discontinuous CR due to the discontinuity of the AIS data; however, Cases 1 and 2 had more discontinuities due to the limitations of the method for calculating CR. Case 3, using the proposed method, yielded the most realistic result. Compared to Case 1, the maximum CR for Case 2 increased by 43.0%, and the sailing distance decreased by 0.7%. Case 3 decreased the maximum CR by 26.2% and the sailing distance by 5.0%. As shown in Table 5, Case 1 generated a route with the longest sailing distance, and Case 2 resulted in the highest maximum CR. The proposed method resulted in the lowest maximum CR and the shortest distance.
The result for each case in Scenario B is shown in Fig. 23. This scenario is more complicated than Scenario A because the sailing distance is longer and includes a waypoint, and more ships are in the vicinity of the own ship.
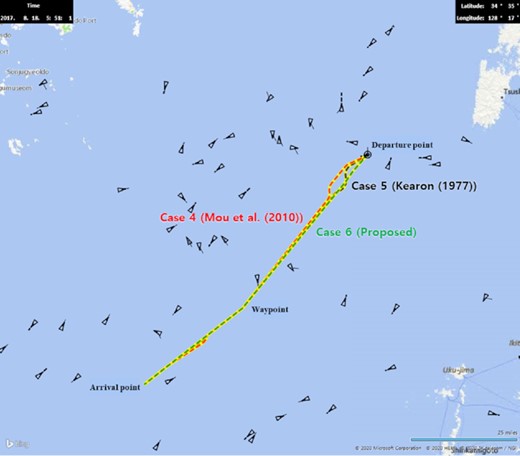
Routes for collision avoidance of each case in Scenario B.
Figure 24 shows the history of the CR values for target ships depending on the sailing distance in Scenario B.
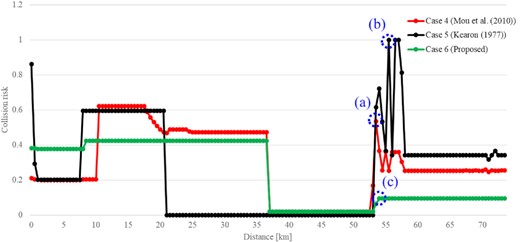
History of the CR value of each case in Scenario B.
As shown in Fig. 24a, the CR value increased discontinuously and severely at a sailing distance of 53 km for Case 4. The situation of Fig. 24a is shown in Fig. 25. The target ship with an MMSI of 4400 013 880, which is highlighted by the red circle, is a settled ship. However, in the approach by Mou et al. (2010) in Case 4, the settled ship was not considered. Since the value of Fangle in Case 4 was high and unstable even for the settled ship, the CR value of the settled ship was high and unstable although there was no possibility of collision.
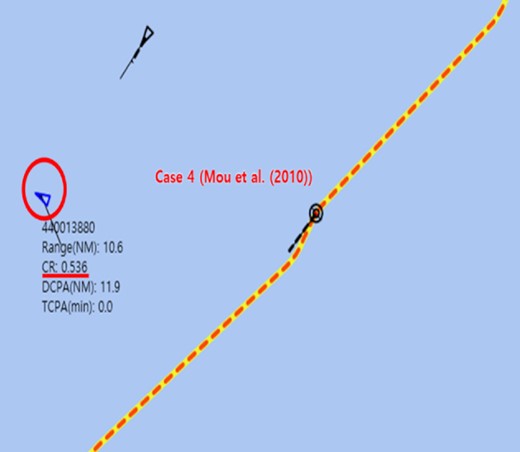
The situation at the sailing distance of 7.5 km (Fig. 24a) in Case 4.
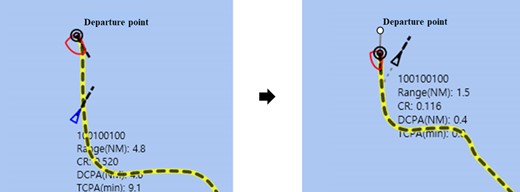
As shown in Fig. 24b, the CR value increased rapidly at a sailing distance of 55.5 km in Case 5. As shown in Fig. 26, since the own ship turned to the port side, the TCPA of the ship with an MMSI of 667 001 602 that is highlighted by the red circle decreased, and the CR value increased unreasonably. Given that Kearon’s (1977) method in Case 5 calculates the CR using equation (1), there was an issue wherein the CR increased significantly for the situation shown in Fig. 26 although both DCPA and TCPA are small.
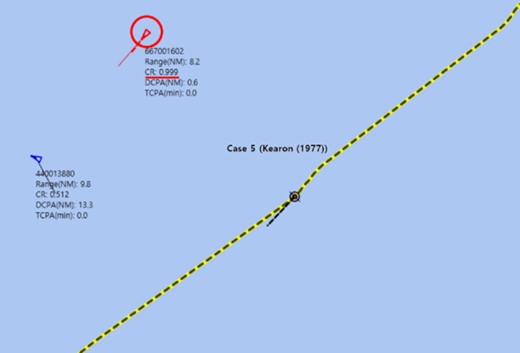
The situation for the sailing distance of 55.5 km (Fig. 24b) in Case 5.
As shown in Fig. 24c, the CR value increased stably at a sailing distance of 54.0 km in Case 6, unlike Fig. 24a and b. As shown in Fig. 27, the ships of an MMSI 440 013 880 and 667 001 602 were settled ships or ships moving away from the own ship. The proposed method defined the Fangle for settled ships or ships moving away as 1; therefore, the proposed method calculated the CR value reasonably low.
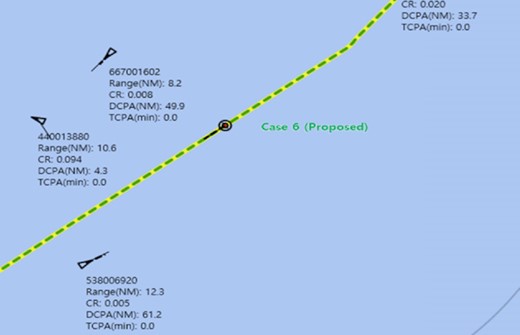
The situation for the sailing distance of 54.0 km (Fig. 24c) in Case 6.
Table 6 summarizes the simulation results for Scenario B.
Simulation results of each case in Scenario B.
| Case | Methods for calculating the CR | Departure point | Waypoint | Arrival point | Maximum CR | Sailing distance (km) |
|---|---|---|---|---|---|---|
| Case 4 | Mou et al. (2010) | (128.74N, 34.01E) | (128.24N, 33.50E) | (127.83N, 33.23E) | 0.54 (+0.0%) (normalized) | 112.1 (+0.0%) |
| Case 5 | Kearon (1977) | 0.99 (+83.3%) (normalized) | 112.0 (−0.1%) | |||
| Case 6 | This study | 0.42 (−22.2%) | 110.2 (−1.7%) |
As shown in Table 6, collisions were successfully avoided in all the cases. High CR values were calculated due to the ship’s approach to the rear of the own ship after 50 km. The maximum CR values of Cases 4 and 5 were 22.2% and 135.7% higher than those of Case 6, respectively. The sailing distances in Case 6 were 1.7% and 1.6% lower than those in Cases 4 and 5, respectively. Based on these applications, the characteristics of each method for calculating the CR could be confirmed. Compared to the previous methods, the calculation of CR for relatively non-risky ships (settled ships and ships moving away) was improved and implemented in more realistic situations. As a result, the proposed method could generate routes with the lowest maximum CR and the shortest sailing distance for the selected scenarios.
7. Conclusions and Future Works
For safe and efficient navigation, the assessment of the CR of other ships is essential. There have been various attempts to calculate CR using the ship domain and CPA in prior studies. However, there were several limitations to these studies. For example, the ship domain method does not facilitate the quantitative assessment of CR, and the CPA-based method cannot reliably guarantee collision avoidance. In previous studies, the CR value was also overestimated in some non-risky situations, and was unstable depending on the change in the heading of other ships. This study proposed an improved method for the quantitative calculation of the CR in ship navigation that combines the advantages of two methods: the ship domain method and the CPA-based method.
Prior studies on the ship domain had limited applications under certain conditions, such as specific areas or limited manoeuvring performance. We proposed a generalized ship domain considering ship speed and manoeuvring performance. The manoeuvring of the ship was simulated to avoid collisions, and a practical ship domain that guarantees collision avoidance was defined. This domain was used as the standard to calculate CR from 0 to 1. CR was calculated using DCPA and TCPA with the factor Fangle that expressed the relative heading angle between the own ship and the other ship. The improvement of the factor Fangle in this study mitigated the issues of discontinuous CR and overestimation of the CR for non-risky ships. As a result of the collision avoidance simulation based on actual AIS data, collision avoidance was successfully performed, and the proposed method reduced the sailing distance by up to 5.0% and the maximum CR by up to 26.2% compared to previous studies.
In this study, collision avoidance routes were generated using an isometric grid-based greedy algorithm. We expect that a suitable avoidance route generation method will be proposed in future studies by comparing and applying the proposed approach to various avoidance route generation methods (Lee et al., 2018, 2021; Man et al., 2020; Selma et al., 2020). Also, we will evaluate the collision avoidance method for multiple scenarios using more varied AIS data.
Acknowledgment
This work is an expansion of our previous study (Ha et al., 2018, 2019, 2020) and was partially supported by (a) Samsung Heavy Industries Co., Ltd., (b) Research Institute of Marine Systems Engineering of Seoul National University, Republic of Korea, and (c) Institute of Engineering Research of Seoul National University, Republic of Korea.
Conflict of interest statement
None declared.
