


ABSTRACT
This study aims to evaluate the causal effect of sodium‐glucose cotransporter 2 (SGLT2) inhibition on bone mineral density (BMD), osteoporosis, and fracture risk using genetics. Two‐sample Mendelian randomization (MR) analyses were performed utilizing two sets of genetic variants as instruments (six and two single‐nucleotide polymorphisms [SNPs]) associated with SLC5A2 gene expression and glycated hemoglobin A1c levels. Summary statistics of BMD from the Genetic Factors for Osteoporosis consortium (BMD for total body, n = 66,628; femoral neck, n = 32,735; lumbar spine, n = 28,498; forearm, n = 8143) and osteoporosis (6303 cases, 325,717 controls) and 13 types of fracture (≤17,690 cases, ≤328,382 controls) data from the FinnGen study were obtained. One‐sample MR and genetic association analyses were conducted in UK Biobank using the individual‐level data of heel BMD (n = 256,286) and incident osteoporosis (13,677 cases, 430,262 controls) and fracture (25,806 cases, 407,081 controls). Using six SNPs as the instrument, genetically proxied SGLT2 inhibition showed little evidence of association with BMD of total body, femoral neck, lumbar spine, and forearm (all p ≥ 0.077). Similar results were observed using two SNPs as instruments. Little evidence was found for the SGLT2 inhibition effect on osteoporosis (all p ≥ 0.112) or any 11 major types of fracture (all p ≥ 0.094), except for a nominal significance for fracture of lower leg (p = 0.049) and shoulder and upper arm (p = 0.029). One‐sample MR and genetic association analysis showed that both the weighted genetic risk scores constructed from the six and two SNPs were not causally associated with heel BMD, osteoporosis, and fracture (all p ≥ 0.387). Therefore, this study does not support an effect of genetically proxied SGLT2 inhibition on fracture risk. © 2023 The Authors. Journal of Bone and Mineral Research published by Wiley Periodicals LLC on behalf of American Society for Bone and Mineral Research (ASBMR).
Introduction
Sodium‐glucose cotransporter 2 (SGLT2) inhibitors are widely accepted oral hypoglycemic agents in type 2 diabetes patients.(1) These drugs have gained popularity in recent years because of their beneficial impact on glycemic control and cardiovascular and kidney outcomes.(2‐6) Despite these apparent benefits, the effects of SGLT2 inhibitors on bone mineral metabolism and fracture risk attracted much attention and have been underexplored.
The previous reports from clinical trials showed controversial findings. In the CANVAS (Canagliflozin Cardiovascular Assessment Study), which included 4330 type 2 diabetes patients, with a median follow‐up of 195.9 weeks, the rate of all fractures was higher in canagliflozin treatment (a dose of 300 or 100 mg) than placebo (16.9 versus 10.9 participants with fracture per 1000 patient‐years; hazard ratio [HR] = 1.55; 95% confidence interval [CI] 1.21–1.97).(3) Canagliflozin has been linked to increased bone turnover markers and decreased hip bone mineral density (BMD) in older patients with type 2 diabetes.(7) However, this risk was not observed in other trials with canagliflozin, including the CANVAS‐R (Canagliflozin Cardiovascular Assessment Study‐Renal) and the CREDENCE (Canagliflozin and Renal Events in Diabetes with Established Nephropathy Clinical Evaluation).(4) Additionally, in trials evaluating the effects of other SGLT2 inhibitors, such as dapagliflozin,(5,8) empagliflozin,(6,9) and ertugliflozin,(10) no significant increased risk of bone fractures was reported. In real‐world studies, treatment with SGLT2 inhibitors showed a similar fracture or fall risk compared with other hypoglycemic drugs currently in use, such as dipeptidyl peptidase 4 (DPP‐4) inhibitors,(11‐15) sulphonylurea,(16) and glucagon‐like peptide 1 (GLP‐1) receptor agonists.(17‐19)
Although meta‐analyses of randomized controlled trials (RCTs) and observational studies have also shown that the overall risk was not increased in SGLT2 inhibitor users,(20‐25) these results do not eliminate concerns about the potential increased risk of fractures caused by SGLT2 inhibitors in clinical practice. The findings from the observational studies may be limited by confounding factors and not long enough follow‐up duration. RCTs are crucial in establishing a causal relationship between SGLT2 inhibitors and bone health outcomes. However, conducting RCTs to investigate the long‐term effects of drugs on outcomes with low incidence rate could be challenging and costly.
Therefore, more evidence is required to evaluate whether a causal relationship between SGLT2 inhibitors and bone fracture exists. Mendelian randomization (MR) is an alternative approach to overcoming these challenges.(26) MR is a genetic epidemiological method that utilizes genetic variants as instrumental variables to investigate the causal relationship between exposure and outcome. By using genetic variants as proxies for the exposure of interest, MR can provide unbiased estimates of causality and overcome some of the limitations of traditional observational studies. Drug‐target MR is an extension of MR using genetic variants that simulate the pharmacological inhibition of drug‐target genes.(27) New methods, such as genetic colocalization(28) and expression quantitative trait loci (eQTLs) (genetic variants associated with drug target mRNA expression),(29‐31) can be used to create reliable MR instruments for drug exposure.
In the present analysis, we aim to investigate the causal relationship between genetically proxied SGLT2 inhibition and bone health–related outcomes, including BMD, osteoporosis, and bone fractures using two‐sample drug‐target MR. We also conducted the one‐sample MR and genetic association analyses using the individual‐level data in UK Biobank as a validation. The findings from this study may provide reliable evidence of the long‐term effects of SGLT2 inhibition on bone health, which could inform clinical decision‐making.
Materials and Methods
Study design
Figure 1 illustrates the design of this study. We aimed to evaluate the causal role of SGLT2 inhibition on bone health using a two‐sample drug‐target MR approach and one‐sample MR together with the genetic association analysis. First, we selected two sets of genetic variants that were proxies of the effect of SGLT2 inhibition. Three bone health–related outcomes, including BMD, osteoporosis, and bone fracture, were then selected. The generalized inverse variance‐weighted (IVW) approach was used as the primary method, with several sensitivity analyses, including generalized MR‐Egger, weighted median, simple mode, and weighted mode method, conducted to validate the results. Second, we performed the one‐sample MR and genetic association analyses in participants with heel BMD or incident cases of osteoporosis and fractures in the UK Biobank to validate the findings in the two‐sample MR.
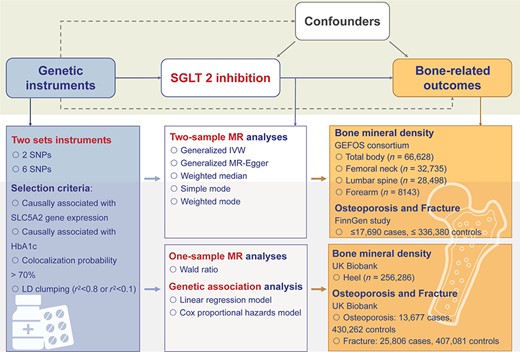
Study design. We conducted two‐sample Mendelian randomization (MR) analyses of the effect of SGLT2 inhibition on bone health–related outcomes. Two sets of genetic variants were selected as proxies of the effect of SGLT2 inhibition. Bone health–related outcomes, including bone mineral density, osteoporosis, and bone fracture, were selected as outcomes. Summary data of exposure and outcomes were obtained from related meta‐analyses of genomewide association analyses. The generalized inverse variance‐weighted approach was applied as the primary method to estimate the causal effect on selected outcomes. Several sensitivity analyses were conducted. We also conducted one‐sample MR and genetic association analyses using the UK Biobank individual‐level data to validate our results in two‐sample MR. BMD = bone mineral density; GEFOS = Genetic Factors for Osteoporosis; IVW = inverse variance weighted; LD = linkage disequilibrium; SGLT2 = sodium‐glucose cotransporter 2; SNP = single‐nucleotide polymorphism.
Selection and validation for genetic predictors of SGLT2 inhibition
To generate genetic instruments that can proxy the lifelong glucose‐lowering effect of SGLT2 inhibition, we used a four‐step instrument selection pipeline that has been previously described.(31,32) First, genetic variants within a ± 250Kb window of the SLC5A2 gene (the target gene for SGLT2 inhibition) were selected and associated with the mRNA expression level of the SLC5A2 gene in one or more of the 50 tested tissues (p < 0.001, a significance level in a genomic region) using data from Genotype‐Tissue Expression (GTEx, n ≤ 706)(33) and eQTLGen consortium (whole blood, n ≤ 31,684).(34) Second, the association of each SLC5A2 variant with HbA1c level was estimated as an indicator of glucose‐lowering effect via SGLT2 inhibition, which was used as proxies in some previous anti‐diabetic drug target MR studies,(35,36) and only variants that show regional‐wide association with HbA1c (p value <1 × 10⁻⁴) were selected using data from a subgroup of unrelated individuals of European ancestry without diabetes in the UK Biobank (n = 344,182). Third, genetic colocalization was used to validate whether the expression of SLC5A2 and HbA1c share the same causal variant in the SLC5A2 region (a genetic colocalization probability >0.7 was used as the evidence of colocalization).(28,37) Finally, a standard clumping process was conducted using correlation among variants <0.8 as the threshold to remove variants with very high correlation and remained six single‐nucleotide polymorphisms (SNP), or <0.1 permitting the variants to be in weak linkage disequilibrium (LD), which is a commonly used pairwise squared correlation between nearby variants for drug target MR,(38) and remained two SNPs. After these selection steps, two sets of genetic variants were selected as instruments of SGLT2 inhibition (Supplemental Table S1).
Study outcomes
The primary outcomes include BMD, osteoporosis, and fractures. For the following MR analysis, we leveraged the summary statistics derived from relevant genomewide association studies (GWAS) for these outcomes. The summary data of BMD were obtained from Genetic Factors for Osteoporosis (GEFOS) consortium (BMD for total body, n = 66,628; femoral neck, n = 32,735; lumbar spine, n = 28,498; forearm, n = 8,143).(39,40) The summary data of osteoporosis (6303 cases, 325,717 controls) and 13 types of fracture, including osteoporosis with pathological fracture (1433 cases), fracture of lower leg (17,690 cases), forearm (17,201 cases), shoulder and upper arm (10,273 cases), wrist and hand level (9950 cases), rib, sternum, and thoracic spine (7845 cases), femur (7671 cases), foot (6548 cases), skull and facial bones (6051 cases), lumbar spine and pelvis (5364 cases), and neck (1288 cases), were obtained from the FinnGen study(41) (Supplemental Table S2).
Statistical analysis
MR analyses of SGLT2 inhibition and BMD, osteoporosis, and fracture risk
The summary data of the genetic associations of the six‐ or two‐instrument SNPs were looked up and extracted from the GWAS for the respective outcome and harmonized to ensure that the effect of an SNP on the exposure and outcome corresponding to the same allele before conducting causal estimation. We used the generalized inverse variance weighted (IVW) method(42) to increase the power of the analysis. This method takes into account the correlation between the two or six genetic predictors of SGLT2 inhibition, which allowed for a relaxed clumping threshold. An LD matrix was obtained for each pair of variants in the 1000 Genomes data set, and the IVW method was used to estimate the MR effect while considering the LD matrix of genetic variants. All MR estimates were scaled to standard deviation (SD) unit to reflect the equivalent of a one SD unit (0.62%) reduction in HbA1c. We calculated the statistical power of our analyses by utilizing an online tool (https://shiny.cnsgenomics.com/mRnd/). The findings indicate that our analyses possess more than 80% power when the β value for SLGT2 inhibition on BMD surpasses −0.25 or the odds ratio on osteoporosis or fracture exceeds 1.5, except for the fracture at neck because of the small sample size of cases.
Validation of MR assumptions and sensitivity analyses
Reports of the study findings were according to the STROBE‐MR (Strengthening the Reporting of Mendelian Randomization Studies) guidelines.(43) The three critical key assumptions of MR were tested through a set of sensitivity analyses. The relevance assumption was validated by estimating the strength of the genetic predictors using R2 and F‐statistics. F‐statistics above 10 was considered as the evidence against weak instrument bias. The exclusion restriction assumption was tested using several sensitivity analyses, including MR‐Egger regression, weighted median analysis, and simple and weighted mode analyses. Cochran's Q test was used to estimate the heterogeneity between instruments.
One‐sample MR and genetic association analysis in UK Biobank
To corroborate results in two‐sample MR, we conducted one‐sample MR and genetic association analysis using individual‐level data from UK Biobank. Weighted genetic risk scores (wtGRS) for six and two SNPs were constructed respectively for each participant in UK Biobank weighted by their effect size (β) for HbA1c. We first conducted one‐sample MR analyses using wtGRS of SGLT2 inhibition. We then performed genetic association analysis of wtGRS with heel BMD at baseline (n = 256,286). Heel BMD is assessed using ultrasound measurements of the calcaneus. The estimation of BMD is based on the Quantitative Ultrasound Index, which is derived by combining measurements of the speed of sound and broadband ultrasound attenuation (https://biobank.ndph.ox.ac.uk/showcase/refer.cgi?id=100248). We also performed genetic association analysis of wtGRS with the risk of incident osteoporosis or fracture (13,677 osteoporosis and 25,806 fracture cases followed up for an average of 11.8 years). In detail, after excluding participants with osteoporosis or fracture at baseline, the remaining participants were followed up and new‐onset osteoporosis or fractures were recorded from electronic medical records. Osteoporosis and fracture were defined based on the occurrence of one or more International Classification of Disease, 10th Revision (ICD10) codes (Supplemental Table S3). Cox proportional hazard models were used to evaluate the associations between wtGRS and the risk of incident osteoporosis or fracture. The models adjusted for age, sex, genotype measurement batch, assessment center, and the top 10 genetic principal components. We further conducted stratification analyses according to age (≥ 60 versus <60 years), sex, type 2 diabetes, and chronic kidney disease status.
All the analyses were performed on the SAS (version 9.4, SAS Institute, Cary, NC, USA) and R platform (version 4.2.1). The “TwoSampleMR,” “Mendelian Randomization” packages were used for statistical analyses.
For all analyses, Bonferroni corrections were applied to establish multiple testing‐adjusted thresholds, which are 0.013 (0.05/4) in the analysis of BMD and 0.004 (0.05/14) in the analysis of osteoporosis and fracture.
The study protocol was approved by the Institutional Review Board of Ruijin Hospital affiliated to the Shanghai Jiao Tong University School of Medicine and the UK Biobank scientific committee (project number 64754). UK Biobank study obtained informed consent from the study participants and approval from its institutional review board.
Results
Strength of the genetic predictors for SGLT2 inhibition
The characteristics of two sets of instruments (two variants: rs9930811and rs35445454; six variants: rs4488457, rs8057326, rs11865835, rs9930811, rs34497199, and rs35445454) used to proxy pharmacological targets of SGLT2 are listed in Supplemental Table S1. Both sets of instruments showed strong strength F‐statistics = 34.0 or 24.1, which were over the common threshold of 10, suggesting that weak instrument bias is unlikely to be an issue in this study.
Effect of genetically proxied SGLT2 inhibition on BMD
Genetically proxied SGLT2 inhibition using six SNPs as the instrument showed little evidence of association with BMD of total body (β 0.08, 95% CI −0.48–0.65, p = 0.770), femoral neck (β −0.63, 95% CI −1.32, 0.07, p = 0.077), lumbar spine (β −0.11, 95% CI −1.05, 0.84, p = 0.824), and forearm (β 0.76, 95% CI −0.58, 2.10, p = 0.265) (Fig. 2). The analyses using two SNPs as the instrument yield similar results (Fig. 2). The heterogeneity test using the Cochran Q test for IVW and the pleiotropy test using the MR‐Egger intercept term implied little evidence of existence of heterogeneity or directional pleiotropy (Supplemental Table S4).
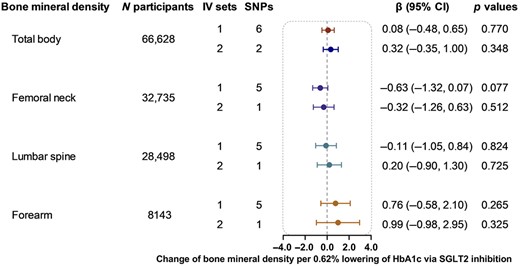
Causal effect of genetically proxied SGLT2 inhibition on bone mineral density. Data are presented as the change of bone mineral density per 0.62% (6.75 mmol/mol) reduction of HbA1c via SGLT2 inhibition estimated by the generalized inverse variance weighted method. CI = confidence interval; IV = instrumental variable; SGLT2 = sodium‐glucose cotransporter 2; SNP = single‐nucleotide polymorphism.
The sensitivity analyses, including MR‐Egger, weighted median, and simple and weighted mode analyses, also showed little evidence of the association between genetically proxied SGLT2 inhibition and BMD (Supplemental Table S4).
Effect of genetically proxied SGLT2 inhibition on osteoporosis and fractures
Using six SNPs as instrumental variables, we did not detect the causal effect of genetically proxied SGLT2 inhibition on osteoporosis or any of the 13 fracture subtypes (Fig. 3). Among the 14 outcomes examined using two SNPs as instruments, genetically proxied SGLT2 inhibition was merely nominally associated with a higher risk of fracture of lower leg (β 1.24, 95% CI 0.01, 2.47, p = 0.049) and shoulder and upper arm (β 1.78, 95% CI 0.19, 3.38, p = 0.029), but the results did not pass the multiple testing (threshold p = 0.004) (Fig. 3).
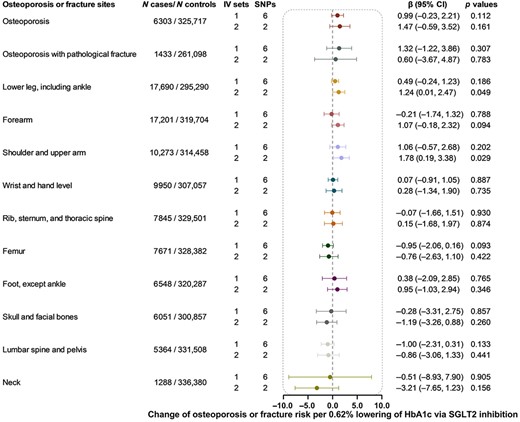
Causal effect of genetically proxied SGLT2 inhibition on osteoporosis and fracture. Data are presented as the change of osteoporosis or fracture risk per 0.62% (6.75 mmol/mol) reduction of HbA1c via SGLT2 inhibition estimated by generalized inverse variance weighted method. CI = confidence interval; IV = instrumental variable; SGLT2 = sodium‐glucose cotransporter 2; SNP = single‐nucleotide polymorphism.
The heterogeneity test showed no heterogeneity for all analyses except for the analysis of genetically proxied SGLT2 inhibition on fracture of forearm and foot (except ankle) (p = 0.001). The MR‐Egger intercept term test showed little evidence of directional pleiotropy (p ≥ 0.053) (Supplemental Table S5). In the sensitivity analyses, most results were nonsignificant, except for the effect of genetically proxied SGLT2 inhibition on the fracture of shoulder and upper arm (β 1.97, 95% CI 0.67, 3.27, p = 0.003 in the weighted median method).
One‐sample MR and genetic association analysis in UK Biobank
The wtGRS of SGLT2 inhibition constructed from six or two SNPs was not significantly associated with heel BMD either for the one‐sample MR or the association analysis (Table 1). After a mean of 11.8 years of follow‐up, 13,677 osteoporosis and 25,806 fracture cases were recorded. No significant associations between the wtGRSs and osteoporosis or fracture risk were found (Table 1).
The One‐Sample MR and Genetic Associations Between Genetically Proxied SGLT2 Inhibition and Bone Health Outcomes in General Population
| Stratification factor | wtGRS | Heel bone mineral density | Osteoporosis | Fracture | |||||||
| N participants | β (95% CI) | p Values | N cases/N controls | HR (95% CI) | p Values | N cases/N controls | HR (95% CI) | p Values | |||
| One‐sample MR | |||||||||||
| Total | 6 SNPs | 256,286 | −0.13 (−1.19, 0.94) | 0.867 | 13,677/430,262 | 0.46 (0.01, 23.46) | 0.762 | 25,806/407,081 | 0.28 (0.02, 4.78) | 0.408 | |
| 2 SNPs | −0.16 (−1.17, 0.85) | 0.820 | 1.51 (0.03, 65.20) | 0.885 | 0.42 (0.03, 5.71) | 0.565 | |||||
| Genetic association analyses | |||||||||||
| Total | 6 SNPs | 256,286 | 0.03 (−0.24, 0.31) | 0.809 | 13,677/430,262 | 1.23 (0.44, 3.39) | 0.696 | 25,806/407,081 | 1.39 (0.66, 2.92) | 0.387 | |
| 2 SNPs | 0.02 (−0.11, 0.15) | 0.756 | 0.95 (0.59, 1.52) | 0.831 | 1.12 (0.79, 1.58) | 0.516 | |||||
| Age (years) | <60 | 6 SNPs | 145,029 | −0.11 (−0.48, 0.26) | 0.553 | 4061/242,965 | 1.83 (0.28, 11.92) | 0.527 | 11,304/229,756 | 1.66 (0.54, 5.09) | 0.378 |
| 2 SNPs | −0.05 (−0.22, 0.12) | 0.595 | 0.92 (0.39, 2.18) | 0.842 | 1.28 (0.76, 2.16) | 0.350 | |||||
| ≥60 | 6 SNPs | 98,122 | 0.23 (−0.23, 0.68) | 0.324 | 8864/165,919 | 1.10 (0.31, 3.89) | 0.885 | 13,144/157,109 | 1.13 (0.40, 3.20) | 0.815 | |
| 2 SNPs | 0.12 (−0.09, 0.33) | 0.268 | 1.00 (0.56, 1.79) | 0.990 | 1.01 (0.63, 1.64) | 0.959 | |||||
| Sex | Men | 6 SNPs | 117,088 | 0.08 (−0.38, 0.55) | 0.726 | 2268/201,082 | 0.46 (0.04, 5.61) | 0.544 | 9426/187,912 | 0.52 (0.15, 1.77) | 0.295 |
| 2 SNPs | 0.03 (−0.19, 0.24) | 0.804 | 0.61 (0.19, 1.95) | 0.405 | 0.85 (0.48, 1.49) | 0.563 | |||||
| Women | 6 SNPs | 139,228 | −0.03 (−0.36, 0.30) | 0.858 | 11,409/229,180 | 1.49 (0.49, 4.56) | 0.481 | 16,380/219,169 | 2.46 (0.97, 6.26) | 0.058 | |
| 2 SNPs | 0 (−0.15, 0.16) | 0.962 | 1.04 (0.62, 1.74) | 0.883 | 1.33 (0.86, 2.04) | 0.197 | |||||
| T2D | Yes | 6 SNPs | 11,106 | −0.49 (−2.12, 1.14) | 0.553 | 675/18,798 | 0.49 (0, 47.99) | 0.760 | 1609/17,282 | 4.30 (0.22, 86.07) | 0.340 |
| 2 SNPs | −0.01 (−0.77, 0.74) | 0.972 | 0.62 (0.07, 5.27) | 0.664 | 0.90 (0.22, 3.58) | 0.877 | |||||
| No | 6 SNPs | 245,180 | 0.06 (−0.23, 0.34) | 0.694 | 13,002/411,444 | 1.26 (0.44, 3.59) | 0.662 | 24,197/389,779 | 1.27 (0.59, 2.73) | 0.540 | |
| 2 SNPs | 0.02 (−0.11, 0.15) | 0.757 | 0.96 (0.59, 1.56) | 0.876 | 1.12 (0.79, 1.60) | 0.516 | |||||
| CKD | Yes | 6 SNPs | 17,018 | 0.47 (−0.63, 1.57) | 0.399 | 1208/30,316 | 0.10 (0, 3.03) | 0.187 | 2045/27,574 | 0.20 (0.01, 2.74) | 0.228 |
| 2 SNPs | 0.23 (−0.28, 0.73) | 0.378 | 0.24 (0.05, 1.16) | 0.075 | 0.66 (0.20, 2.21) | 0.500 | |||||
| No | 6 SNPs | 239,268 | 0.004 (−0.28, 0.29) | 0.979 | 12,469/401,046 | 1.55 (0.53, 4.52) | 0.419 | 23,761/379,507 | 1.64 (0.76, 3.56) | 0.210 | |
| 2 SNPs | 0.01 (−0.13, 0.14) | 0.934 | 1.08 (0.66, 1.78) | 0.747 | 1.17 (0.82, 1.68) | 0.381 | |||||
Note: Weighted genetic risk scores were constructed for UK Biobank participants using the genetic instruments weighted based on their effect size for HbA1c. Linear regression and Cox proportional hazard models were used to evaluate the effect estimates of SGLT2 inhibition on heel bone mineral density and osteoporosis and incident fracture risk, respectively.
Abbreviation: CI = confidence interval; CKD = chronic kidney disease; HR = hazard ratio; T2D = type 2 diabetes; wtGRS = weighted genetic risk score.
We further stratified the participants according to age (<60 or ≥60 years), sex, and the presence of type 2 diabetes and chronic kidney disease. No significant association between genetically proxied SGLT2 inhibition and BMD, osteoporosis, or fracture risk was detected either (Table 1).
Discussion
In the present large‐scale MR and genetic association study, using the currently available comprehensive genetic data for bone density, osteoporosis, and fracture, we did not observe a causal effect of genetically proxied SGLT2 inhibition on BMD, osteoporosis, and fracture risk.
The results of clinical trials to study whether SGTL2 inhibitors increase fracture risk showed controversial results. The main evidence supporting an increased risk comes from the CANVAS study, which included 4330 participants with type 2 diabetes, of whom 350 experienced fracture events during follow‐up.(3) However, no increased risk of fracture was observed in the CANVAS‐R, a CANVAS‐like clinical trial, which included 5812 participants and 146 participants with fracture events during follow‐up.(3) A previous study attempted to determine why the CANVAS and CANVAS‐R showed different effects on fracture risk(44) by evaluating differences in baseline characteristics, randomized treatment interactions with participant characteristics, dose effects, duration of follow‐up, metabolic effects, and adverse events related to falls between these above two highly similar trials. However, the study yielded the conclusion that there was no evidence to clearly explain the heterogeneity in fracture risk between the two studies.(44) Considering the null result for fracture risk in the CREDENCE trial, which included 4401 participants and 135 participants with fracture events during follow‐up, the researchers speculated the observed association in CANVAS might be a chance finding.(4,44) In other clinical trials of SGLT2 inhibitors, including DECLARE (Dapagliflozin Effect on Cardiovascular Events) (17,160 patients, 897 participants with fracture events during follow‐up),(5) the EMPA‐REG‐OUTCOME (BI 10773 [Empagliflozin] Cardiovascular Outcome Event Trial in Type 2 Diabetes Mellitus Patients) (7020 participants, 183 participants with fracture events during follow‐up),(6) and VERTIS CV (Evaluation of Ertugliflozin Efficacy and Safety Cardiovascular Outcomes Trial) (8246 participants, 201 participants with fracture events during follow‐up),(10) the risk of fracture in the intervention group was comparable to that in the placebo group. These results suggest that SGLT2 inhibition is unlikely to increase fracture risk.(45) However, one concern is that clinical trials usually suffer from limitations such as a small number of cases or short intervention or follow‐up periods. The MR study design representing lifetime manipulation of the SGLT2 inhibitor's targets may partially compensate for these deficiencies.
In observational studies, the relative fracture risk for SGLT2 inhibitors was compared with other hypoglycemic drugs currently in use, such as DPP‐4 inhibitors,(11‐15) sulphonylurea,(16) and GLP‐1 receptor agonists,(17‐19) and most studies yielded negative results.(46) Compared with observational studies, which may be subject to potential confounders and draw relative risks, the MR study is less likely to be affected by confounders and directly evaluate the causal effect of SGLT2 inhibition on fracture risk.
Notably, although our primary analysis provided little evidence to support the effects of genetically proxied SGLT2 inhibition on BMD, osteoporosis, and most of the types of fracture, we observed a putative association between genetically proxied SGLT2 inhibition and fracture of shoulder and upper arm, although the results did not pass the multi‐testing threshold. This association was not reported in previous investigations. Only a nested case–control study involving 210,042 type 2 diabetes patients found that those using SGLT2 inhibitors had a similar risk of shoulder and upper arm fractures as those using other non‐insulin antidiabetic drugs.(47) Therefore, attention needs to be paid to the effect of SGLT2 inhibitor use on site‐specific fractures in clinical practice. Besides, further analyzing fracture data at different sites in previous clinical trials may help to clarify the relationship between SGLT2 inhibitors and fracture risk.
Several limitations should be acknowledged. First, our MR analysis estimated the effect of SGLT2 inhibition based on on‐target reductions in HbA1c levels rather than the direct effects of SGLT2 inhibitors. This is based on the assumption that the effect of SGLT2 inhibition on HbA1c levels is proportional to its overall impact, which may not be consistent with the actual mechanism of SGLT2 inhibition. Additionally, pharmaceutical formulation, dosage, and administration of SGLT2 inhibitors can all affect their impact on fracture risk. These factors should be taken into account when interpreting the results of our study. Second, we did not conduct validation analyses using independent outcomes data in two‐sample MR analyses. However, we used the largest data of bone‐related outcomes currently available and employed various sensitivity analyses to assess the robustness of our findings. Additionally, we utilized one‐sample MR analyses with individual‐level data from the UK Biobank as a complementary method to support our main findings. The large sample size data and independent validation analysis may satisfy the statistical power to achieve a robust finding. Third, to mitigate the risk of obtaining negative results in our analyses due to insufficient statistical power, we conducted power calculations. Although we ensured adequate statistical power for most outcomes, we acknowledged the potential concern of insufficient statistical power for specific outcomes, particularly the fracture at the neck, due to its small sample size. Therefore, it is still essential to validate our findings through larger sample sizes and increased case numbers, especially for the low‐incidence fracture outcomes. Lastly, our analysis was primarily performed in European populations. Thus, caution should be exercised to generalize the finding to other ethnic groups.
In conclusion, we did not identify the causal effect of genetically proxied SGLT2 inhibition on BMD, osteoporosis, and fracture risk. Existing genetic evidence does not support that SGLT2 inhibition leads to the increased risk of fracture and related bone health outcomes, which provides guiding suggestions on SGLT2 inhibitor use during clinical practice.
Acknowledgments
The authors thank all the participants of the UK Biobank. The UK Biobank study was approved by the National Health Service National Research Ethics Service (ref. 11/NW/0382), and all participants provided written informed consent. We thank the individual patients who provided the sample that made data available; without them, the study would not have been possible. The study also used GWAS summary data from the GEFOS consortium and the FinnGen study. We thank all the investigators who provided these data to support this study.
This work was funded by the National Natural Science Foundation of China (82270859, 81930021, 81970728, 91857205, and 82088102) and the Shanghai Municipal Education Commission–Gaofeng Clinical Medicine Grant Support (20152508 Round 2). MX, YB, and WW are members of an innovative research team of high‐level local universities in Shanghai. The study sponsors were not involved in the design of the study; the collection, analysis, and interpretation of data; writing the report; and did not impose any restrictions regarding the publication of the report.
Author Contributions
Huajie Dai: Conceptualization; methodology; formal analysis; writing – original draft; writing – review and editing; data curation; visualization. Longyi Zheng: Conceptualization; data curation; formal analysis; writing – original draft; methodology. Zheng Zhu: Data curation; formal analysis; writing – original draft; visualization; methodology. Xin Geng: Conceptualization; writing – review and editing; methodology. Tianzhichao Hou: Writing – review and editing; data curation; methodology. Qi Wang: Writing – review and editing; data curation. Yijie Zhu: Writing – review and editing. Hong Lin: Writing – review and editing. Shuangyuan Wang: Writing – review and editing. Ruizhi Zheng: Writing – review and editing. Zhiyun Zhao: Writing – review and editing. Mian Li: Writing – review and editing. Jieli Lu: Writing – review and editing. Yu Xu: Writing – review and editing. Tiange Wang: Writing – review and editing. Jianmin Liu: Writing – review and editing. Guang Ning: Writing – review and editing; funding acquisition. Weiqing Wang: Writing – review and editing; funding acquisition. Yufang Bi: Writing – review and editing; funding acquisition. Jie Zheng: Conceptualization; writing – review and editing; methodology. Min Xu: Conceptualization; methodology; data curation; formal analysis; supervision; funding acquisition; writing – original draft; writing – review and editing; project administration.
Data Availability Statement
UK biobank individual level data are available from the UK Biobank (http://biobank.ndph.ox.ac.uk/showcase/) (Application number: 64754). GWAS summary data for bone mineral density from GEFOS consortium is available at http://www.gefos.org/. GWAS summary data for osteoporosis and fracture from FinnGen study is available at https://www.finngen.fi/en/access_results.
Disclosures
All authors declare that there are no relationships or activities that might bias, or be perceived to bias, their work.
References
Author notes
HD, LZ, ZZhu, and XG are joint first authors.
