


Abstract
Although the impact of sex hormones on bone metabolism is well‐documented, effect of their primary modulator, sex hormone‐binding globulin (SHBG), remains inconclusive. This study aims to elucidate the genetic overlap between SHBG and heel estimated bone mineral density (eBMD), a widely‐accepted tool for osteoporosis management and fracture risk assessment. Using summary statistics from large‐scale genomewide association studies conducted for SHBG (N = 370,125), SHBG adjusted for body mass index (SHBGa, N = 368,929), and eBMD (N = 426,824), a comprehensive genomewide cross‐trait approach was performed to quantify global and local genetic correlations, identify pleiotropic loci, and infer causal associations. A significant overall inverse genetic correlation was found for SHBG and eBMD (rg = −0.11, p = 3.34 × 10⁻¹⁰), which was further supported by the significant local genetic correlations observed in 11 genomic regions. Cross‐trait meta‐analysis revealed 219 shared loci, of which seven were novel. Notably, four novel loci (rs6542680, rs8178616, rs147110934, and rs815625) were further demonstrated to colocalize. Mendelian randomization identified a robust causal effect of SHBG on eBMD (beta = −0.22, p = 3.04 × 10⁻¹³), with comparable effect sizes observed in both men (beta = −0.16, p = 1.99 × 10⁻⁶) and women (beta = −0.19, p = 2.73 × 10⁻⁹). Replacing SHBG with SHBGa, the observed genetic correlations, pleiotropic loci and causal associations did not change substantially. Our work reveals a shared genetic basis between SHBG and eBMD, substantiated by multiple pleiotropic loci and a robust causal relationship. Although SHBG has been implicated in preventing and screening aging‐related diseases, our findings support its etiological role in osteoporosis. © 2023 The Authors. Journal of Bone and Mineral Research published by Wiley Periodicals LLC on behalf of American Society for Bone and Mineral Research (ASBMR).
Introduction
Osteoporosis, characterized by low bone mineral density (BMD), is a complex metabolic endocrine disorder that causes substantial health and socioeconomic burdens.(1‐3) Although a protective role of sex hormones (ie, estrogen and testosterone) in the pathogenesis of osteoporosis has been well‐established,(4‐7) the effect of sex hormone‐binding globulin (SHBG), a protein modulating both the concentration and bioavailability of sex hormones,(8) remains inconclusive. To date, epidemiological studies have been conducted to investigate the relationship between SHBG and BMD/osteoporosis.(9‐12) However, the results have been inconsistent, with some studies reporting significant associations(10) whereas others have not.(12) The observed discrepancies may be attributed to variations in study design and population, as well as limitations of observational settings, including the potential influence of reverse causality and environmental confounders.
Linking phenotypic data through genetics can at least overcome one drawback of conventional observational design, reverse causality, and with prudent design, can also reduce bias and confounding.(13) As a highly heritable and polygenic trait, the single‐nucleotide polymorphism (SNP)‐based heritability of SHBG has been reported by a recent genomewide association study (GWAS) to be around 20% (658 genomewide significant loci).(14) Representing a widely‐accepted tool for osteoporosis management and fracture risk assessment,(15) heel estimated BMD (eBMD) is the most heritable among all sites, with an estimated SNP‐based heritability of approximately 38% (1103 genomewide significant loci).(15)
Utilizing genetic variants (SNPs) as instrumental variables (IVs),(13) three Mendelian randomization (MR) studies have been conducted to evaluate the underlying causal relationship between SHBG and eBMD.(16‐18) Leveraging 10 IVs for SHBG, Arathimos and colleagues(16) conducted a two‐sample MR in 105,633 participants and found a detrimental effect of elevated SHBG on bone density (beta = −2.81; 95% confidence interval [CI] = −4.14 to −1.49), in line with results from another two‐sample MR using 11 IVs for SHBG in 394,929 participants with eBMD (beta = −0.09; 95% CI = −0.12 to −0.06).(17) Wang and colleagues(18) conducted the latest two‐sample MR using more than 20‐fold increased number of IVs for SHBG (N = 250) in 426,824 male participants and reported a comparable association (beta = −0.14; 95% CI = −0.19 to −0.10).
Despite a potential causal link supported by these studies, several major gaps remain to be addressed. First, the largest GWAS of SHBG to date has identified an even larger number of IVs for both overall and sex‐specific populations, emphasizing the need for a timely update. Second, current MR studies typically adopt a univariable design, which rarely accounts for important confounders such as obesity (ie, body mass index [BMI] and waist‐to‐hip ratio [WHR]) – both have been implicated in the development of osteoporosis, as well as in endocrine biological function including SHBG.(11,19) Third, MR fails to capture pleiotropy meaning a variant having independent effects on both traits, which provides essential etiological implications in addition to causality.(20) By comparing the results of single‐trait GWAS, five common loci at genomewide significance can be immediately recognized as shared by SHBG and eBMD, indicating the potential to discovery additional yet unrevealed pleiotropic loci when data are jointly evaluated with improved statistical power.(21)
Hence, leveraging summary statistics from large‐scale GWASs and cutting‐edge approaches in the genetics field, we aim to perform a genomewide cross‐trait analysis(22) to expand on previous MR findings and explore pleiotropic effects underlying SHBG and eBMD. We first quantified a shared genetic basis between SHBG and eBMD, and then discovered pleiotropic loci affecting both traits; we eventually implemented a bidirectional two‐sample MR to make causal inference. The overall study design is presented in Fig. 1.

Flowchart of overall study design in European ancestry individuals. eBMD = heel estimated bone mineral density; GWAS = genomewide association study; SHBG = sex hormone‐binding globulin; SHBGa = sex hormone‐binding globulin adjusted for body mass index.
Materials and Methods
Data summary
The hitherto largest GWAS of SHBG was conducted by Ruth and colleagues,(14) analyzing up to 370,125 white European participants from UK Biobank (UKB). SHBG levels were collected from blood sample at each participant's initial visit. To account for the confounding effect of BMI, additional adjustment on BMI (SHBGa) was performed in 368,929 participants. Sex‐specific analyses were also performed (SHBG: Nmen = 180,726, Nwomen = 189,473; SHBGa: Nmen = 180,094, Nwomen = 188,908). The original article reported independent SHBGa‐associated SNPs reaching a p value threshold of 5.0 × 10⁻⁸, which we retrieved and used as IVs for SHBGa in MR analysis. Because trait‐associated SNPs were not reported for SHBG, we therefore identified genomewide significant independent SHBG‐associated SNPs using PLINK's clumping function (parameters: clump‐p1 = 5e−8, clump‐p2 = 1e−5, clump‐r2 = 0.001, clump‐kb = 1000),(23) and used those SNPs as IVs for SHBG in MR analysis. The full sets of GWAS summary statistics for both SHBG and SHBGa were also downloaded.
The hitherto largest GWAS of eBMD was conducted by Morris and colleagues,(15) consisting of 426,824 white European participants from UKB. eBMD was assessed by quantitative ultrasound speed of sound and broadband ultrasound attenuation. GWAS p value threshold was set at 6.6 × 10⁻⁹. We obtained significant eBMD‐associated SNPs as IVs, along with the full set summary statistics.
Details of included GWASs can be found in Table S1. Descriptions of IVs for SHBG, SHBGa, and eBMD can be found in Tables S8–S10.
Statistical Analysis
Genetic correlation analysis
Genetic correlation (rg) represents an average sharing of genetic effect between two traits that is independent of environmental confounders. We adopted cross‐trait linkage disequilibrium score regression (LDSC) to quantify the global genetic correlation between SHBG and eBMD.(24) LDSC relies on the fact that the GWAS effect size estimate for a given SNP incorporates the effects of all SNPs in linkage disequilibrium (LD) with that SNP. Genetic correlation ranges between −1 and +1 with signs specifying direction. We used precalculated HapMap3 LD scores computed from ~1.2 million common SNPs in European ancestry, commonly acknowledged as well‐imputed. A Bonferroni‐corrected p value (p < 0.05/2, where 2 is the number of SHBG traits) was used to define statistical significance.
We also conducted local genetic correlation analysis using SUPERGNOVA.(25) This algorithm partitions the whole genome into approximately 2353 LD‐independent regions with an average length of 1.6 centimorgans and quantifies genetic correlation confined to each genomic region. A Bonferroni‐corrected p‐value (p < 0.05/2353) was used to define statistical significance.
Cross‐trait meta‐analysis
We conducted a cross‐trait meta‐analysis using cross‐phenotype association (CPASSOC) to identify pleiotropic loci affecting both SHBG and eBMD.(21) CPASSOC integrates GWAS summary statistics to test the association of each SNP with both traits, controlling for population structure and cryptic relatedness.(21) We calculated pairwise SHet based on a fixed‐effect model, a test statistic which is more powerful when heterogeneity exists.
We identified independent loci through PLINK's clumping function: ‐‐clump‐p1 5e‐8 ‐‐clump‐p2 1e‐5 ‐‐clump‐r2 0.01 ‐‐clump‐kb 500.(23) SNPs with the lowest p value within each independent loci were selected as index SNPs. Significant pleiotropic SNPs were defined as pCPASSOC <5.0 × 10⁻⁸ and psingle‐trait <1.0 × 10⁻⁵. These SNPs were further categorized into four groups. First, a “known” shared SNP, meaning a SNP reaching genomewide significance in both traits (pSHBG <5.0 × 10⁻⁸ and peBMD <6.6 × 10⁻⁹). Second, a “single‐trait‐driven” shared SNP, meaning a SNP reaching genomewide significance in one of the two traits (either pSHBG <5.0 × 10⁻⁸ or peBMD <6.6 × 10⁻⁹). Third, a “LD‐tagged” shared SNP, meaning a SNP, despite not reaching genomewide significance in any single trait (pSHBG >5.0 × 10⁻⁸ and peBMD >6.6 × 10⁻⁹), was in LD (r2‐threshold = 0.2) with index SNPs (or any SNP located within 1.0 Mb around the index SNPs) already identified by single‐trait GWAS(s). Finally, a “novel” shared SNP, which we were particularly interested in, defined as a SNP that did not reach genomewide significance in single trait nor was in LD with previously identified SHBG‐associated or eBMD‐associated SNPs.
Ensembl Variant Effect predictor (VEP)(26) and 3DSNP(27) were used to map these SNPs to genes.
Colocalization analysis
Because an index SNP is very unlikely to be a causal SNP, we further performed a colocalization analysis using Coloc(28) to probe whether shared loci colocalized at the same causal variant. Coloc requires only SNP summary statistics and follows a Bayesian framework to derive five easily interpretable posterior probabilities relating to five hypotheses: H0 (no causal variant); H1 and H2 (causal variant for only one trait); H3 (two causal variants), and H4 (a joint causal variant). A large posterior probability for H4 (PP4) suggests a colocalization result. A shared locus identified by CPASSOC was considered colocalized if PP4 was greater than 0.70.
Mendelian randomization analysis
We conducted a comprehensive bidirectional two‐sample MR analysis to assess the causal relationship between SHBG and eBMD.(29) First, variance of exposure explained by IVs (R2) and F‐statistics were calculated. IVs with F‐statistics <10 were considered weak instruments and excluded from analysis. We then tested a causal effect of SHBG on eBMD followed by a reverse‐direction MR as well as a MR‐Steiger test to confirm directionality. Inverse variance weighted (IVW) approach(29) was employed as the main analysis, complemented by weighted median method,(30) MR‐Egger regression,(31) and MR‐PRESSO(32) as sensitivity analyses. We repeated IVW excluding pleiotropic SNPs determined through GWAS catalog(33) or palindromic SNPs with strand ambiguity to evaluate the robustness of results. We also conducted a leave‐one‐out analysis to examine if single outlying SNP drove the association. A significant causal effect was considered if p value in IVW was below 0.05 and effect estimates maintained directional consistency across various methods. To evaluate if causal association was biased by sample overlap, we implemented Causal Analysis Using Summary Effect Estimates (CAUSE), a MR method not influenced by sample overlap.(34) Furthermore, we implemented a multi‐variable MR (MVMR) analysis(35) to evaluate a direct SHBG‐eBMD causal relationship unconfounded by body weight, BMI, or WHR. All analyses were performed in both overall population and sex‐specific subgroups.
Results
Global and local genetic correlations
We observed a significant genetic overlap between SHBG and eBMD. Using LDSC, we identified a significant inverse genomewide genetic correlation of SHBG with eBMD that survived Bonferroni correction (rg = −0.11, p = 3.34 × 10⁻¹⁰) (Fig. 2A). Although this correlation remained pronounced, both the magnitude and the significance reduced to some extent (~50%) when BMI was adjusted for (rg = −0.06, p = 7.77 × 10⁻⁵) (Fig. 2B), indicating a nontrivial role of BMI on the relationship between SHBG and eBMD.

Global and local genetic correlations between SHBG and eBMD. (A) Manhattan‐style plot of local genetic correlation between SHBG and eBMD with global genetic correlation obtained by LDSC shown on upper left. Red dots represent loci showing significant local genetic correlation after multiple testing adjustment (p < 0.05/2353), same below. (B) Manhattan‐style plot of local genetic correlation between SHBGa and eBMD with global genetic correlation obtained by LDSC shown on upper left. eBMD = heel estimated bone mineral density; rg = genetic correlation; SE = standard error; SHBG = sex hormone‐binding globulin; SHBGa = sex hormone‐binding globulin adjusted for body mass index.
Partitioning the whole genome into specific regions, we detected 11 significant local signals for SHBG and eBMD via SUPERGNOVA (Fig. 2A, Table S2). The most significant signal was located at 19p13.3 (chr19: 1,922,476–2,815,372, p = 2.12 × 10⁻¹⁸), which harbors plentiful genes including DOT1L, associated with both osteoarthritis and osteoporosis,(36,37) and THOP1, associated with SHBG.(38) Replacing SHBG with SHBGa, nine out of the 11 local signals were successfully replicated with the most significant signal located at, again, 19p13.3 (p = 1.39 × 10⁻¹⁷) (Fig. 2B, Table S3). Intriguingly, five new significant local signals were identified, reinforcing a crucial role of BMI in the SHBG‐eBMD relationship.
Cross trait meta‐analysis and pleiotropic loci
Motivated by the significant global and local genetic correlations, we next performed a cross‐trait meta‐analysis to detect pleiotropic loci. Utilizing CPASSOC, a total of 219 significant pleiotropic loci were identified, most of which were “single‐trait‐driven” shared loci (N = 117, 53.42%), or “known” shared loci (N = 69, 31.51%) (Fig. 3A and 3C, Table S4). The most significant locus was rs28929474 (pCPASSOC = 1.25 × 10−225), a “single‐trait‐driven” shared locus mapped to SERPINA1, a gene associated with both SHBG and eBMD.(39,40)
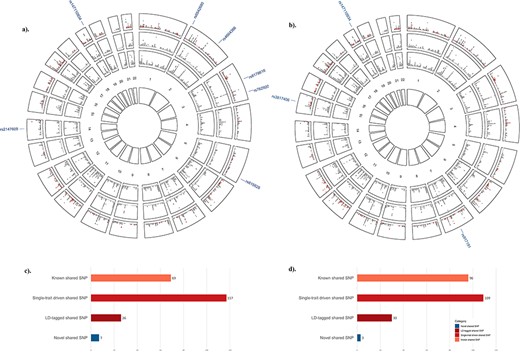
Cross‐phenotype association between SHBG and eBMD. (A) Circular Manhattan plot between SHBG and eBMD. The outermost circle shows the cross‐trait meta‐analysis results between SHBG and eBMD; from the periphery to the center, each circle shows the GWAS results on SHBG and eBMD, respectively. The dark gray indicates variants with genomewide significance (pSHBG <5.0 × 10⁻⁸ or peBMD <6.6 × 10⁻⁹) whereas the light gray indicates variants with p value above the genomewide significance threshold. SNPs are divided into four different categories according to their single‐trait and cross‐trait characteristics. A “known” shared SNP is a SNP reaching genomewide significance in both single‐trait GWASs (pSHBG <5.0 × 10⁻⁸ and peBMD <6.6 × 10⁻⁹) and expectedly with pCPASSOC <5.0 × 10⁻⁸; a “single‐trait‐driven” shared SNP is a SNP reaching genomewide significance in one single‐trait GWAS (pSHBG <5.0 × 10⁻⁸ or peBMD <6.6 × 10⁻⁹) and with pCPASSOC <5.0 × 10⁻⁸; a “LD‐tagged” shared SNP is a SNP not reaching genomewide significance in neither single‐trait GWASs (pSHBG >5.0 × 10⁻⁸ and peBMD >6.6 × 10⁻⁹) and with pCPASSOC <5.0 × 10⁻⁸, but in LD with index SNPs (or any SNP located within 1.0 Mb around the index SNPs) already identified by single‐trait GWAS(s); a “novel” shared SNP is a SNP not reaching genomewide significance in neither single‐trait GWASs but psingle‐trait <5.0 × 10⁻⁵ and pCPASSOC <5.0 × 10⁻⁸, and not in LD with previously identified SHBG‐associated or eBMD‐associated SNPs. These four types of SNPs are presented in orange, light red, dark red, and dark blue, respectively, and their RS IDs are listed. Same below. (B). Circular Manhattan plot between SHBGa and eBMD. (C) Bar plot of significant pleiotropic loci between SHBG and eBMD. (D) Bar plot of significant pleiotropic loci between SHBGa and eBMD. eBMD = heel estimated bone mineral density; LD = linkage disequilibrium; SHBG = sex hormone‐binding globulin; SHBGa = sex hormone‐binding globulin adjusted for body mass index.
Out of these 219 shared loci, seven were classified as novel pleiotropic loci (Table 1). The most significant novel locus was rs815625 (pCPASSOC = 5.89 × 10⁻¹³) mapped to MFAP3, a gene closely related to BMI.(41,42) The second most significant novel locus was rs8178616 (pCPASSOC = 8.29 × 10⁻¹³) mapped to PROS1, a gene associated with 3‐HMPMA levels in smokers.(43) The third most significant novel locus was rs147110934 (pCPASSOC = 8.32 × 10⁻¹³) located near NAT14, reported to affect WHR,(19) and ZNF628, associated with appendicular lean mass, height, fat‐free mass and other anthropometric traits.(40,44,45)
Novel pleiotropic loci between SHBG and eBMD (PCPASSOC < 5 × 10⁻⁸ & 5 × 10⁻⁸ < Psingle‐trait < 1 × 10⁻⁵)
| eBMD | SHBG | ||||||||||
| SNP | Chr:Position | A1 | A2 | BETA | p | BETA | p | pcpassoc | Genes within clumping range | Gene symbola | PP4b |
| SHBG and eBMD | |||||||||||
| rs147110934 | 19:55993436 | G | T | −0.028 | 2.00 10−6 | 0.016 | 9.30 10−8 | 8.32 10−13 | COX6B2,FAM71E2,IL11,ISOC2,MIR6805,NAT14,RPL28,SHISA7,SSC5D,SUV420H2,TMEM190,TMEM238,UBE2S,ZNF628 | NAT14, ZNF628 | 0.83 |
| rs2147609 | 14:58846979 | A | G | 0.007 | 7.50 10−6 | −0.004 | 1.50 10−6 | 5.64 10−11 | ACTR10,ARID4A,FLJ31306,KIAA0586,PSMA3,TIMM9,TOMM20L | RP11‐517O13.3 | 0.34 |
| rs4664366 | 2:161600547 | A | G | 0.011 | 2.00 10−7 | −0.004 | 6.10 10−6 | 3.88 10−12 | MIR4785,RBMS1 | ‐ | 0.30 |
| rs6542680 | 2:3640142 | C | T | −0.011 | 2.10 10−6 | 0.006 | 1.20 10−6 | 1.03 10−11 | ‐ | COLEC11 | 0.95 |
| rs7629202 | 3:160169197 | T | C | −0.008 | 8.80 10−6 | −0.004 | 8.40 10−6 | 3.61 10−10 | ARL14,C3orf80,IFT80,IL12A‐AS1,KPNA4,MIR15B,MIR16‐2,SCARNA7,SMC4,TRIM59 | TRIM59, RP11‐227J5.3, RP11‐432B6.3 | 0.27 |
| rs815625 | 5:153493151 | C | T | 0.009 | 1.70 10−7 | −0.005 | 1.20 10−6 | 5.89 10−13 | FAM114A2,GALNT10,GRIA1,MFAP3 | MFAP3 | 0.72 |
| rs8178616 | 3:93632889 | G | T | 0.010 | 2.50 10−7 | −0.005 | 1.10 10−6 | 8.29 10−13 | ARL13B,DHFRL1,NSUN3,PROS1,STX19 | PROS1 | 0.90 |
| SHBGa and eBMD | |||||||||||
| rs147110934 | 19:55993436 | G | T | −0.028 | 2.00 10−6 | 0.013 | 3.30 10−7 | 9.42 10−12 | COX6B2,FAM71E2,IL11,ISOC2,MIR6805,NAT14,RPL28,SHISA7,SSC5D,SUV420H2,TMEM190,TMEM238,UBE2S,ZNF628 | NAT14, ZNF628 | 0.76 |
| rs3817406 | 15:56721875 | A | G | −0.009 | 1.50 10−6 | 0.004 | 4.00 10−6 | 7.04 10−11 | MNS1,RFX7,TEX9 | MNS1, TEX9 | 0.29 |
| rs917191 | 7:80570871 | G | C | −0.008 | 4.20 10−6 | 0.004 | 1.50 10−7 | 1.09 10−11 | Intergenic region | SEMA3C | 0.84 |
Chr = chromosome; eBMD = heel estimated bone mineral density; SHBG = sex hormone‐binding globulin; SHBGa = sex hormone‐binding globulin adjusted for body mass index; SNP = single nucleotide polymorphism.
Gene symbol mapped by VEP.
Posterior probability for H4 (a joint causal variant) from colocalization analysis.
When the effect of BMI was removed from SHBG, CPASSOC identified a total of 238 significant pleiotropic loci between SHBGa and eBMD (Fig. 3B and 3D, Table S5), of which three loci were novel (Table 1). Among these 238 pleiotropic loci, a majority (N = 149/218, 68.35%) were either identical with (N = 108) or in LD with (r2 > 0.60, N = 41) the loci underlying SHBG and eBMD.
Colocalization of pleiotropic loci
We used coloc to prioritize candidate causal variants by calculating the posterior probabilities for five hypotheses of all CPASSOC‐identified loci (Tables S6 and S7). Out of the 219 significant pleiotropic loci, 75 loci (34.25%) showed a PP4 above 0.70, indicating evidence that the two associations are likely driven by the same underlying signal. SNP rs76895963 was the only variant reaching a PP4 of 1, and was a “known” shared locus.
Among the seven novel pleiotropic loci (Table 1), four were colocalized, namely rs815625 (PP4 = 0.72), rs147110934 (PP4 = 0.83), rs8178616 (PP4 = 0.90), and rs6542680 (PP4 = 0.95). SNP rs6542680, with the highest PP4, was located near gene COLEC11, a gene associated with multiple blood proteins and lipoprotein cholesterol levels.(46,47)
Mendelian randomization and causal relationship
We initially assessed the strength of IVs and confirmed all IVs had F‐statistics greater than 10, indicating strong instruments (Tables S8–S10). Employing a bidirectional MR framework, we confirmed a causal effect of SHBG on eBMD where one standard deviation (SD) increment of genetically predicted SHBG was associated with a 0.22‐SD decrease of eBMD (IVW beta = −0.22, 95% CI = −0.28 to −0.16, p = 3.04 × 10⁻¹³) (Fig. 4A). The effect, despite attenuated slightly in sex‐specific analysis, remained statistically significant and comparable for both men (IVW beta = −0.16, 95% CI = −0.22 to −0.09, p = 1.99 × 10⁻⁶) (Fig. 4C) and women (IVW beta = −0.19, 95% CI = −0.25 to −0.13, p = 2.73 × 10⁻⁹) (Fig. 4E). Adjustment of BMI did not alter the results substantially (IVW for overall: beta = −0.15, p = 2.12 × 10⁻⁹; men: beta = −0.15, p = 9.00 × 10⁻⁷; women: beta = −0.14, p = 1.26 × 10⁻⁶) (Fig. 4B, 4D, and 4F), consistent with results of MVMR adjusting for WHR and body weight (Fig. S1), indicating a causal role of SHBG on eBMD independent of obesity. All results derived from IVW were further supported by the weighted median approach, the MR‐Egger regression and MR‐PRESSO as well as the sensitivity analyses excluding pleiotropic or palindromic SNPs (Fig. 4). Leave‐one‐out analysis did not identify outlying SNPs (Fig. S2). Results of CAUSE (Table S12) were consistent with our main MR analysis, indicating negligible consequences induced by sample overlap. On the other hand, reverse causality was not supported by MR‐Steiger test (causal direction of SHBG to eBMD: all steiger p < 0.001). Despite a modest effect of genetically predicted eBMD on SHBG, it disappeared when controlling for BMI (Fig. S3).
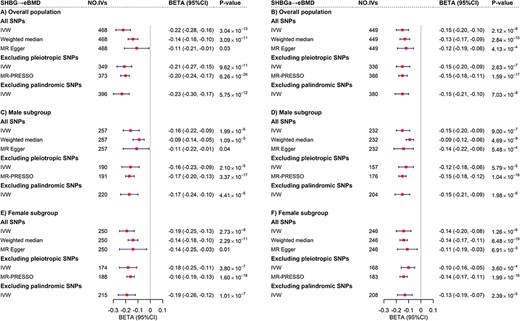
Mendelian randomization analysis between SHBG and eBMD. (A) Estimates of causal effect for genetically predicted SHBG on eBMD in overall population. (B) Estimates of causal effect for genetically predicted SHBGa on eBMD in overall population. (C) Estimates of causal effect for genetically predicted SHBG on eBMD in male subgroup. (D) Estimates of causal effect for genetically predicted SHBGa on eBMD in male subgroup. (E) Estimates of causal effect for genetically predicted SHBG on eBMD in female subgroup. (F) Estimates of causal effect for genetically predicted SHBGa on eBMD in female subgroup. The red boxes denote point estimates of the causal effects, and the error bars denote 95% CIs. IVW was adopted as primary analysis. Weighted median, MR Egger and MR‐PRESSO were adopted as sensitivity analysis. CI = confidence interval; eBMD = heel estimated bone mineral density; IVW = inverse variance weighting; SHBG = sex hormone‐binding globulin; SHBGa = sex hormone‐binding globulin adjusted for body mass index.
Discussion
Leveraging the hitherto largest GWASs of SHBG and eBMD, our study comprehensively elucidates the genetic relationship between these two traits. We discovered a considerable shared genetic architecture, manifested by both pleiotropy (demonstrated by cross‐trait meta‐analysis) and causality (demonstrated by MR). In addition to confirming a causal relationship that was independent of sex and obesity, our study identified multiple pleiotropic loci for the first time. Findings advance our understanding of the interplay between SHBG and eBMD, shedding novel light on a critical role of SHBG in the etiology of osteoporosis.
The SHBG‐eBMD genetic overlap has been explored to some extent by several small‐scale studies using a candidate gene‐based approach.(48‐50) With a rather small sample size (N = 213 ~ 2971), these studies focused exclusively on the SHBG gene or its closely nearby genomic regions where statistical significance can be anticipated as moderate effects are promised in these regions. Although these studies have uncovered that polymorphisms in confined genomic regions were significantly associated with both SHBG and BMD, they were unable to detect association signals in other genomic regions with relatively small effects, nor quantify the average genetic correlation across the entire genome. In contrast, our current study remarkably expands on previous results by utilizing genomewide genetic information measured in hundreds of thousands of participants to quantify an unbiased shared genetic basis with greatly improved statistical power. Overall, a modest but significant SHBG‐eBMD genetic correlation ( = −0.11) was found, which was further supported by multiple local shared signals, collectively highlighting a moderate shared genetic basis.
Genetic overlap underlying two traits originates from pleiotropy, causality, or both. We demonstrate here that the considerable SHBG‐eBMD genetic overlap is attributable to both pleiotropy and causality. Through cross‐trait meta‐analysis, our study before all else emphasizes the pleiotropic effect. We identified a total of 219 pleiotropic loci, of which seven were “novel”, meaning they were not detected by previous single‐trait analysis and thus brought new insights into the common etiology. Here, we highlight four candidate causal variants (rs147110934, rs8178616, rs815625, and rs6542680) shared by SHBG with eBMD, and confirmed colocalization. SNP rs147110934, the only “novel” variant successfully replicated by BMI‐adjusted SHBG, was mapped to two genes, ZNF628 and NAT14. ZNF628 encodes zinc finger protein 628, a transcription factor functioning in cell growth, differentiation and development,(51) whereas NAT14 encodes Klp1, a protein of the N‐acetyltransferase family.(52) At a first glance, neither of these two genes is directly related to hormones or bone health, yet studies have suggested that ZNF628 is a risk gene for Alzheimer's disease(53) and regulates spermiogenesis in mice,(54) whereas the N‐acetyltransferase protein family is responsible for catalyzing N‐acetylaspartate synthesis supporting neurologic health, all of which are age‐related degenerative diseases or processes. SNP rs8178616 was mapped to PROS1, a gene encoding protein S, a vitamin K‐dependent plasma protein that regulates coagulation and inflammatory processes.(55) Recent studies have found protein S contributes to bone homeostasis by negatively regulating osteoblast differentiation.(56) SNP rs815625 is located near MFAP3, encoding microfibrillar‐associated protein 3 (MFAP3), which regulates microfibril assembly, elastinogenesis, tissue homeostasis, and tumor progression.(57) Although the role of MFAP3 in SHBG or bone metabolism remains unclear, other members of the same family (ie, MFAP2) are found to affect progressive osteopenia.(57) SNP rs6542680 is located near COLEC11, encoding collectin‐11, a member of the collectin family that plays important role in innate immunity.(58) COLEC11 knockout mice were affected in bone metabolism, cardiology, metabolism, growth, and renal function.(59) One recent animal study confirmed a role of collectin‐11 in rheumatoid arthritis, a common autoimmune joint disease.(60) Follow‐up experimental studies are warranted to discover their functional roles in the SHBG‐eBMD relationship.
Although conventional observational studies have presented conflicting results, genetic studies, mainly MRs, have reached a consensus that an increased level of SHBG causally impairs BMD.(16‐18) Our MR findings were consistent with previous results but significantly extended them in three critical aspects. First, our study provides a more robust effect estimate by incorporating a markedly enlarged set of IVs, which substantially improves the accuracy and precision of MR analysis. Second, we examined the causal effect in a sex‐specific manner, which previous analyses did not have the opportunity to do. According to our results, SHBG appears to affect eBMD in men and women similarly. Despite limited evidence of sexual dimorphism, further studies are warranted to validate our findings, given that osteoporosis primarily affects women(1) and that the concentration of SHBG differs between men and women.(61) Third, by additionally investigating a BMI‐adjusted SHBG phenotype and by employing a comprehensive MVMR design, our work demonstrates a SHBG‐eBMD causal relationship independent of obesity. One might speculate that the causal effect of SHBG on eBMD was merely a result of regulating sex hormones. Nevertheless, we conducted a mediation MR analysis to test the effect mediated through bioavailable testosterone and identified a partial mediation effect (Table S11, proportion mediated = 58%, 95% CI = 33%–84%). In fact, studies have suggested that SHBG may act directly through membrane‐bound receptor (megalin receptor), resulting in various biological effects without the involvement of sex hormones,(11,62) reflecting more complex interplays between SHBG and eBMD that require further investigation.
BMI is an important biomarker of metabolic syndrome(63) that affects both SHBG and BMD. According to some studies, higher BMI is associated with higher BMD and a decreased risk of osteoporotic fracture.(64‐66) Thus, the confounding role of BMI or obesity on the SHBG‐BMD relationship needs to be carefully managed. Our study, however, demonstrated that the effect of BMI might be limited, as evidenced by the modest changes in the effect sizes of causal association, global genetic correlation as well as the number of pleiotropic loci when replacing crude SHBG with BMI‐adjusted SHBG. Our findings are consistent with several previous studies that have identified an unchanged association between SHBG and BMD after adjusting for BMI.(67) However, whether this is biologically plausible requires further investigation.
Our findings bear important public health as well as clinical implications. First, SHBG, a potential pathogenesis for osteoporosis, causally decreases BMD in both sexes. As such, it may be beneficial to expand screening for osteoporosis to a boarder group of individuals, including both men and women with potential SHBG‐increasing conditions, not limited to well‐established conditions like hyperthyroidism and liver dysfunction. Second, SHBG and BMD are two distinct traits linked through biological pleiotropy, which provides opportunities for “drug repositioning” meaning drugs developed for one disorder (ie, sex hormones) can be reassessed to tackle the other (ie, osteoporosis).(68) Third, interplays between SHBG and BMD are nearly unaffected by obesity, suggesting further preventions of osteoporosis be targeted towards the general population rather than just those who are obese.
Our study has several limitations. First, sample overlap was inevitable as genetic data of both traits involved UKB participants. However, the influence might be negligible because both LDSC and SUPERGNOVA are not affected by sample overlap(24,25) and CPASSOC can control cryptic relatedness which allows for overlap.(21) MR analysis may be biased due to sample overlap, but as demonstrated by our CAUSE analysis, this influence may not be substantial. Second, our analysis was solely performed on individuals of European ancestry, constraining the generalizability to other ethnic groups. Third, we only selected eBMD to proxy osteoporosis. Future studies investigating other body sites are needed to distinguish site‐specific effects. Fourth, although we mapped identified pleiotropic SNPs to genes using two approaches, the mapped genes are only relevant genes. Further studies are needed to identify the causal genes underlying the observed signals.
In conclusion, using a well‐established genomewide cross‐trait approach, our work advances previous understanding of the genetic relationship between SHBG and eBMD by quantifying an unbiased genetic correlation, identifying multiple pleiotropic loci and confirming a robust causal association. Our findings underscore the pleiotropic effect underlying these two inherently linked traits, as well as a causal mechanism independent of obesity, which may be valuable for future preventive strategies and drug development for osteoporosis.
Author Contributions
Yang Qu: Investigation; data curation; methodology; formal analysis; writing – original draft. Changfeng Xiao: Investigation; data curation; writing – review and editing. Xueyao Wu: Methodology; formal analysis; writing – review and editing. Jingwei Zhu: Formal analysis; writing – review and editing. Chenjiarui Qin: Software; visualization; writing – review and editing. Lin He: Writing – review and editing; visualization; software. Huijie Cui: Software; visualization; writing – review and editing. Li Zhang: Software; visualization; writing – review and editing. Wenqiang Zhang: Software; visualization; writing – review and editing; validation. Chunxia Yang: Funding acquisition; supervision. Yuqin Yao: Supervision; funding acquisition. Jiayuan Li: Funding acquisition; supervision. Zhenmi Liu: Funding acquisition; supervision. Ben Zhang: Supervision; funding acquisition. Wenzhi Wang: Conceptualization; supervision; writing – review and editing; funding acquisition. Xia Jiang: Conceptualization; funding acquisition; resources; writing – review and editing; supervision.
Acknowledgments
We are grateful to all investigators who shared genomewide summary statistics.
Peer Review
The peer review history for this article is available at https://www.webofscience.com/api/gateway/wos/peer‐review/10.1002/jbmr.4904.
Data Availability Statement
Data sharing is not applicable to this article as no new data were created or analyzed in this study.
Disclosures
The authors declare that they have no competing interests.
References
Author notes
WW and XJ contributed equally to this work.
