


Abstract
The choice of the calcium (Ca) source in pig diets and the addition of formic acid may affect the gastrointestinal inositol phosphate (InsP) degradation and thereby, phosphorus (P) digestibility in pigs. This study assessed the effects of different Ca sources (Ca carbonate, Ca formate), exogenous phytase, and chemical acidification on InsP degradation, nutrient digestion and retention, blood metabolites, and microbiota composition in growing pigs. In a randomized design, 8 ileal-cannulated barrows (24 kg initial BW) were fed 5 diets containing Ca formate or Ca carbonate as the only mineral Ca addition, with or without 1,500 FTU/kg of an exogenous hybrid 6-phytase. A fifth diet was composed of Ca carbonate with phytase but with 8 g formic acid/kg diet. No mineral P was added to the diets. Prececal InsP6 disappearance and P digestibility were lower (P ≤ 0.032) in pigs fed diets containing Ca formate. In the presence of exogenous phytase, InsP5 and InsP4 concentrations in the ileal digesta were lower (P ≤ 0.019) with Ca carbonate than Ca formate. The addition of formic acid to Ca carbonate with phytase diet resulted in greater (P = 0.027) prececal InsP6 disappearance (87% vs. 80%), lower (P = 0.001) InsP5 concentration, and greater (P ≤ 0.031) InsP2 and myo-inositol concentrations in the ileal digesta. Prececal P digestibility was greater (P = 0.004) with the addition of formic acid compared to Ca carbonate with phytase alone. Prececal amino acid (AA) digestibility of some AA was greater with Ca formate compared to Ca carbonate but only in diets with phytase (P ≤ 0.048). The addition of formic acid to the diet with Ca carbonate and phytase increased (P ≤ 0.006) the prececal AA digestibility of most indispensable AA. Exogenous phytase affected more microbial genera in the feces when Ca formate was used compared to Ca carbonate. In the ileal digesta, the Ca carbonate diet supplemented with formic acid and phytase led to a similar microbial community as the Ca formate diets. In conclusion, Ca formate reduced prececal InsP6 degradation and P digestibility, but might be of advantage in regard to prececal AA digestibility in pigs compared to Ca carbonate when exogenous phytase is added. The addition of formic acid to Ca carbonate with phytase, however, resulted in greater InsP6 disappearance, P and AA digestibility values, and changed ileal microbiota composition compared to Ca carbonate with phytase alone.
Lay Summary
The study aimed to investigate the effects of dietary calcium sources, exogenous phytase, and formic acid on inositol phosphate (InsP) degradation and nutrient digestibility in ileal-cannulated growing pigs. It also evaluated the concentrations of phosphorus, calcium, and myo-inositol in the blood, the composition of the microbiota in the ileal digesta and feces, and the concentrations of volatile fatty acids in the feces. Replacing calcium carbonate with calcium formate in the feed reduced prececal InsP6 disappearance and phosphorus digestibility. However, adding formic acid to a diet containing calcium carbonate and phytase enhanced prececal InsP6 disappearance and phosphorus digestibility, and increased InsP2 and myo-inositol concentrations in the ileal digesta. The dietary treatments resulted in more pronounced alterations of the microbiota in the feces than the ileal digesta. In ileal digesta, the shifts in relative abundance were primarily evident among low-abundant genera, while in feces, changes were observed in a larger number among genera with higher levels of abundance. The findings of this study suggest that calcium formate is not a suitable alternative to calcium carbonate for phosphorus digestibility in growing pigs. The release of phosphorus from InsP by exogenous phytase can be increased by adding formic acid.
Introduction
Phytate is the salt form of phytic acid (myo-inositol 1,2,3,4,5,6-hexakis (dihydrogen phosphate); InsP6) and is the main form of phosphorus (P) present in plant feed ingredients (Eeckhout and Paepe, 1994). Exogenous phytase is widely added to the diets of growing pigs, making InsP6-P more digestible and allowing for reduced addition or complete omission of feed phosphates in the diets for pigs. In contrast, calcium (Ca) always needs to be added to plant-based diets in mineral form. The most commonly used mineral Ca source is Ca carbonate from limestone.
Selle et al. (2009) hypothesized that standard dietary Ca concentrations may have a substantial negative effect on InsP6 degradation in the digestive tract. This was confirmed in growing pigs by Hu et al. (2023), who observed a significant decrease in prececal InsP6 disappearance and an increase in stomach pH with the addition of Ca carbonate to a mineral Ca-free diet. These findings suggest that additional Ca supplementation of the feed, particularly from limestone, can reduce InsP6 degradation by increasing stomach pH possibly impairing InsP6 hydrolysis by phytase in the stomach. The increase in stomach pH may also increase the formation of insoluble Ca-InsP6 complexes (Maenz et al., 1999), which additionally negatively affects the enzymatic InsP6-P release in pigs.
Replacing Ca carbonate with an alternative Ca source may be advantageous for an increased prececal InsP6-P release in pigs. Calcium formate, the Ca salt of formic acid, is characterized by its greater solubility and lower acid-binding capacity compared to Ca carbonate (Lawlor et al., 2005). Krieg et al. (2021) hypothesized that replacing Ca carbonate with Ca formate might help to prevent the pH in the gizzard of chicken from increasing due to the addition of Ca carbonate, thereby increasing prececal InsP6 degradation. In addition, the greater solubility of Ca formate compared to Ca carbonate might allow for a faster reduction of the intestinal concentration of Ca ions capable of forming insoluble Ca-InsP6 complexes. Besides the replacement of Ca carbonate with Ca formate, adding formic acid to a Ca carbonate-containing diet might also decrease the stomach pH. Kristofferson et al. (2021) observed a reduced stomach pH in pigs by formic acid addition, but such an effect on pH was not observed in the jejunum and ileum. Because of the relevance for the gastric pH and exogenous phytase being active mainly in the stomach of pigs, the choice of the Ca source and addition of formic acid could modulate the gastrointestinal InsP6 degradation.
Little is known about the effects of different dietary Ca sources on gut microbiota in pigs (Yang et al., 2022). Studies comparing the effects of Ca carbonate and Ca formate on microbial composition are lacking. Additionally, the effects of phytase supplementation have been inconsistent. Metzler-Zebeli et al. (2020) found that the relative abundances of several taxa in the feces were altered when phytase was supplemented to the feed, but Klein et al. (2023) could not observe any effect of phytase supplementation on the ileal and fecal microbiota of pigs.
The use of organic acid in the feed most likely inhibits the growth of harmful bacteria and maintains intestinal homeostasis (Luise et al., 2017). In a study on the longitudinal effect of formic acid supplementation (6.4 and 1.4 g/kg) in weaner pigs, the microbial community in the jejunum was only slightly affected. The high dose of formic acid in the feed resulted in increased microbial diversity compared to the unsupplemented feed. Few shifts in bacterial abundance were detected between supplemented and unsupplemented pigs. The supplementation led to an increase in Gemella and Lactobacillus (Luise et al., 2017). This was in contrast to the findings of Mroz et al. (2002), who associated a lower pH in the pig gut with the abundance of bacteria characterized by high acid resistance, e.g., lactic acid bacteria, and pointed out that the role of formic acid on the composition of the microbiota in pigs is not finally clarified.
The objectives of this study were to investigate the effects of dietary Ca source, exogenous phytase, and formic acid supplementation on inositol phosphate (InsP) degradation, nutrient digestibility and retention, and the microbiota in ileal digesta and feces of pigs. We hypothesized that the effects of exogenous phytase on InsP degradation and related nutrient digestibility are dependent on the dietary mineral Ca source and the addition of formic acid. Furthermore, we expected that the abundance of microbial groups in digesta and feces would be altered by the change of the dietary Ca source or the addition of formic acid.
Materials and Methods
The experiment was approved by the Regierungspräsidium Stuttgart, Germany in agreement with the German Animal Welfare Regulations (approval No. 35-9185.81/0494). Care of the animals in the trial was in accordance with the corresponding Directive 2010/63/EU (European Parliament and the Council of the European Union, 2010).
Experimental diets
Five diets were formulated. Diets 1 to 4 were arranged in a 2 × 2-factorial with 2 dietary Ca sources (Ca carbonate and Ca formate) and 2 inclusion levels of exogenous 6-phytase (0 and 1,500 FTU/kg diet; Natuphos E, BASF SE, Ludwigshafen, Germany) (Table 1). The fifth diet was composed of diet 4 (Ca carbonate plus phytase) but with formic acid addition (8 g/kg of diet; Amasil NA, BASF SE). The inclusion of NaCl was adjusted to balance the Na concentration in the diets and diatomaceous earth was used to balance mass differences. All diets were mainly based on corn, soybean meal, and rapeseed meal, and mineral P was not added; titanium dioxide was included as an indigestible marker. The analyzed Ca concentration was slightly lower in the diets with Ca formate than in those with Ca carbonate (Table 2). Otherwise, the calculated nutrient concentrations and phytase activity were confirmed by analyses. Corn, soybean, and rapeseed meal were from the same batches used in a previous study and their analyzed nutrients were described there (Klein et al., 2023).
Ingredient composition of the experimental diets1
| Dietary Ca source | Ca formate | Ca carbonate | |||
|---|---|---|---|---|---|
| Exogenous phytase, FTU/kg of diet | 0 | 1,500 | 0 | 1,500 | 1,500 |
| Formic acid, g/kg of diet | 8 | ||||
| Ingredients, g/kg as-fed | Diet 1 | Diet 2 | Diet 3 | Diet 4 | Diet 5 |
| Corn2 | 586 | ||||
| Soybean meal2 | 250 | ||||
| Rapeseed meal2 | 100 | ||||
| Soybean oil | 20 | ||||
| P-free mineral and vitamin premix3 | 20 | ||||
| Titanium dioxide | 5 | ||||
| NaCl | 1 | 1 | 1 | 1 | – |
| Ca formate | 11 | 11 | - | – | – |
| Limestone | – | – | 10 | 10 | 10 |
| Formic acid4 | – | – | – | – | 8 |
| Diatomaceous earth5 | 7 | 7 | 8 | 8 | 1 |
| Exogenous phytase6, FTU/kg as fed | 0 | 1,500 | 0 | 1,500 | 1,500 |
1The diets did not differ in the inclusion rate of corn, soybean meal, rapeseed meal, soybean oil, premix, and titanium dioxide.
2Analyzed nutrient concentrations of these ingredients were as reported by Klein et al. (2023).
3BASU Mineralfutter GmbH, Bad Sulza, Germany; provided the following per kilogram of diet: Ca, 362 mg; Na, 1.0 g; Mg, 200 mg; Fe, 80 mg (iron sulfate); Mn, 50 mg (manganese oxide and sulfate); Zn, 60 mg (zinc oxide and sulfate); Cu, 10 mg (copper sulphate); I, 1.34 mg (calcium iodate); Se, 0.26 mg (sodium selenite); vitamin A, 7,000 IU; vitamin D, 1,000 IU; vitamin E; 80 mg; vitamin K, 1.0 mg; vitamin B1, 1.0 mg; vitamin B2, 3.1 mg; vitamin B6, 2.5 mg; vitamin B12, 20µg; niacin, 12.5 mg; pantothenic acid, 8.0 mg; folic acid, 0.4 mg; biotin, 0.08 mg; choline chloride, 160 mg.
4Amasil NA, provided by BASF SE.
5Diamol, provided by BASU Mineralfutter GmbH.
6Natuphos E, BASF SE. According to the manufacturer, adding 1,500 FTU/kg of diet provides an equivalent of 1.66 g of digestible P per kilogram of diet.
Analyzed chemical composition of the diets, g/kg DM if not otherwise stated
| Ca source | Ca formate | Ca carbonate | |||
|---|---|---|---|---|---|
| Exogenous phytase, FTU/kg of diet | 0 | 1,500 | 0 | 1,500 | 1,500 |
| Formic acid, g/kg of diet | 8.0 | ||||
| Item | Diet 1 | Diet 2 | Diet 3 | Diet 4 | Diet 5 |
| DM, g/kg | 901 | 901 | 902 | 905 | 900 |
| GE, MJ/kg DM | 19.2 | 19.1 | 18.9 | 19.1 | 19.0 |
| Crude protein (N × 6.25) | 220 | 217 | 216 | 215 | 216 |
| Ether extract | 42 | 45 | 50 | 51 | 58 |
| aNDFom1 | 151 | 148 | 139 | 137 | 133 |
| ADFom2 | 74 | 78 | 75 | 73 | 71 |
| ADL3 | 21 | 24 | 26 | 28 | 20 |
| Crude fiber | 40 | 37 | 40 | 40 | 40 |
| Crude ash | 72 | 73 | 75 | 78 | 68 |
| Sodium | 1.7 | 1.8 | 1.9 | 1.8 | 2.0 |
| Calcium | 5.9 | 5.8 | 6.3 | 6.4 | 6.4 |
| Total phosphorus (P) | 4.8 | 4.8 | 4.7 | 4.8 | 4.8 |
| InsP6-P | 2.7 | 2.7 | 2.7 | 2.7 | 2.8 |
| InsP6, µmol/g DM4 | 14.6 | 14.6 | 14.7 | 14.7 | 14.9 |
| Ins(1,2,4,5,6)P5, µmol/g DM | 1.0 | 1.0 | 1.0 | 1.0 | 1.0 |
| Ins(1,2,3,4,5)P5, µmol/g DM | 0.5 | 0.5 | 0.5 | 0.5 | 0.5 |
| Myo-inositol, µmol/g DM | 1.7 | 1.7 | 1.7 | 1.1 | 1.1 |
| Phytase activity, FTU/kg | <60 | 1,600 | <60 | 1,680 | 1,520 |
| Indispensable amino acids | |||||
| Arg | 14.0 | 14.1 | 14.1 | 14.0 | 14.3 |
| His | 6.2 | 6.1 | 6.1 | 6.1 | 6.2 |
| Ile | 9.2 | 9.2 | 9.2 | 9.1 | 9.4 |
| Leu | 19.5 | 19.6 | 19.6 | 19.6 | 19.9 |
| Lys | 11.6 | 11.5 | 11.5 | 11.5 | 11.7 |
| Met | 3.7 | 3.7 | 3.7 | 3.7 | 3.8 |
| Phe | 10.7 | 10.7 | 10.7 | 10.7 | 10.9 |
| Thr | 8.8 | 8.6 | 8.7 | 8.7 | 8.8 |
| Val | 10.4 | 10.4 | 10.4 | 10.2 | 10.6 |
| Dispensable amino acids | |||||
| Ala | 11.4 | 11.3 | 11.4 | 11.4 | 11.6 |
| Asx5 | 21.3 | 21.0 | 21.1 | 21.1 | 21.4 |
| Cys | 3.6 | 3.5 | 3.6 | 3.6 | 3.5 |
| Glx5 | 39.6 | 39.3 | 39.5 | 39.5 | 40 |
| Gly | 9.5 | 9.5 | 9.4 | 9.4 | 9.6 |
| Pro | 12.8 | 13.2 | 13.4 | 13.3 | 13.5 |
| Ser | 11.1 | 10.9 | 11.0 | 11.1 | 11.1 |
| Tyr | 7.6 | 7.4 | 7.5 | 7.4 | 7.5 |
1Neutral detergent fiber assayed with heat-stable amylase and expressed exclusive of residual ash.
2Acid detergent fiber expressed exclusive of residual ash.
3Acid detergent lignin.
4Inositol phosphate (InsP) isomers not included in this table were not detectable or below the limit of quantification.
5Asp, Asn and Glu, Gln, respectively, were not distinguished because the side groups of Asn and Gln are lost during acid hydrolysis (Fontaine, 2003).
Animals, experimental design, sample collection, and preparation
Eight barrows (German Landrace × Piétrain; initial BW 24.1 ± 1.7 kg; final BW 57.3 ± 2.3 kg) were obtained from the Agricultural Experimental Station “Unterer Lindenhof” (Eningen unter Achalm, Germany) of the University of Hohenheim and surgically fitted with a simple T-cannula at the distal ileum (Li et al., 1993). They were kept individually in stainless steel metabolism units (1.5 × 0.8 × 1.0 m) with a low-pressure drinking nipple allowing free access to drinking water. The room temperature was set at 22.0 ± 0.5 °C. Pigs were fed 3 times the estimated energy requirement for maintenance (440 kJ ME/kg0.75 BW; GfE, 2008) and the feed was provided in 2 equal meals at 0715 and 1915 hours. Feed residues in the trough rarely occurred and were collected and analyzed for the calculation of intake data. The mean dry matter (DM) intake of pigs was 1.26 kg/d.
The experiment was arranged as a completely randomized row-column design with 8 pigs, 5 diets, and 5 periods to achieve 8 replicates per diet. Each experimental period consisted of a 5-d dietary adaption, with a blood sample taken from each animal on the fifth day, followed by 3-d fecal and urine collection, and 2-d of ileal digesta collection. The blood sample was obtained from each pig via venipuncture 4 h after the morning meal. Feces were collected from the floor by hand immediately after defecation. Two subsamples of each defecation were taken from its surface, not touching the floor, with a sterile spatula for microbiota and volatile fatty acid (VFA) determination, and immediately frozen at −18 °C. Urine was collected by placing a clean bucket containing 20% sulfuric acid under the pig as soon as the pig started urinating and stored in airtight bottles at 4 °C until the end of each period. Ileal digesta was collected between 0715 to 1915 hours by attaching plastic bags to the open barrel of the cannula with rubber bands (Rosenfelder-Kuon et al., 2020). A subsample from each bag was taken by pouring a few milliliters into a sterile container for microbiota analysis and immediately frozen at −18 °C.
Ileal digesta, feces, and urine subsamples were pooled within each pig and period. Ileal digesta and feces were lyophilized (Delta 1-24 LSC, Martin Christ Gefriertrocknungsanlagen, Osterode am Harz, Germany). Ingredients and diets were ground through a 0.5-mm sieve (Ultra-Zentrifugalmühle ZM 200, Retsch, Haan, Germany) and pulverized by a vibrating cup mill (Pulverisette 9, Fritsch, Idar-Oberstein, Germany) and a mixer mill (MM 400, Retsch) was used for lyophilized feces and digesta. The ileal digesta and fecal subsamples for microbiota determination were kept individually for each pig per collection day. The fecal subsamples for the VFA determination were pooled within each pig and period.
Chemical analyses
All chemical analyses of diets, digesta, feces, urine, and blood were conducted as described in a previous article (Klein et al., 2023). In brief, crude nutrients and energy were analyzed using standard assays (VDLUFA, 2007), minerals by inductively coupled plasma optical emission spectrometer following wet digestion (Boguhn et al., 2009), blood inorganic P (Pi) and Ca as described by Sommerfeld et al. (2018a), InsP6, InsP3-5 isomers, and myo-inositol according to Sommerfeld et al. (2018b), amino acids according to Rodehutscord et al. (2004), N-acetylneuraminic acid (Neu5Ac) according to Klein et al. (2023), and VFA by gas chromatography according to Wischer et al. (2013). The phytase activity of the feed was analyzed according to ISO EN 30024 (2009).
Calculations
Prececal InsP6 disappearance and digestibility of nutrients and gross energy (GE) were calculated using equation 1:
where y(X) is the disappearance or digestibility of X (%) and X is the concentration of InsP6, DM, nitrogen (N), amino acid (AA), Ca, P (g/kg), or GE (MJ/kg). The corresponding values for the total digestive tract were calculated using fecal concentrations.
The amount of excreted urine (kg/d) was estimated by calculating the K balance of the pigs as described by Klein et al. (2023). The retained quantities of Ca and P were calculated as the difference between the intake and excretion of the respective elements in the feces and urine.
Statistical analysis
The InsP6 disappearance and digestibilities were analyzed in a nested 2-factorial analysis of variance using the MIXED procedure of SAS (version 9.4; SAS Institute Inc., Cary, NC, USA). The model was
where yijklm is the response variable, µ is the overall mean, a is the fixed effect of formic acid (i = with or without), b is the fixed effect of the dietary Ca source within ith formic acid (j = Ca carbonate or Ca formate), c is the fixed effect of the exogenous phytase inclusion within ith formic acid (k = 0 or 1,500 FTU/kg), (bc)jk(i) is the fixed interaction effect between the jth dietary Ca source and the kth exogenous phytase inclusion within ith formic acid, τ is the random effect of the animal (l = 1 to 8), υ is the random effect of the period (m = 1 to 5) and eijklm is the residual error. For statistical comparison of diets 4 and 5 (Ca carbonate with phytase vs. Ca carbonate with phytase and formic acid), the data were analyzed in a one-factorial analysis of variance using the MIXED procedure of SAS (version 9.3; SAS Institute Inc.). The model was
where yijk is the response variable, µ is the overall mean, d is the fixed effect of the experimental diet (i = diets 1 to 5), τ is the random effect of the animal (j = 1 to 8), υ is the random effect of the period (k = 1 to 5) and eijklm is the residual error. Pearson correlation coefficients were calculated using CORR procedure in SAS. Statistical significance was set at P ≤ 0.05. A tendency was defined as 0.05 < P < 0.10.
DNA extraction, illumina amplicon sequencing, and data analysis
The applied techniques and procedures were as described in Klein et al. (2023). In brief, DNA was extracted (Burbach et al., 2016). The V1 to V2 region of the 16S rRNA gene was amplified (Kaewtapee et al., 2017). Sequencing used 250 bp paired-end sequencing chemistry on an Illumina Novaseq 6000. Sequencing raw reads were processed using MOTHUR pipeline (Kozich et al., 2013) and possible chimeras detected by UCHIME (Edgar et al., 2011). Amplicon sequence variants (ASV) were taxonomically assigned to the SILVA database (release 138.1). The closest representative for the unclassified ASV was identified manually, using seqmatch from the Ribosomal Database Project (Cole et al., 2014). Eukaryota or archaea reads were removed from the dataset. Only ASV with more than 250 bp and an average relative abundance > 0.0001% were considered.
Richness, evenness, and the Shannon diversity index were calculated using the package vegan in R version 4.0.0 (April 24, 2020). Sequencing reads were standardized by total reads. A sample dissimilarity matrix was constructed using the Bray–Curtis dissimilarity coefficient. A permutation analysis of variance (PERMANOVA) using the Adonis function was run for the formic acid, Ca source, exogenous phytase, pig, and day within each sample type to detect if the microbial composition changed when different Ca sources were fed and the diets were supplemented or not with phytase. Ca source, exogenous phytase, and the interaction of both factors were nested in formic acid. A block effect for the factor period was included by the function strata. Within each sample type, a second PERMANOVA was performed to test whether formic acid supplementation of the diets containing Ca carbonate and exogenous phytase (diets 4 and 5) affected the microbiota composition. Besides the factor diet, the factors day, pig and a block effect for period were included.
The non-metric multidimensional scaling (NMDS) was plotted with the package ggplot2 for each sample type to visualize the ordination and clustering of the individual samples. Kruskal–Wallis test, followed by Wilcoxon test (both with Benjamini–Hochberg (BH) adjustment), were conducted to reveal differences in the bacterial diversity indexes and the relative abundances at genus level between the diets (diets 1 to 5) within each sample type. The means of those that significantly differed between the diets were marked with distinct superscripts. In the case significant differences were revealed, the respective bacterial diversity indexes and relative abundances at the genus level of the individual samples were averaged by pig and period within each sample type. The averaged bacterial diversity indexes were square root transformed to reach normal distribution, and the averaged relative abundances at the genus level were arcsine transformed. These data were run in R with the same linear mixed models described above in the context of the InsP6 disappearance, nutrient and GE digestibility, and nutrient concentrations to detect the main effects of formic acid, Ca source, and exogenous phytase.
For the exploration of relationships between the microbiota and the traits of hindgut disappearance, total tract digested nutrients and VFA concentrations, the relative abundances at the genus level determined in the individual fecal samples were averaged by pig and period. Only genera with relative abundances > 1% were considered. Before the Spearman correlation coefficients were computed, all values were standardized by calculating the z-scores. The visualization was done with the R package, svglite. Statistical significance for all results was set at P ≤ 0.05. Sequences were submitted to European Nucleotide Archive under the accession number PRJEB73846.
Results
InsP6 disappearance and nutrient digestibility
No significant interaction effect was observed between dietary Ca source and exogenous phytase on InsP6 disappearance and nutrient digestibility at prececal and total tract levels (Table 3). The prececal InsP6 disappearance was lower (P = 0.007) with Ca formate compared to Ca carbonate (44% vs. 48%) and higher (P < 0.001) with exogenous phytase than without it (13% vs. 79%). Total tract InsP6 disappearance was not significantly affected and was nearly complete in all diets (98%). The prececal P digestibility was lower (P = 0.032) with Ca formate compared to Ca carbonate (36% vs. 39%). The prececal and total tract digestibility of P and Ca (P < 0.001), and the total tract digestibility of DM (P = 0.002) were higher in diets with exogenous phytase compared to diets without it. The prececal and total tract digestibility of GE and N were not different among the treatments. Calculated hindgut disappearance of GE, N, P, and Ca did not differ among the diets. Calculated hindgut disappearance of InsP6 was lower (P < 0.001) with exogenous phytase than without it (Supplementary Table S1).
Prececal and total tract inositol hexakisphosphate (InsP6) disappearance, prececal and total tract nutrient digestibility in growing pigs (%)1
| Ca source | Ca formate | Ca carbonate | ||||||||
|---|---|---|---|---|---|---|---|---|---|---|
| Exogenous phytase, FTU/kg of diet | 0 | 1,500 | 0 | 1,500 | 1,500 | |||||
| Formic acid, g/kg of diet | 0 | 0 | 0 | 0 | 8.0 | P-value | ||||
| Item | Diet 1 | Diet 2 | Diet 3 | Diet 4 | Diet 5 | SEM | Diet 4 vs. 5 | Ca source | Phytase | Ca source × Phytase |
| Prececal | ||||||||||
| DM | 60.5 | 61.0 | 62.2 | 60.4 | 62.5 | 0.71 | 0.106 | 0.391 | 0.332 | 0.102 |
| GE | 67.0 | 67.5 | 68.9 | 67.2 | 68.6 | 0.66 | 0.165 | 0.235 | 0.381 | 0.098 |
| N | 73.3 | 74.3 | 74.1 | 73.2 | 75.6 | 0.86 | 0.078 | 0.888 | 0.937 | 0.143 |
| P | 19.4 | 52.8 | 22.6 | 55.2 | 60.9 | 1.59 | 0.004 | 0.032 | <0.001 | 0.494 |
| Ca | 51.7 | 69.2 | 47.3 | 62.7 | 65.7 | 1.58 | 0.114 | <0.001 | <0.001 | 0.296 |
| InsP6 | 9.5 | 77.4 | 15.5 | 80.0 | 87.0 | 2.17 | 0.027 | 0.007 | <0.001 | 0.093 |
| Total tract | ||||||||||
| DM | 80.8 | 81.8 | 80.5 | 81.2 | 82.7 | 0.38 | <0.001 | 0.105 | 0.002 | 0.653 |
| GE | 83.8 | 84.1 | 83.9 | 83.7 | 84.6 | 0.38 | 0.105 | 0.460 | 0.794 | 0.322 |
| N | 83.5 | 84.5 | 83.6 | 83.3 | 84.3 | 0.76 | 0.280 | 0.265 | 0.466 | 0.196 |
| P | 24.2 | 55.5 | 26.2 | 57.4 | 61.8 | 2.20 | 0.034 | 0.129 | <0.001 | 0.830 |
| Ca | 48.4 | 70.3 | 44.4 | 63.3 | 66.0 | 2.68 | 0.203 | 0.001 | <0.001 | 0.319 |
| InsP6 | 97.0 | 98.0 | 97.1 | 98.1 | 98.7 | 0.58 | 0.083 | 0.882 | 0.118 | 0.652 |
1Least square means based on 8 observations per diet.
The urinary P excretion was greater (P = 0.005) and urinary Ca excretion was smaller (P < 0.001) in diets with exogenous phytase compared to diets without it (Table 4). The retention of P and Ca was greater (P < 0.001) in diets with exogenous phytase (1.6 g/d vs. 3.5 g/d and 2.3 g/d vs. 4.6 g/d, respectively), while N retention and urinary N excretion did not differ among the diets. The proportion of urea-N in total urinary N was lower (P = 0.006) in diets with exogenous phytase than in diets without it. The Ca source in the diet did not affect the retention of P, Ca, and N. The addition of formic acid to the diet with Ca carbonate and phytase resulted in a higher (P = 0.027) prececal InsP6 disappearance (80% vs. 87%) and a higher (P ≤ 0.034) prececal and total tract P digestibility (Table 3). The prececal and total tract Ca digestibility was not affected by the addition of formic acid, but urinary Ca excretion was lower (P = 0.027) compared to Ca carbonate with phytase alone (0.4 vs. 0.7 g/d) (Table 4).
Phosphorus (P), calcium (Ca), and nitrogen (N) balance of growing pigs1
| Ca source | Ca formate | Ca carbonate | ||||||||
|---|---|---|---|---|---|---|---|---|---|---|
| Exogenous phytase, FTU/kg of diet | 0 | 1,500 | 0 | 1,500 | 1,500 | |||||
| Formic acid, g/kg of diet | 0 | 0 | 0 | 0 | 8.0 | P-value | ||||
| Item | Diet 1 | Diet 2 | Diet 3 | Diet 4 | Diet 5 | SEM | Diet 4 vs. 5 | Ca source | Phytase | Ca source × Phytase |
| P | ||||||||||
| Intake, g/d | 6.0 | 6.0 | 6.0 | 6.1 | 6.0 | 0.75 | ||||
| In feces, g/d | 4.6 | 2.6 | 4.3 | 2.5 | 2.2 | 0.33 | 0.019 | 0.182 | <0.001 | 0.834 |
| In urine, mg/d | 8.2 | 31.3 | 20.3 | 69.9 | 132.3 | 36.95 | 0.251 | 0.357 | 0.005 | 0.254 |
| Retention, g/d | 1.4 | 3.4 | 1.7 | 3.5 | 3.7 | 0.45 | 0.268 | 0.094 | <0.001 | 0.441 |
| Ca | ||||||||||
| Intake, g/d | 7.4 | 7.4 | 8.0 | 8.1 | 8.0 | 0.95 | ||||
| In feces, g/d | 3.8 | 2.1 | 4.3 | 2.9 | 2.6 | 0.30 | 0.112 | <0.001 | <0.001 | 0.105 |
| In urine, g/d | 1.6 | 0.6 | 1.2 | 0.7 | 0.4 | 0.16 | 0.027 | 0.294 | <0.001 | 0.193 |
| Retention, g/d | 2.1 | 4.6 | 2.5 | 4.5 | 5.0 | 0.64 | 0.063 | 0.512 | <0.001 | 0.220 |
| N | ||||||||||
| Intake, g/d | 44.1 | 44.1 | 44.1 | 44.3 | 44.0 | 5.49 | ||||
| In feces, g/d | 7.2 | 6.7 | 7.1 | 7.4 | 6.7 | 0.72 | 0.178 | 0.201 | 0.493 | 0.124 |
| In urine, g/d | 14.9 | 15.7 | 14.2 | 16.3 | 16.1 | 2.51 | 0.345 | 0.644 | 0.066 | 0.424 |
| Urea, % of total urine N | 83.7 | 82.5 | 84.2 | 81.2 | 82.8 | 1.02 | 0.158 | 0.651 | 0.006 | 0.190 |
| Retention, g/d | 22.0 | 21.6 | 22.7 | 20.6 | 21.3 | 2.55 | 0.388 | 0.898 | 0.078 | 0.372 |
1Least square means based on 8 observations per diet.
Inositol phosphates and myo-inositol in ileum digesta and feces
In the distal ileum content, the concentration of InsP6 was lower (P < 0.001) in diets with exogenous phytase than in diets without it (Table 5). The concentrations of Ins(1,2,4,5,6)P5, Ins(1,2,3,4,5)P5, Ins(1,2,5,6)P4, and Ins(1,2,3,4)P4 were lower in diets with Ca carbonate compared to diets with Ca formate but only in the presence of phytase, which is indicated by significant interactions (P ≤ 0.019). The concentration of myo-inositol was higher (P < 0.001) in diets with exogenous phytase than in diets without it. In feces, concentrations of Ins(1,2,4,5,6)P5 and myo-inositol were lower (P ≤ 0.004) in diets with exogenous phytase compared to diets without it but overall on a low level. The Neu5Ac concentration in ileal digesta was lower (P < 0.007) in diets with exogenous phytase than in diets without it and unaffected by the Ca source. The addition of formic acid to the diet with Ca carbonate and exogenous phytase resulted in lower (P < 0.001) concentrations of InsP6, Ins(1,2,4,5,6)P5, and Ins(1,2,3,4,5)P5 and higher (P ≤ 0.031) concentrations of Ins(1,2)P2 and myo-inositol in the distal ileum content compared to the diet with Ca carbonate and phytase alone.
Concentrations of inositol phosphates, myo-inositol, and N-acetylneuraminic acid (Neu5Ac) in the distal ileum content and feces of growing pigs and urinary excretion of myo-inositol (µmol/g DM if not otherwise stated)1
| Ca source | Ca formate | Ca carbonate | ||||||||
|---|---|---|---|---|---|---|---|---|---|---|
| Exogenous phytase, FTU/kg of diet | 0 | 1,500 | 0 | 1,500 | 1,500 | |||||
| Formic acid, g/kg of diet | 0 | 0 | 0 | 0 | 8.0 | P-value | ||||
| Item | Diet 1 | Diet 2 | Diet 3 | Diet 4 | Diet 5 | SEM | Diet 4 vs. 5 | Ca source | Phytase | Ca source × Phytase |
| Ileum digesta2 | ||||||||||
| InsP6 | 35.4 | 8.9 | 34.5 | 7.8 | 5.4 | 0.99 | 0.001 | 0.191 | <0.001 | 0.372 |
| Ins(1,2,4,5,6)P5 | 2.5a | 0.9b | 2.6a | 0.7c | 0.5 | 0.08 | 0.001 | 0.203 | <0.001 | 0.012 |
| Ins(1,2,3,4,5)P5 | 1.4a | 1.5a | 1.5a | 1.1b | 0.7 | 0.10 | 0.001 | 0.070 | 0.050 | 0.002 |
| Ins(1,2,3,4,6)P5 | 0.7 | n.d. | 0.6 | n.d. | n.d. | 0.03 | – | 0.327 | – | – |
| Ins(1,2,5,6)P4 | 0.4c | 3.2a | 0.4c | 2.5b | 2.2 | 0.15 | 0.230 | 0.094 | <0.001 | 0.019 |
| Ins(1,2,3,4)P4 | 0.2c | 4.1a | 0.3c | 3.3b | 2.8 | 0.20 | 0.088 | 0.300 | <0.001 | 0.009 |
| InsP3x3 | n.d. | 8.4 | n.d. | 7.5 | 8.7 | 0.62 | 0.113 | 0.216 | – | – |
| Ins(1,2)P2 | n.d. | 4.1 | n.d. | 5.3 | 8.8 | 0.63 | 0.001 | 0.081 | – | – |
| Myo-inositol | 2.2 | 7.9 | 2.6 | 9.6 | 11.4 | 1.05 | 0.031 | 0.102 | <0.001 | 0.306 |
| Neu5Ac, g/kg DM | 0.28 | 0.26 | 0.28 | 0.26 | 0.26 | 0.03 | 0.824 | 0.640 | 0.007 | 0.704 |
| Feces2 | ||||||||||
| InsP6 | 2.4 | 1.7 | 2.3 | 1.6 | 1.2 | 0.45 | 0.344 | 0.840 | 0.088 | 0.766 |
| Ins(1,2,4,5,6)P5 | 0.7 | 0.2 | 0.6 | 0.2 | n.d. | 0.05 | – | 0.227 | <0.001 | 0.137 |
| Myo-inositol | 0.9 | <LOQ | 0.7 | 0.4 | <LOQ | 0.10 | – | 0.328 | 0.004 | – |
| Urine | ||||||||||
| Myo-inositol, µg/d4 | 18.9 | 36.2 | 23.1 | 33.0 | 40.3 | 9.57 | 0.184 | 0.453 | <0.001 | 0.815 |
1Least square means based on 8 observations per diet.
2Inositol phosphate isomers not mentioned here were not detectable (n.d.) or below the limit of quantification (< LOQ).
3A discrimination was not possible because of co-elution, at least one of the following isomers was present: Ins(1,2,6)P3, Ins(1,4,5)P3, Ins(2,4,5)P3.
4Least square means based on 7 observations per diet, as animal no. 3 had a 4.3 higher urinary excretion of myo-inositol than the mean of all other pigs.
a,b,cWithin a row, means of diets 1 to 4 without a common superscript significantly differ (P ≤ 0.05).
Blood metabolites and VFA in feces
The blood concentrations of Pi and myo-inositol were higher and those of Ca and BUN were lower (P < 0.001) in diets with exogenous phytase than in diets without it (Table 6). The blood Ca concentration was higher (P = 0.012) in pigs fed Ca formate compared to Ca carbonate. The activity of ALP was lower with phytase, but only in the presence of Ca carbonate, which was indicated by a significant interaction (P = 0.020). The addition of formic acid to the diet with Ca carbonate and phytase resulted in an increased concentration of Pi and BUN (P ≤ 0.029) and a decreased ALP activity (P = 0.026). The concentration of VFA in the feces was not different among the treatments (Supplementary Table S2).
Inorganic P (Pi), Ca, alkaline phosphatases (ALP), myo-inositol, and urea nitrogen (BUN) in the blood serum of pigs1
| Ca source | Ca formate | Ca carbonate | ||||||||
|---|---|---|---|---|---|---|---|---|---|---|
| Exogenous phytase, FTU/kg of diet | 0 | 1,500 | 0 | 1,500 | 1,500 | |||||
| Formic acid, g/kg of diet | 0 | 0 | 0 | 0 | 8.0 | P-value | ||||
| Item | Diet 1 | Diet 2 | Diet 3 | Diet 4 | Diet 5 | SEM | Diet 4 vs. 5 | Ca source | Phytase | Ca source × Phytase |
| Pi, mmol/L | 1.7 | 2.6 | 1.8 | 2.7 | 3.0 | 0.07 | 0.016 | 0.229 | <0.001 | 0.429 |
| Ca, mmol/L | 3.0 | 2.8 | 3.0 | 2.7 | 2.8 | 0.04 | 0.110 | 0.012 | <0.001 | 0.634 |
| ALP, U/L2 | 171ab | 177a | 180a | 165b | 150 | 20 | 0.026 | 0.496 | 0.222 | 0.020 |
| Myo-inositol, µg/mL | 6.2 | 8.8 | 5.9 | 9.2 | 9.9 | 0.92 | 0.368 | 0.677 | <0.001 | 0.156 |
| BUN, mg/dL | 16.2 | 14.5 | 15.2 | 14.5 | 15.3 | 0.77 | 0.029 | 0.074 | <0.001 | 0.171 |
1Least square means based on 8 observations per diet.
2Least square means based on 7 observations per diet (without animal no. 5, as it had 2.0 times higher ALP activity compared to the mean ALP of the other pigs).
a,bWithin a row, means of diets 1 to 4 without a common superscript differ (P ≤ 0.05).
Prececal amino acid digestibility
The prececal Arg digestibility was slightly higher in diets with Ca formate and phytase compared to the other diets, as indicated by a significant interaction (P = 0.048) (Table 7). The prececal digestibility of His, Leu, Val, and Tyr was higher in pigs fed Ca formate compared to Ca carbonate, but only in the presence of phytase (P ≤ 0.044 for the interaction effect). The addition of formic acid to the diet with Ca carbonate and phytase resulted in an increase of prececal AA digestibility between 1.5%-points for Arg and 3.9%-points for Cys compared to the diet with Ca carbonate and phytase alone. This increase in AA digestibility was significant (P ≤ 0.010) for Arg, His, Ile, Lys, Phe, Thr, Val, Asx, Ser, and Tyr.
Prececal amino acid (AA) digestibility of the diets fed to growing pigs (%)1
| Ca source | Ca formate | Ca carbonate | ||||||||
|---|---|---|---|---|---|---|---|---|---|---|
| Exogenous phytase, FTU/kg of diet | 0 | 1,500 | 0 | 1,500 | 1,500 | |||||
| Formic acid, g/kg of diet | 0 | 0 | 0 | 0 | 8.0 | P-value | ||||
| Item | Diet 1 | Diet 2 | Diet 3 | Diet 4 | Diet 5 | SEM | Diet 4 vs. 5 | Ca source | Phytase | Ca source × Phytase |
| Indispensable amino acids | ||||||||||
| Arg | 85.5b | 86.9a | 85.6b | 85.6b | 87.1 | 0.52 | 0.006 | 0.116 | 0.051 | 0.048 |
| His | 76.6ab | 77.9a | 76.8ab | 75.8b | 78.5 | 0.75 | 0.001 | 0.088 | 0.945 | 0.043 |
| Ile | 80.2 | 81.8 | 80.2 | 79.9 | 82.5 | 0.74 | 0.003 | 0.112 | 0.238 | 0.096 |
| Leu | 80.7ab | 82.1a | 81.3ab | 80.2b | 82.4 | 0.77 | 0.075 | 0.301 | 0.775 | 0.042 |
| Lys | 77.8 | 79.5 | 77.9 | 77.7 | 80.4 | 0.8 | 0.002 | 0.145 | 0.138 | 0.08 |
| Met | 83.6 | 84.3 | 83.2 | 82.2 | 84.4 | 0.7 | 0.069 | 0.035 | 0.849 | 0.139 |
| Phe | 81.1 | 82.6 | 81.4 | 81.4 | 83.1 | 0.67 | 0.006 | 0.192 | 0.238 | 0.062 |
| Thr | 68.3 | 69.8 | 68.8 | 67.6 | 71.0 | 1.04 | 0.004 | 0.28 | 0.843 | 0.081 |
| Val | 75.8ab | 77.6a | 76.3ab | 75.3b | 78.1 | 0.86 | 0.005 | 0.172 | 0.483 | 0.044 |
| Dispensable amino acids | ||||||||||
| Ala | 75.4 | 77.2 | 75.8 | 74.5 | 77.5 | 0.98 | 0.051 | 0.145 | 0.68 | 0.053 |
| Asx2 | 74.4 | 76.2 | 74.7 | 74.8 | 77.0 | 0.83 | 0.010 | 0.369 | 0.079 | 0.135 |
| Cys | 62.1 | 63.8 | 63.7 | 61.8 | 65.7 | 2.1 | 0.112 | 0.923 | 0.916 | 0.104 |
| Glx2 | 80.7 | 82.2 | 81 | 80.9 | 82.6 | 0.88 | 0.124 | 0.473 | 0.321 | 0.173 |
| Gly | 61.6 | 64.2 | 62.4 | 62.0 | 65.4 | 1.98 | 0.088 | 0.563 | 0.314 | 0.163 |
| Pro | 58.1 | 63.9 | 63.8 | 63.3 | 65 | 3.98 | 0.593 | 0.254 | 0.305 | 0.141 |
| Ser | 73.9 | 75.6 | 74.5 | 73.7 | 76.5 | 0.91 | 0.005 | 0.323 | 0.491 | 0.06 |
| Tyr | 79.8ab | 81.1a | 80.3ab | 79.3b | 81.5 | 0.75 | 0.009 | 0.272 | 0.743 | 0.041 |
1Least square means based on 8 observations per diet.
2Asp, Asn and Glu, Gln, respectively, were not distinguished because side groups of Asn and Gln are lost during acid hydrolysis (Fontaine, 2003).
a,bWithin a row, means of diets 1 to 4 without a common superscript differ (P ≤ 0.05).
Microbial community
Amplicon sequencing of fecal (n = 120) and ileal digesta (n = 80) samples showed an average of 26,433 ± 5,309 reads per sample, and 2,779 ASV were identified from the reads. Within the ileal digesta samples, neither the Shannon diversity index nor the evenness and richness differed between the dietary treatments (P > 0.05) (Supplementary Table S3). Within the fecal samples, the diet with Ca carbonate, phytase, and formic acid (diet 5) led to a higher Shannon diversity index compared to the other diets (Figure 1a, Supplementary Table S4). The factors Ca source (P = 0.050) and formic acid (P = 0.050) affected the averaged Shannon diversity index. Ca formate diets showed an increase of the index by 0.2 compared to Ca carbonate diets. The Ca carbonate diet with phytase showed an increase of the index by 0.54 when supplemented with formic acid. The same dietary treatment (diet 5) showed a higher evenness compared to the remaining Ca carbonate diets (diet 3 and diet 4) and Ca formate diet with phytase (diet 2) (Figure 1b, Supplementary Table S4). The factors Ca source (P = 0.037) and formic acid (P = 0.037) affected the averaged evenness. Ca formate resulted in a slight increase of evenness by 0.025 compared to Ca carbonate. The formic acid supplementation of the Ca carbonate with phytase diet led to a minor increase of 0.07 compared to the unsupplemented diet.
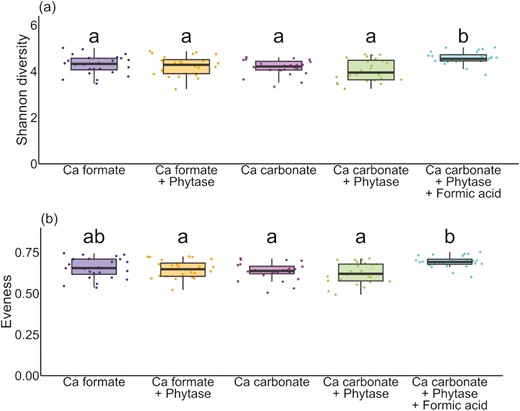
Diversity index of the individual fecal samples divided by diet. (a) Shannon diversity index and (b) evenness. Significant differences (P ≤ 0.05) are indicated by different letters.
The NMDS of the digesta samples (Figure 2a) showed that the distances between the centroids of samples belonging to different Ca sources without formic acid were larger than those caused by phytase within Ca source. Adding formic acid to the diet with Ca carbonate and phytase led to a shift of the microbiota composition close to those of the Ca formate diets. The PERMANOVA showed that Ca source, pig, and formic acid addition had an effect on the microbial composition of the ileal digesta samples (P ≤ 0.012) (Supplementary Tables S5 and S6). Treatment effects were observed only for the low-abundant genera Escherichia/Shigella and Veillonella (Figure 2b, Supplementary Table S7). Escherichia/Shigella were more abundant in the Ca carbonate diets without formic acid (diet 3 and diet 4) than in the Ca carbonate diet with added formic acid (diet 5). Formic acid significantly affected the average relative abundance of Escherichia/Shigella (P = 0.045). Veillonella had the lowest relative abundance in the Ca carbonate diet without phytase (diet 3). The highest abundance was observed in the Ca carbonate diet with phytase and formic acid (diet 5) and differed significantly from the Ca formate diet without phytase (diet 1). Phytase had an effect on the average relative abundance of Veillonella (P = 0.003) and increased its relative abundance by 1.3%.
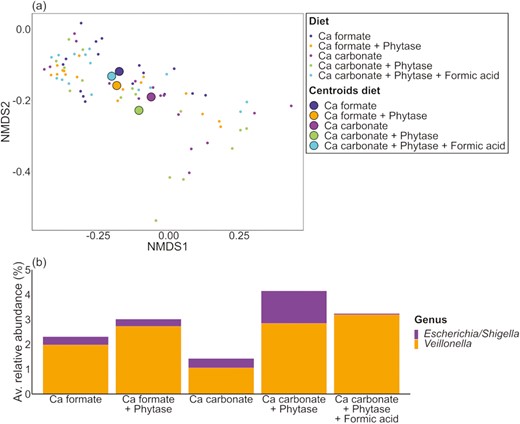
Individual digesta samples divided by dietary treatment. (a) NMDS and (b) barplots of the relative abundance data at the genus level with significant differences (P ≤ 0.05).
The NMDS of the fecal samples (Figure 3a) showed that the microbial composition in the Ca formate diets and the Ca carbonate diet with phytase and no added formic acid were similar because of the close position of the centroids. Apart from them was the centroid of the Ca carbonate diet without phytase. The centroid of the Ca carbonate diet with phytase and formic acid was closer to the centroids of the Ca formate diets than the other Ca carbonate diets. PERMANOVA results showed that Ca source, exogenous phytase, pig, the interaction of Ca source and exogenous phytase, and formic acid had an effect on the microbial composition in the fecal samples (P ≤ 0.013) (Supplementary Tables S8 and S9). Several shifts were observed between different dietary treatments at the genus level (Supplementary Table S10). The abundance of Butyricicoccus was the highest in the Ca carbonate diet with phytase and formic acid (diet 5) and differed significantly from the other dietary treatments except for the Ca carbonate diet with phytase (diet 4). Formic acid had a significant effect (P = 0.01) and led to an increase of 1.82% when added to the calcium carbonate diet with phytase.
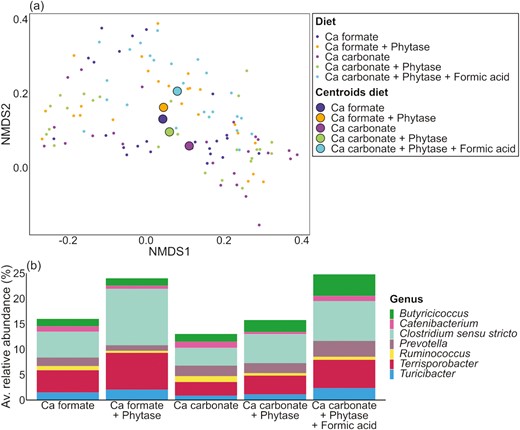
Individual fecal samples divided by dietary treatment. (a) NMDS and (b) barplots of the relative abundance data at the genus level with significant differences (P ≤ 0.05).
The supplementation of the Ca formate diets with and without phytase (diet 1 vs. diet 2) resulted in variations of Clostridium sensu stricto, Prevotella, Ruminococcus, and Terrisporobacter (Supplementary Table S10). Similar shifts were observed for the genera Catenibacterium and Ruminococcus when comparing the Ca carbonate diets with and without phytase (diet 3 vs. diet 4) (Supplementary Table S10). The Ca formate diet with phytase (diet 2) differed significantly from the Ca carbonate diets with and without phytase (diet 3 and diet 4) for the genera Clostridium sensu stricto, Prevotella and Terrisporobacter (Supplementary Table S10). Additionally, the Ca carbonate diet with phytase (diet 4) differed from the Ca formate diet with phytase (diet 2) for Terrisporobacter. Formic acid was the only factor that had a significant effect (P = 0.049) and led to an increase of Turicibacter by 1.32% in the feces of the pigs.
Total tract digestible nutrients and energy were significantly correlated with several bacteria (Supplementary Figure S1) and most of these correlations were positive. Calculated values of hindgut disappearance were mainly negatively correlated with bacterial relative abundance in the feces (Supplementary Figure S2). Negative and positive correlations were calculated between VFA in feces and bacterial relative abundances in feces (Supplementary Figure S3).
Discussion
Effects on InsP6 degradation and P digestibility by replacing Ca carbonate with Ca formate
The difference in dietary Ca intake between the diets containing Ca formate and those containing Ca carbonate (7.4 g/d vs. 8.0 g/d) did not result in significant variations in digestible Ca intake (3.6 g/d vs. 3.7 g/d and 5.3 g/d vs. 5.2 g/d, P = 0.85, calculated as the difference between Ca intake and fecal Ca excretion). Calcium homeostasis in pigs is primarily regulated in the kidney rather than in the intestine (Schröder and Breves, 2006). Therefore, it can be assumed that the similar digestible Ca intake was a result of a greater Ca digestibility from Ca formate compared to Ca carbonate. An active downregulation of transcellular Ca absorption in the small intestine with Ca carbonate appears unlikely, given that the total Ca supply did not exceed the requirement of the pigs as suggested by GfE (2008).
The level of prececal InsP6 disappearance, in the absence of exogenous phytase in the feed, was in the range of previous studies conducted in pigs fed corn-based diets (Rodehutscord et al., 2022). According to Lawlor et al. (2005), Ca formate is characterized by its greater solubility and lower acid-binding capacity than Ca carbonate. Consequently, replacing dietary Ca carbonate with Ca formate could be expected to lead to a greater disappearance of InsP6, as it mitigates the pH increase in the stomach, which is associated with the use of Ca carbonate. However, the opposite was found: Ca formate instead of Ca carbonate in the feed led to lower prececal InsP6 disappearance. This was consistent with the results of a broiler chicken study (Krieg et al., 2021). These authors suggested that the higher solubility of Ca formate compared to Ca carbonate resulted in a more rapid release of Ca ions capable of forming complexes with InsP6 in the digestive tract and reducing accessibility of InsP6 by endogenous phytases in the small intestine. The same effect may have occurred in the present study.
The increase in InsP6 disappearance with exogenous phytase was similar for both Ca sources in the feed (68% vs. 65%-units). This indicates that most of the InsP6 is hydrolyzed by exogenous phytases in the stomach before insoluble complexes are formed at a decisive pH in the small intestine (Klein et al., 2023). However, prececal InsP6 disappearance remained lower with Ca formate than Ca carbonate in the presence of phytase, implying the faster accumulation of free Ca ions by Ca formate and the formation of insoluble complexes could not be fully compensated by exogenous phytase.
The addition of phytase caused an increased concentration of partially dephosphorylated InsP isomers in the distal ileum digesta in the present study and previous studies (Krieg et al., 2020; Klein et al., 2023). In the phytase-containing diets, the concentrations of Ins(1,2,4,5,6)P5, Ins(1,2,3,4,5)P5, and InsP4 isomers were greater with Ca formate than Ca carbonate suggesting that dephosphorylation of InsP5 and InsP4 was at a lower rate with Ca formate than Ca carbonate with the used phytase. Consequently, with Ca carbonate, the formation of partially dephosphorylated InsP would have occurred more anteriorly in the digestive tract, allowing for continued dephosphorylation. This would explain why the concentrations of InsP5 and InsP4 were lower, while Ins(1,2)P2 (by a trend) and myo-inositol concentrations were numerically greater with Ca carbonate compared to Ca formate at the distal ileum digesta in the presence of exogenous phytase. Consistent with the greater InsP degradation, prececal P digestibility and P retention (by a trend) were greater with Ca carbonate compared to Ca formate, suggesting the additional released InsP-P was absorbed and retained by the animals. On average, the concentration of fecal digestible P in the diet increased by 1.45 g/kg when phytase was added. This is close to the matrix value of this phytase as provided by the supplier (1.66 g digestible P at 1,500 FTU).
The P concentration in the urine was very low in diets without phytase and similar to previously obtained values (Klein et al., 2023). It did not exceed the estimated value of inevitable P losses estimated for growing pigs (Rodehutscord et al., 1998) with these diets. However, P excretion in urine increased with exogenous phytase in the feed. While the ratio of retained Ca and retained P was 1.47 to 1.50 in diets without phytase, it was 1.35 to 1.38 in diets with exogenous phytase. The Ca digestibility reached values at and close to 70%, which is very high. Thus, the increase in urinary P excretion with exogenous phytase might imply the supply of digestible Ca became the limiting factor for P retention with those diets in the present study.
Formic acid addition effects on InsP6 degradation and mineral digestibility
The addition of 8 g formic acid per kg diet containing Ca carbonate and exogenous phytase increased prececal InsP6 disappearance by 7%-units. A similar increase (8%-units) was found by Kemme et al. (1999) when 30 g of lactic acid was added to a phytase-containing diet. Two possible reasons may have caused this effect. Most commercial phytases have optimal activity between pH 2.5 and 3.5 (Greiner, 2021; Menezes-Blackburn et al., 2022). We could not measure gastric pH in the present study, but a shift in stomach pH towards such optimum may have occurred with formic acid addition to the diet as demonstrated by Kristofferson et al. (2021). Furthermore, the reduction of the pH by the addition of acid may have reduced the complex formation of InsP6 with divalent cations such as Ca (Maenz et al., 1999) and increased accessibility of InsP6 for the added enzyme.
Related to the greater InsP6 disappearance, concentrations of InsP5 isomers decreased, and those of Ins(1,2)P2 and myo-inositol in ileum digesta increased, suggesting an overall more rapid InsP degradation upon the addition of formic acid to the feed. The numerically greater myo-inositol concentration in the blood of pigs fed additional formic acid is consistent with the greater myo-inositol release in the digestive tract. Across all 5 diets of the present study, myo-inositol concentrations in the distal ileum content and blood were highly correlated (r = 0.98).
The prececal and total tract P digestibilities were also increased with the addition of formic acid to the diet. While we are not aware of literature studying the effect of formic acid on InsP degradation, some studies have investigated the interaction of formic acid and phytase on P digestibility in pigs (Jongbloed et al., 2000; Blank et al., 2012). In those studies, the digestible P concentration increased by 0.2 to 0.5 g/kg DM when formic acid was supplemented and the 0.3 g/kg DM increase found in the present study was within this range. In the study by Blank et al. (2012), formic acid supplementation increased digestible P only in diets with exogenous phytase. In the study by Jongbloed et al. (2000), formic acid supplementation increased P digestibility to a greater extent in diets with exogenous phytase than in those without. Both studies have discussed a greater InsP degradation by the used phytase as a possible reason for the formic acid effect on P digestibility. The present data confirm that a greater P digestibility is related to a greater InsP degradation when formic acid is added. Kristofferson et al. (2021) did not find an increase in digestible P concentration by formic acid in the presence of phytase in piglets. They have discussed the discrepancy of their results from those of Jongbloed et al. (2000) and Blank et al. (2012) to be caused by differences in the pH optimum of the used phytase products, which were different between the studies.
The Ca excretion in urine was significantly reduced and Ca digestibility was numerically increased by the addition of formic acid in the present study. Likewise, this was caused by the greater P digestibility, which allowed for a numerically greater P and Ca accretion of pigs compared to the diet with Ca carbonate and phytase.
Amino acid digestibility
Dietary InsP6 can be complexed with protein and AA and can increase endogenous AA losses (Zouaoui et al., 2018), which can decrease apparent prececal AA digestibility values. However, recent studies in pigs did not give evidence for reduced endogenous AA losses when phytase was added to the diet (Mesina et al., 2019; Klein et al., 2023) and prececal AA digestibility values were not affected by the addition of phytase to diets that contained Ca carbonate (Rosenfelder-Kuon et al., 2020; Klein et al., 2021, 2023). Consistently, the present study did not show an effect of phytase on prececal AA digestibility when Ca carbonate was used. However, the prececal digestibility of some AA was significantly higher in pigs fed Ca formate compared to Ca carbonate in the presence of phytase and the average increase of all AA was 1.8%-units. As discussed before, InsP degradation was increased by phytase supplementation to a similar extent with both Ca sources, which suggests that the complexing of AA was not the reason for AA digestibility effects. Perhaps the release of formic acid from Ca formate in the digestive tract caused some acidification, leading to enhanced proteolysis in the digestive tract. Consistently, the addition of formic acid to the Ca carbonate diet with phytase increased the mean prececal AA digestibility by 2.5%-units, with a significant effect for most AA studied. Here, the direct acidification by formic acid might have caused an increased proteolysis.
Mesina et al. (2019) and Klein et al. (2023) rejected the hypothesis that dietary InsP6 could increase endogenous AA losses through increased mucin secretion in the intestine. However, in the present study, the Neu5Ac concentration in the ileum content was decreased with the addition of phytase and independent of the Ca source, indicating that endogenous AA losses were reduced by exogenous phytase. While Klein et al. (2023) investigated varying dietary Ca concentrations using Ca carbonate from limestone, the present study tested different Ca sources at similar dietary Ca concentrations. The variation of dietary Ca content in the study of Klein et al. (2023) may have masked any effect of exogenous phytase on Neu5Ac concentration in the digesta. Mucin secretion is a Ca dependent biological process (Song et al., 2023). Thus, the surplus on dietary Ca in the study by Klein et al. (2023) may have increased the secretion of mucin irrespective of the presence of exogenous phytase.
The supplementation of phytase caused a decreased proportion of urea-N in total urinary N and a decrease in BUN concentrations, as also observed by Klein et al. (2023). This suggests reduced protein catabolism and hepatic urea synthesis when the digestible P supply is closer to the P requirement of the animals. However, calculated N retention was not greater when phytase was added to the diet, probably because the animal’s amino acid requirements were met by the diets without phytase addition.
The addition of formic acid to the diet with Ca carbonate and phytase led to an increased BUN concentration. This coincides with the increased AA digestibility and indicates that increased absorption of AA did not lead to increased N retention of the pigs but increased urea synthesis.
Microbial community
Phytase supplementation increases prececal P digestibility, leaving less P for microbial metabolism in the hindgut (Metzler et al., 2008). Metzler-Zebeli et al. (2020) showed that such change in the P availability for microbes in the hindgut led to an altered proliferation of the main hindgut microbiota community members detectable in the feces of pigs. These authors suggested that bacteria with amylolytic and pullulanolytic abilities, e.g., members of the families Clostridiaceae and Ruminococcaceae, may cope better with lower P availability in the hindgut than fibrolytic bacteria (Metzler-Zebeli et al., 2020). Consistently, within the Ca formate diets in the present study, phytase supplementation increased relative abundances of Clostridium sensu stricto and Terrisporobacter in the feces. In contrast, the abundances of Prevotella (in the Ca formate diet), Ruminococcus (with both Ca sources), and Catenibacterium (in the Ca carbonate diet) were decreased when phytase was supplemented. The addition of phytase overall affected more genera when Ca formate was used compared to Ca carbonate. This is consistent with the results by Klein et al. (2023), who did not find effects of phytase addition when the diets contained different levels of Ca carbonate. Despite that, the relative abundance of Veillonella in ileal digesta within the Ca carbonate diets was significantly increased when phytase was supplemented. This genus is known for the ability to metabolize lactate, pyruvate, malate or fumarate anaerobically, but not carbohydrates (Kolenbrander, 2006).
In fecal and ileal samples, the microbial compositions were very similar when the diets containing Ca carbonate with formic acid and Ca formate were fed. While we could not measure the pH value in the stomach, this might have been related to the acid-binding capacity of Ca carbonate being reduced by formic acid, thus leading to similar gastric pH values. The stomach’s acidic environment functions as an ecological filter significantly influencing the formation of the entire gut microbiota (Beasley et al., 2015). For instance, the inclusion of acidifiers like formic acid can limit the proliferation of pathogenic bacteria while promoting the growth of commensal microorganisms (Luise et al., 2017) and in the present study, diets with formic acid led to a diminished relative abundance of Escherichia/Shigella in the ileal digesta.
The factor “pig” showed significance in the analysis of both ileal and fecal samples. Detecting the effects of dietary treatments on the gut microbial community in pigs might be confounded by individual variations in the gut microbiome. The factor “day” did not significantly affect the results in both sample types. This suggests that daily sample collection might not be necessary for microbiota analysis in studies that are designed like the present study, i.e., with relatively short experimental periods.
Consistent with the study by Klein et al. (2023), several genera exhibited a significant correlation with hindgut disappearance and total tract digested nutrients. Bacteria such as Bifidobacterium, Dialister, Megasphaera, and Prevotella were positively related to total tract digested InsP6. Among the Bifidobacterium species such as B. globosum and B. pseudocatenulatum, optimal activity occurred at a neutral-alkaline pH in a culture study (Haros et al., 2005), which is the relevant pH in the hindgut. Alkaline phosphatase activities were observed in Dialister massiliensis sp. nov., strain Marseille-P5638T (Afouda et al., 2020). Phytase activity was detected in Megasphaera elsdenii and Prevotella ruminicola isolated from rumen content (Yanke et al., 1998). It was hypothesized that these genera are involved in the hydrolysis of InsP6 in the intestine of the pigs. The microbial contribution to endogenous InsP6 hydrolysis remains a topic of significant interest and has yet to be fully elucidated. Furthermore, higher relative abundances of Clostridium sensu stricto, Terrisporobacter, and Turicibacter were associated with increased total tract digested P.
The negative association between Lactobacillus and total tract digested N and GE might be attributed to its proteolytic capacity (Raveschot et al., 2018; Li et al., 2022) and ability to ferment carbohydrates (Yin and Zheng, 2005). Metzler-Zebeli et al. (2019) found that resistant starch led to an increase in the relative abundance of the lactic acid-producing bacteria Lactobacillus. In accordance with the study of Klein et al. (2023), Bifidobacterium and Lactobacillus were correlated with fecal VFA concentrations. Dialister and Lactobacillus were positively associated with branched-chain and even-chain fatty acids. This also confirms the mixed fermentation capability of the microbiota. For instance, branched-chain fatty acids, like iso-butyrate were only associated with proteolytic fermentation (Mortensen and Clausen, 1996). On the other hand, acetic, propionic, and butyric acids are mainly derived from the fermentation of carbohydrates (Cummings et al., 1987; Smith and Macfarlane, 1997). Corn was the ingredient with the greatest proportion in all diets of the present study and hindgut microbiota uses resistant starch as a substrate for fermentation (Englyst et al., 1992). This could potentially explain the positive associations observed between several genera with the unbranched VFA.
Conclusions
The choice of the Ca source in pig diets affects InsP6 degradation and P digestibility. Ca formate caused a lower prececal InsP6 disappearance and P digestibility than Ca carbonate. The addition of formic acid to Ca carbonate-containing diets increases InsP6 degradation, P digestibility, and amino acid digestibility by the end of the ileum. This may contribute to feeding practices aiming at improved P and N utilization and reduced environmental impact on the pork industry. The dietary treatments resulted in more pronounced alterations of the microbiota in the feces compared to the ileal digesta. In the ileal digesta, the shifts in relative abundances were primarily evident among low-abundant genera, while in feces, changes were observed in a larger number among genera with higher levels of abundance.
Abbreviations
- AA
amino acid
- ALP
alkaline phosphatases
- ASV
amplicon sequence variants
- BH adjustment
Benjamini–Hochberg adjustment
- BUN
blood urea nitrogen
- BW
body weight
- DM
dry matter
- FTU
phytase unit
- GE
gross energy
- InsP
inositol phosphate
- InsP6
myo-inositol 1,2,3,4,5,6-hexakis (dihydrogen phosphate)
- N
nitrogen
- Neu5Ac
N-acetylneuraminic acid
- NMDS
non-metric multidimensional scaling
- PERMANOVA
permutation analysis of variance
- Pi
inorganic phosphorus
- VFA
volatile fatty acids
Acknowledgments
NK and NS received a doctoral scholarship from the H. Wilhelm Schaumann Stiftung, Hamburg, which is gratefully acknowledged. The study was funded by BASF SE, Ludwigshafen, Germany. We thank D. Berghaus for his help in conducting animal trials. We appreciate the excellent service provided by the animal clinic of the University of Hohenheim in surgery and care of the animals, and the chemical analyses conducted by the laboratory team of the Animal Nutrition Department. The authors acknowledge support by the High Performance and Cloud Computing Group at the Zentrum für Datenverarbeitung of the University of Tübingen, the state of Baden-Württemberg through bwHPC and the German Research Foundation (DFG) through grant INST 37/935-1 FUGG.
Conflicts of interest statement
Dieter Feuerstein is an employee of BASF SE. All authors declare no real or perceived conflicts of interest.
