


ABSTRACT
Incorporating indicators for pig health and welfare at meat inspection could reduce the need for on-farm assessments. Skin and tail lesions are important welfare indicators in pigs with good potential to record during meat inspection and could possibly function as iceberg indicators of on farm welfare. The aim of this study was to validate the use of these carcass lesions at meat inspection for the assessment of pig health and welfare on farm. Thirty-one farrow-to-finish pig farms (∼12% of Irish herds) were assessed using an adapted version of the Welfare Quality protocol by inspecting 6 randomly selected pens of pigs in the first weaner (4 to 8 wk), second weaner (8 to 13 wk) and finisher stage (13 to 23 wk). The average prevalence of welfare outcomes for each stage was calculated. One batch of pigs was observed at slaughter and skin and tail lesions were scored according to severity for each carcass. The average prevalence of carcass lesion outcomes was calculated for each farm. Linear regression models were developed to predict the prevalence of each welfare outcome in each stage based on the prevalence of the different carcass lesions. The welfare outcomes of different welfare aspects that were best predicted by abattoir information (highest R2) were poor body condition (first weaner stage), bursitis (second weaner stage), huddling (first weaner stage), severe tail lesions (finisher stage) and coughing (second weaner stage). Regression trees and receiver-operating curves (ROC) were used to evaluate the usefulness of carcass lesions as monitoring tools. Receiver-operating curves were created using the 75th percentile to classify farms as a problem farm for these welfare outcomes. Cut-off values of predictive carcass lesion prevalence were similar using both techniques. Models for predicting problem farms with poor body condition, bursitis and severe tail lesions were moderately accurate. Sensitivity and specificity ranged from 75 to 100% and 70 to 87%, respectively at the optimal cut-off value of the predictive carcass lesion prevalence. Results show potential for using carcass skin and tail lesions as iceberg indicators of pig health and welfare on farm. Future work is needed to evaluate the cost of including carcass lesion recording at meat inspection, the cost of failing to identify problem farms and the cost of incorrectly visiting or penalizing problem farms before carcass lesions can be used as welfare indicators in a commercial setting.
INTRODUCTION
On-farm welfare assessments are the main method for assessing pig welfare, but these assessments are labor intensive and time consuming (Dalmau et al., 2009). In addition, there is an increased risk to biosecurity and disease transmission within and between farms during these assessments (Dalmau et al., 2014). Therefore, there is an increased interest in using routinely collected data for welfare assessments (Nielsen, 2011; Harley et al., 2012a; Knage-Rasmussen et al., 2015). Several studies aimed at evaluating the welfare of dairy herds based on routinely collected data, including at meat inspection (Nyman et al., 2011; de Vries et al., 2014; Krug et al., 2015). However, there is limited work on the use of routine meat inspection data for the purpose of pig health and welfare assessment (Knage-Rasmussen et al., 2015; Nielsen et al., 2015).
Recently there is interest in incorporating welfare indicators during meat inspection at abattoirs as a surveillance tool for pig health and welfare (EFSA, 2011; Harley et al., 2012a; Stärk et al., 2014). In their 2009 report, the Farm Animal Welfare Council (FAWC) suggested the use of ‘iceberg’ indicators as a means of assessing overall animal welfare. These indicators should provide a picture of the overall welfare of the animal and function as a warning signal for underlying problems (FAWC, 2009). Tail and skin lesions are among the most frequently cited animal-based indicators of pig welfare and expert panels proposed to use them in finishing pigs (EFSA, 2012). The aim of this study was to validate carcass lesions as ‘iceberg’ indicators for on-farm welfare and to evaluate their performance as monitoring tools. It was hypothesized that farms with a higher prevalence of tail/skin lesions have a higher prevalence of different on-farm welfare problems.
MATERIALS AND METHODS
Farm Selection
A list of 45 farrow-to-finish pig farms in the Republic of Ireland was obtained through the Teagasc advisory service with the criteria that they kept records in the Teagasc eProfit Monitor and send pigs to slaughter to abattoirs that would allow data collection. All farmers were contacted by phone and 31 farmers (69%) agreed to participate in the study. The 31 study farms represented nearly 25% of all herds in the Teagasc eProfit Monitor which compromises 65% of the national commercial sow herd. As such this study included approx. 12% of the herds in the country. Farms were visited during 1 full day (July to November 2015). Production and mortality records were obtained from the Teagasc eProfit Monitor which contains quarterly data on technical and financial herd performance.
Welfare Assessment
A cross-sectional welfare assessment was performed on each farm by observing pigs in 6 randomly selected pens in the first weaning (4 to 8 wk) and second weaning (8 to 13 wk) stages and the finishing stage (13 to 23 wk). In brief, each pen was observed for a 10 min period during which the number of pigs affected by different welfare outcomes was recorded using an adapted version of the Welfare Quality protocol (Table 1; Welfare Quality, 2009). Hospital pens and pens of pigs that were weaned in the previous 24h were excluded, while the number of pens selected over different houses on the farm was balanced according to the number of pigs in each house. All assessments were done by the first author with a number of assistants.
Animal-based welfare measurements collected in 31 farms in the Republic of Ireland adapted from the Welfare Quality protocol
| Welfare theme | Welfare criteria | Animal-based measure |
|---|---|---|
| Good feeding | Absence of prolonged hunger | Body condition score |
| Good housing | Comfort around resting | Bursitis, absence of manure on the body1 |
| Thermal comfort | Shivering, panting, huddling2 | |
| Good health | Absence of injuries | Lameness, skin lesions, tail lesions, ear lesions, flank lesions |
| Absence of diseases | Mortality3, coughing4, sneezing4, pumping, twisted snouts, rectal prolapse, scouring1, skin condition, ruptures and hernia |
1Recorded on pen level only.
2Expressed as proportion of resting pigs.
3Data collected from herd performance data.
4Frequency during 5 min observation. All other measures are assessed by recording the percentage of pigs affected in a pen.
The number of lean pigs was recorded by assessing the body condition score through visual inspection and a pig was considered lean when spine, hip and pin bones were visible (Welfare Quality, 2009).
Pig dirtiness was assessed at pen level by looking at manure on the body. A pen was considered dirty when the majority of the pigs in the pen had > 50% of their body soiled (Welfare Quality, 2009). The number of pigs with bursitis was recorded. In addition, the number of pigs that were shivering, panting and huddling was recorded. The number of huddling pigs was expressed as a proportion of resting pigs.
The presence and severity of different type of injuries were assessed. The presence of lameness where a pig showed minimal weight-bearing on the affected limb or inability to move was recorded (adapted from Main et al., 2000). Skin lesions were assessed on one side of the body and were recorded when many large and/or deep lesions were observed (Björklund, 2005). Tail lesions were scored as either the presence of moderate tail lesions (evidence of chewing but no evidence of swelling) or presence of severe tail lesions (bloody, swollen and/or amputated tail; adapted from Kritas and Morrison, 2007; Harley et al., 2012b). Similarly, the presence of moderate and severe ear lesions and flank lesions were assessed on both sides of the body (Smulders et al., 2008).
During the first 5 min. of the observation a second observer recorded the frequency of coughs and sneezes per pen. The number of pigs in a pen showing signs of pumping, twisted snouts and rectal prolapse was recorded. The presence of scouring was recorded at pen level and assessed based on visible and fresh feces on the floor in the pen (Welfare Quality, 2009). The number of pigs affected by hernias and rupture and skin conditions was recorded. Pigs that appeared generally sick (e.g., lethargic) were also recorded (Table 1). A total of 31 pig farms were included in the study covering 554 pens and a total of 17,414 pigs.
Abattoir Observation
Pigs were slaughtered at 4 abattoirs in the Republic of Ireland under standard commercial practices (average travel distance 82.9 ± 9.85 km). One batch of pigs (204.3 ± 25.84 pigs) of each farm was observed at the abattoir within 2 wk of the welfare assessment. A batch was defined as all pigs of the same farm slaughtered on the day of observation. All abattoir observations were conducted by the second author leading to a total of 6,335 pigs assessed at slaughter. Each carcass was scored for tail and skin lesions after scalding and de-hairing. Tail lesions were scored according to severity on a 5-point scale adapted from Kritas and Morrison (2007) and Harley et al. (2012b) where 0 = no evidence of tail biting; 1 = healed or mild lesions; 2 = evidence of chewing or puncture wounds, but no evidence of swelling; 3 = evidence of chewing or puncture wounds with swelling and signs of possible infection; and 4 = evidence of chewing or puncture wounds with severe swelling/infection or open, gaping wound where tail used to be.
Skin lesions were scored by assessing the dorsal part of the carcass (area above the loin) according to severity on a 4-point scale adapted from the photographic scale developed by Aaslyng et al. (2013) where 0 = none or a little superficial damage; 1 = some superficial damage, clearly marked or up to three short (2 to 3 cm) and deep; 2 = clear deep and/or long damage ( > 3 cm) including much superficial damage or circular areas; and 3 = much deep damage over a large area.
Statistical Analysis
Each farm was considered as the experimental unit. For all predicted variables, residuals were checked for normality and transformed where necessary. Statistical procedures were conducted using SAS v9.3 (SAS Inst. Inc., Cary, NC) and R version 3.3.1 (The R Foundation for Statistical Computing, Vienna, Austria). Alpha level for determination of significance and tendencies were 0.05 and 0.10, respectively. Values are presented as calculated means ± SE, unless stated otherwise.
Farm Observations
For each welfare outcome, the percentage of pigs affected per pen was calculated. For each production stage, the average percentage of pigs affected was calculated by taking the average of the 6 pens. Likewise, the frequency of coughing and sneezing per pig was calculated and averaged for each production stage. Additionally, an average score for scouring and manure on the body were calculated for each production stage.
Abattoir Observations
Tail lesion scores were collapsed into none (score 0), mild (score 1), moderate (score 2) and severe (score ≥ 3) lesions. The prevalence of the different tail lesion outcomes were calculated using descriptive statistics for each farm. Similarly, the prevalence of none (score 0), mild (score 1), moderate (score 2) and severe (score 3) skin lesions were calculated.
Models
Models were fitted for each welfare outcome measured on farm using the prevalence of the different carcass lesions as predictor variables. Spearman rank correlations were calculated between predictor variables to avoid co-linearity in the models. The percentage of pigs with the different tail (1, 2, and ≥ 3) and skin (1, 2, and 3) lesion score were included as predictor variables. Shivering, panting, huddling in the finisher stage, flank lesions in the first weaner stage (total and severe lesions), pumping, twisted snout, rectal prolapse, and skin condition were excluded from analysis as they showed little variation ( > 80% zero values). Linear regression models were selected using the adjusted R2 as a selection criterion. Only models which met the requirement of normality and were statistically significant were used in further analysis. One-at-a-time cross validation was used to validate the final models and models were checked for jack-knife residuals.
To evaluate the potential of carcass lesions to explain different aspects of pig welfare, models which explained the highest variation in the welfare indicator (highest R2) were selected for the criteria of the welfare themes of good feeding (absence of prolonged hunger), good housing (comfort around resting, thermal comfort) and good health (absence of injuries, absence of disease) as defined by the Welfare Quality (2009). For the selected models, 2 approaches were used to assess their ability to divide farms based on the prevalence of health and welfare outcomes, namely regression trees and receiver operating curves (ROC). Regression trees were created using the rpart package in R to explore the cut-off value of the prevalence of the carcass lesions which provided the best separation of farms in terms of the actual prevalence of the welfare outcome on farm. For the ROC, problem farms were defined as those above the 75th percentile value for each welfare outcome. To evaluate the overall performance of the final models, sensitivity and specificity were calculated at various cut-off values. Sensitivity was defined as the proportion of farms with a problem for a specific welfare indicator ( > 75th percentile) correctly classified as having a problem, while specificity was the proportion of farms with no problem being correctly classified as no-problem farms. Sensitivity and 1 - Specificity (proportion of false positives) were plotted in ROC using the pROC package in R to determine the optimal cut-off value of the prevalence of carcass lesions used to predict the presence of welfare problems on farm. The accuracy of the model was assessed by calculating the area under the ROC curve (AUC). Values of AUC were interpreted as non-informative (AUC = 0.5), less (0.5 < AUC ≤ 0.7), moderately (0.7 < AUC ≤ 0.9), highly (0.9 < AUC < 1) accurate, and perfect (AUC = 1) as per Greiner et al. (2000). As an example, ROC curves are shown for the welfare indicators with AUC significantly higher than 0.5.
RESULTS
The majority of the pigs were kept in mixed sex groups on fully slatted floors. A description of the performance data of the study farms is given in Table 2. The average herd size on study farms was 751 sows, which is comparable with the average of 753 sows in the Teagasc eProfit Monitor program (total of 129 herds representing 65% of national sow herd population; Teagasc, 2016). Similarly, the other performance data of the study herds closely resembled the average figures for the herds in the database (Teagasc, 2016). Results of tail and skin lesion scoring are presented in Table 3.
Description of herd performance parameters collected from the Teagasc eProfit Monitor for the period January to June 2015, and the average no. of pigs per batch observed at the abattoir of the 31 study farms
| Performance parameters | N | Mean | SE | Min | Max |
|---|---|---|---|---|---|
| Herd size | 31 | 750.7 | 103.00 | 111 | 2397 |
| Sow mortality, % | 29 | 4.9 | 0.46 | 0.5 | 11.3 |
| Piglet mortality, % | 29 | 10.2 | 0.62 | 3.6 | 17.9 |
| Weaner mortality, % | 29 | 2.3 | 0.26 | 0.78 | 7.38 |
| Finisher mortality, % | 29 | 1.9 | 0.13 | 0.73 | 3.57 |
| Average daily gain, g | 28 | 722.2 | 9.52 | 623 | 807 |
| Feed conversion ratio | 28 | 2.37 | 0.022 | 2.18 | 2.64 |
| Age at sale, d | 28 | 168.5 | 2.36 | 141 | 191 |
| Average live weight, kg | 29 | 107.5 | 0.86 | 96.3 | 116 |
Descriptive statistics of the prevalence (%) of pigs affected per batch by the different carcass lesion outcomes
| Carcass lesions | Mean | SE | Min | Max |
|---|---|---|---|---|
| Tail lesions (n = 6,327) | ||||
| Score 0 | 26.7 | 1.29 | 8.2 | 46.9 |
| Score 1 | 65.3 | 1.03 | 53.1 | 74.7 |
| Score 2 | 6.7 | 1.20 | 0.0 | 34.3 |
| Score ≥ 3 | 1.2 | 0.32 | 0.0 | 7.0 |
| Skin lesions (n = 6,334) | ||||
| Score 0 | 30.9 | 2.84 | 6.6 | 66.5 |
| Score 1 | 52.2 | 1.92 | 30.0 | 75.5 |
| Score 2 | 15.7 | 1.56 | 3.5 | 40.0 |
| Score 3 | 1.2 | 0.21 | 0.0 | 3.4 |
Carcass Lesions as Iceberg Indicators
Correlations between the prevalence of the different welfare outcomes and different carcass lesion outcomes (Supplementary Material S1) ranged from –0.45 to 0.41 for the first weaner stage, from –0.52 to 0.41 for the second weaner stage, and from –0.45 to 0.39 for the finisher stage. Of the possible 96 models to be created, a final 37 models met the requirements for linear regression and were statistically significant (Supplementary Material S2). The R2 ranged from 0.09 to 0.45. As an example, the five final models with the highest R2 within each welfare criteria (absence of prolonged hunger: poor body condition– first weaner stage; comfort around resting: bursitis– second weaner stage; thermal comfort: huddling– first weaner stage; absence of injuries: severe tail lesions– finisher stage; absence of disease: coughing– second weaner stage) are presented in Table 4.
Results of linear regression models for prevalence of poor body condition in the first weaner stage (P < 0.01), bursitis in the second weaning stage (P < 0.01), huddling in the first weaner stage (P < 0.05), severe tail lesions in the finisher stage (P < 0.01), and coughing/pig in the second weaner stage (P < 0.001). The estimate and associated P-value of the prevalence of the different carcass lesion outcomes (%) which were retained in the final model are presented, including the coefficient of determination (R2) for the model
| Welfare outcome | Predictor | Estimate (SE) | P-value | R2 |
|---|---|---|---|---|
| Poor body condition | Intercept | 15.9 (4.61) | 0.30 | |
| Tail lesion score 1 | –0.2 (0.07) | 0.016 | ||
| Skin lesion score 3 | 0.7 (0.34) | 0.063 | ||
| Bursitis | Intercept | 1.4 (0.18) | 0.28 | |
| Skin lesion score 2 | 0.04 (0.011) | 0.004 | ||
| Skin lesion score 3 | –0.22 (0.087) | 0.019 | ||
| Huddling | Intercept | –1.9 (1.65) | 0.30 | |
| Tail lesion score 1 | 0.05 (0.022) | 0.02 | ||
| Skin lesion score 1 | –0.02 (0.011) | 0.16 | ||
| Skin lesion score 3 | 0.20 (0.106) | 0.07 | ||
| Severe tail lesions | Intercept | 7.72 (3.750) | 0.31 | |
| Tail lesion score 1 | –0.10 (0.056) | 0.09 | ||
| Tail lesion score ≥ 3 | 0.48 (0.184) | 0.02 | ||
| Coughing/pig | Intercept | 0.065 (0.0191) | 0.45 | |
| Skin lesion score 1 | –0.001 (0.0004) | 0.0023 | ||
| Skin lesion score 2 | 0.002 (0.0005) | 0.0002 | ||
| Skin lesion score 3 | –0.010 (0.0037) | 0.0095 |
Performance of the Models as Monitoring Tools
Two approaches were taken to evaluate the potential of the models as monitoring tools, namely regression trees and ROC curves. Both methods were used to create a division of farms albeit in different manners. For the regression tree, the division was based on the actual prevalence of the welfare indicator as measured on farm. Regression trees were created for each welfare outcome (Fig. 1) showing the cut-off value for the predictive carcass lesions on each arm of the tree and the associated prevalence of the welfare outcome on farm in each group of farms created.
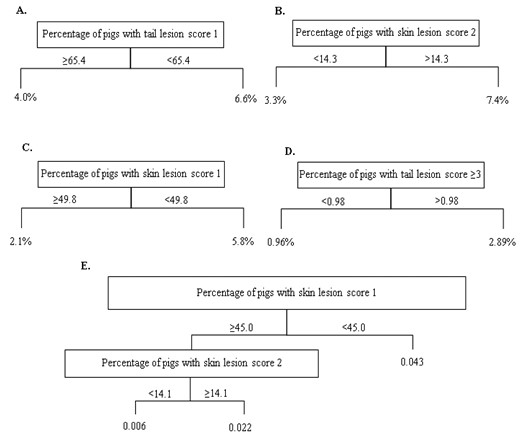
Regression trees for the different welfare outcomes A) the prevalence of pigs with poor body condition in the first weaner stage, B) the prevalence of pigs with bursitis in the second weaner stage, C) the prevalence of huddling pigs in the first weaner stage, D) the prevalence of pigs with severe tail lesions in the finisher stage and E) the frequency of coughing/pig in the second weaner stage. The cut-off value of the carcass lesion shows the best division of farms with the average percentage of pigs affected or frequency given at the end of the arms for the different groups.
To create ROC curves, welfare outcomes were dichotomized based on the 75th percentile (poor body condition– first weaner stage: 7.01%; bursitis– second weaner stage: 5.96%; huddling– first weaner stage: 7.04%; severe tail lesions– finisher stage: 2.94%; coughing– second weaner stage: 0.034 coughs/pig) with farms showing prevalence above this being considered as problem farms. The AUC for the final models ranged from 0.61 (huddling) to 0.82 (bursitis) as shown in Table 5. The AUC of 2 of the models was not significantly different from 0.5, while the remaining three models all were moderately accurate. The optimal cut-off value of the prevalence of the carcass lesion which provided the best combination of sensitivity and specificity are also given (Table 5). As an example ROC curves are shown for the welfare indicators with AUC significantly higher than 0.5: poor body condition in the first weaner stage, bursitis in the second weaner stage and severe tail lesions in the finisher stage (Fig. 2).
Performance [area under the curve (AUC) and 95% CI], sensitivity (Se) and specificity (Sp) at the optimal cut-off value of carcass lesions used to predict the presence of problem farms where the prevalence of the welfare outcome on farm exceeded the 75th percentile of the study farms (poor body condition in the first weaner stage, bursitis in the second weaner stage, huddling in the first weaner stage, severe tail lesions in the finisher stage and frequency of coughing in the second weaner stage)
| Welfare outcome | AUC (95% CI) | Se, % | Sp, % | Optimal cut-off value, % |
|---|---|---|---|---|
| Poor body condition | 0.80 (0.58 to 1.00) | 75 | 87 | 62.4 Tail score 1 |
| Bursitis | 0.82 (0.67 to 0.97) | 100 | 70 | 14.3 Skin score 2 |
| Huddling | 0.61 (0.40 to 0.83)1 | 88 | 61 | 49.1 Skin score 1 |
| Severe tail lesions | 0.81 (0.62 to 1.00) | 88 | 74 | 0.98 Tail score ≥ 3 |
| Coughing/pig | 0.71 (0.45 to 0.96)1 | 100 | 50 | 44.0 Skin score1 |
1Area under the curve (AUC) was not significantly (P > 0.05) higher than 0.5
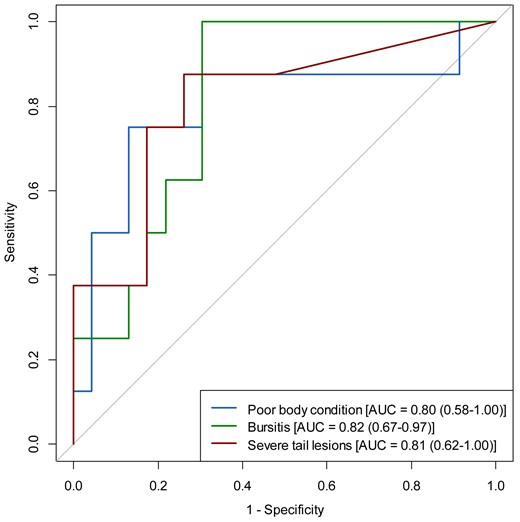
Receiver operating curve (ROC) representing the predictive performance of the model for identifying problem farms ( > 75th percentile) based on the prevalence of carcass lesions for poor body condition in the first weaner stage, bursitis in the second weaner stage and severe tail lesions in the finisher stage. AUC = area under the curve (95% CI); the diagonal line represents an AUC of 0.5.
DISCUSSION
The aim of this study was to explore the potential of carcass lesions recorded at meat inspection for estimating pig welfare on farm. Tail and skin lesions were included as predictor variables to evaluate their potential as ‘iceberg’ indicators (FAWC, 2009; EFSA, 2012), meaning that these relatively simple measurements should function as a warning signal for welfare problems on farm. To the authors' knowledge this is the first study aiming to evaluate the use of carcass lesions at meat inspection as indicators for pig health and welfare in the different production stages on farm.
Several methodological aspects of the current study should be considered when interpreting the results. The study farms were selected based on criteria of record keeping in the Teagasc eProfit Monitor and location of their abattoir for practical purposes. Previous work has shown differences between farms that keep records in the Teagasc eProfit Monitor and those that do not in regards to carcass tail lesions (van Staaveren et al., 2016), suggesting that the sample could be biased. However, the 129 herds that participate in the Teagasc eProfit Monitor represent 65% of the national sow herd (Teagasc, 2016). Additionally, a high response rate (69%) was obtained among the farmers contacted, with similar production figures to those reported for all herds in the Teagasc eProfit Monitor (Teagasc, 2016). As such the 31 study farms provide a representative sample of all herds in the Teagasc eProfit Monitor and approx. 12% of the herds in the country. Further validation with a larger and more representative sample of Irish pig farms would be advantageous; however this work provides a good first indication of the potential value of carcass lesions as indicators for pig health and welfare.
It should be noted that this paper describes associations between welfare outcomes on farm and carcass lesions measured at meat inspection; however, these do not necessarily imply a causal relationship. Both the welfare and abattoir assessment were snapshot observations where the pigs observed at the abattoir were not necessarily the pigs that were observed at the farms. Farmers can use different strategies when sending pigs to slaughter (e.g., send all poor welfare pigs in the same batch or to a different abattoir) and pigs that are euthanized or died on farm due to severe welfare problems might not be seen in the abattoir (Harley et al., 2012a). Additionally, for logistical reasons no information could be collected on the transport conditions of pigs during this study. Previous work showed that carcass lesions did reflect the lesions observed on-farm, though this is likely confounded by transport conditions and carcass processing (Carroll et al., 2015; van Staaveren et al., 2015). The issues described above could explain the relatively low R2 found for many of the welfare outcomes. Future work should focus on longitudinal studies on farm and at the abattoir to determine the value of recording carcass lesions over a longer period of time (e.g., to account for seasonal variation) and whether this method is capable of picking up changes in welfare status of pigs on farm during production.
Originally, the Welfare Quality protocol allowed for classification of farms into 4 categories of welfare (not classified, acceptable, enhanced and excellent; Welfare Quality, 2009). Several authors cautioned against the aggregation of scores as they lead to higher relative importance of certain welfare criteria because of issues in defining thresholds for poor or good welfare (de Vries et al., 2013; de Vries et al., 2014; Heath et al., 2014). In addition, there is a risk of an unbalanced number of farms in the different categories (Krug et al., 2015). Furthermore, creating a welfare index could potentially mask the predictive value of the models when it only explains one of the welfare outcomes but not the aggregation of scores. Therefore, it was decided to use the carcass lesions to predict the welfare outcomes separately as this would provide the most valuable information in this first stage of research into the use of meat inspection data as indicators for pig welfare. To address the ability of carcass lesions to function as iceberg indicators and a warning signal for different welfare problems we decided to focus on welfare outcomes which represented a range of welfare problems (absence of prolonged hunger, comfort around resting, thermal comfort, absence of injuries and absence of disease) as defined by the Welfare Quality (2009).
The recorded carcass lesions were limited to tail and skin lesions due to their importance for pig welfare (EFSA, 2012) and the feasibility of recording them in a commercial abattoir. Specifically, their potential role as ‘iceberg’ indicators depends on the ability of these single measurements to predict a variety of welfare problems on farm (FAWC, 2009). However, when a proper recording system is available there is a possibility of including a variety of other carcass or viscera lesions. Including data from different sources of information could help to improve the predictive value of the models (Nielsen, 2011). Knage-Rasmussen et al. (2015) combined data from three central databases containing meat inspection records, mortality data from rendering plants, and records on medicine use. They found no linear relationship between the welfare index created based on these databases and the welfare index from on-farm assessments. Again, the index could have masked potential relationships between single measurements. The authors' did not assess the potential of the meat inspection records on their own, but always in combination with data from the other databases (Knage-Rasmussen et al., 2015). Data of medicine usage are not necessarily related to the actual occurrence of disease when pigs in an entire batch are treated while not all are affected (Petersen et al., 2008). Routinely collected data need to be appropriate for their intended purpose as reported by Nielsen et al. (2015) who found differences between findings from routine meat inspection and systematic health monitoring. In the current study the same experienced observer recorded the occurrence of carcass lesions with the purpose of welfare assessment, eliminating the bias of recording by meat inspectors. Training and standardization of carcass lesion recording by meat inspectors is needed before routinely collected data from meat inspection can be used for welfare assessment (Bonde et al., 2010; Schleicher et al., 2013; Nielsen et al., 2015).
Performance of the Models as Monitoring Tools
Despite moderate correlations between the prevalence of carcass lesions and welfare outcomes on farm, in general, the percentage of variation observed in the prevalence of the welfare outcome on farm explained by the models ranged from 9% to 45%. This suggests that the recording of carcass lesions at meat inspection has value for assessing pig welfare on farm, though other factors (e.g., management or biosecurity practices, disease status of the pigs etc.) which were not included in the current study could help explain the variation. These models provide valuable information on associations between carcass lesions and welfare indicators on farm, but are less practical for use as monitoring tools by the industry.
Regression trees were created for more practical information regarding the level of carcass lesions that would provide the best division of farms, providing an average prevalence of the welfare outcome in the separate groups of farms. This approach could aid in setting threshold values for carcass lesions during meat inspection after which farms are more likely to have a higher prevalence of certain welfare outcome. Additionally, receiver operating curves were developed to describe the accuracy of the predictive models and the sensitivity and specificity of the monitoring tool. In contrast with the regression tree, this method required the authors to define ‘problem’ farms for each welfare outcome and this was based on the 25 worst scoring farms as per de Vries et al. (2014). Predictions of these welfare outcomes were less to moderately accurate, showing the value of using carcass lesions at meat inspection for assessing pig welfare on farm. However, for the prevalence of huddling and the frequency of coughing the AUC was not significantly different from 0.5 indicating non-informative models. This discrepancy between the relatively high R2 for these models when using the actual prevalence and the lack of predictive value when using a binary scale highlights the issue with assigning good/poor welfare categories. The predictions of the remaining 3 welfare outcomes (poor body condition– first weaner stage: 0.80 AUC, bursitis– second weaner stage: 0.82 AUC, severe tail lesion– finisher stage: 0.81 AUC) were moderately accurate. The cut-off values for the prevalence of the different predictive carcass lesions as determined by both methods (regression trees and ROC curves) were quite similar, suggesting both methods divided the farms rather similarly. This is also supported by the fact that the prevalence of the welfare outcome in the high group of the regression tree was similar to the threshold based on the 75th percentile of farms in the ROC curve method.
Poor body condition was the only welfare outcome recorded in the criteria for absence of prolonged hunger. The model and regression tree for this outcome suggest that on farms where there are relatively low levels of tail biting (i.e., high prevalence of mild tail lesions as opposed to moderate/severe tail lesions), less pigs with poor body condition were observed in the first weaner stage. Smaller pigs often start tail biting (Schrøder-Petersen and Simonsen, 2001). However, Ersbøll et al. (2004) found that weight or growth rates of pigs did not affect tail-in-mouth behavior performed or received. Bursitis in the second stage was best explained by the prevalence of pigs with skin lesion score 2 at meat inspection. Mullan et al. (2009) also found positive associations between the prevalence of body lesions and bursas in finisher pigs, but the reason for this is unclear. The best model for the absence of injuries was that for the prevalence of severe tail lesions in the finisher stage, with the majority of variation explained by the prevalence of severe carcass tail lesions (score 3). This was unsurprising as this outcome is most closely related to the carcass lesions observed at slaughter.
The sensitivity and specificity of correctly identified farms as having a problem or was not calculated for different cut-off values of the prevalence of the predictive carcass lesions. A trade-off exists between sensitivity and specificity and a different importance may be assigned to these depending on the context (de Vries et al., 2014). A consideration has to be made whether it is more unfavorable to miss a proportion of farms with welfare problems (low sensitivity) or incorrectly visiting farms or penalizing farmers when they are classed as having a problem while this is not the case (low specificity; Bonde et al., 2010). In the context of monitoring and helping inform herd health and welfare management plans, a combination where both sensitivity and specificity are optimized is especially useful (de Vries et al., 2014). Using this approach both high levels of sensitivity and specificity were obtained in this study. The sensitivity in this study ranged between 75 and 100%, showing that the majority of farms with problems with poor body condition in the first weaner stage, bursitis in the second weaner stage and severe tail lesions in the finisher stage were detected. Similarly, specificity ranged from 70 to 87% meaning that few farms will be identified as false positives. Future work is needed to determine the cost of welfare assessment by recording carcass lesions at meat inspection, and the cost of failing to identify farms with welfare problems versus the cost of visiting or penalizing farms without actual problems.
Conclusion
This study is the first to explore the potential of using carcass tail and skin lesions as observed during meat inspection for the assessment of pig health and welfare on farm. Both carcass tail and skin lesions were capable of explaining a proportion of the variation in the prevalence of different welfare outcomes on-farm highlighting their potential as iceberg indicators. Different methods were assessed to divide farms regarding the prevalence of welfare outcomes on farm based on the prevalence of carcass lesions observed at meat inspection. Prediction of farms identified as having a problem with poor body condition in the first weaner stage, bursitis in the second weaner stage and severe tail lesions in the finisher stage were moderately accurate with high levels of sensitivity and specificity. Longitudinal studies are needed to evaluate the recording of carcass lesions over a longer period of time and whether it is capable of picking up changes in welfare status of pigs on farm during production. Additionally, an evaluation of the cost of including carcass lesion at meat inspection, cost of missing farms with welfare problems and cost of visiting or penalizing farms without actual problems need to be determined before this can be applied in a commercial setting.
LITERATURE CITED
Footnotes
The authors would like to extend their gratitude to the managers and personnel of the pig farms and abattoirs for kindly allowing us to perform this experiment. Additionally, we would like to thank the Teagasc pig advisory staff for their assistance in farm recruitment and placement students Elise Moussard, Antoine Gai and Laura Failler for their help during data collection. We would also like to express our sincere gratitude to Prof Simon More and Prof Bas Rodenburg for their insightful comments regarding the statistical analysis and manuscript. This study was part of the PIGWELFIND project funded by the Research Stimulus Fund (11/S/107) of the Irish Department of Agriculture, Food and Marine under the National Development Plan (2007-2013). We acknowledge the Walsh Fellowship Scheme for providing funding for Nienke van Staaveren.
