


Abstract
The increased use of cephalosporin antibiotics in the last few years as well as the detection of their residues in wastewater treatment plants and hospital wastewater poses a risk for infiltration of their residues into environmental water samples.
A simplified, sensitive, and convenient solid-phase extraction (SPE) procedure coupled with either HPLC or fast HPLC methods with diode array detection was developed and validated to screen the residues of six different cephalosporin antibiotics: cefoperazone, cefipime, ceftazedime, ceftriaxone, cefdinir, and cefotaxime, along with amoxicillin, levofloxacin, and ciprofloxacin in water samples.
An HPLC–diode array detector (HPLC–DAD) method and a fast HPLC method, based on a core-shell stationary phase, were developed for the fast screening of the antibiotic compounds. In addition, the SPE step was optimized to enable the extraction of the studied drugs with high accuracy of the recovered amounts of residues.
The method sensitivity was enhanced by the coupling of SPE with HPLC–DAD and fast HPLC to achieve low LODs; from 0.2 to 3.8 ng/mL and from 0.65 to 12.2 ng/mL, respectively. The developed methods were augmented by LC–MS/MS determination for confirmation of identity and quantity of any positively identified sample. The method was applied to the analysis of water samples collected from a rural site. In Addition, an example application of cleaning validation of cefotaxime-contaminated stainless-steel surfaces was provided.
The method’s simplicity and high sensitivity encourage its application in monitoring of antibiotic residues in different types of water samples such as environmental samples and samples from cleaning validation activities.
HPLC–DAD and fast HPLC methods were developed for separation of nine different antibiotics. The combination with the SPE procedure achieved low detection limits; from 0.2 to 3.8 ng/mL for SPE–HPLC–DAD and from 0.65 to 12.2 ng/mL for SPE–fast HPLC.
Antibiotics have been used on a large scale to prevent and treat several infectious diseases in both human and veterinary therapeutic practices. Due to their extensive use, there is a potential health risk from their infiltration into environmental water resources. This is attributed to the incidence of microbial resistance and the risk of allergic reactions to antibiotic metabolites and residues that reach the environment. Accordingly, accurate and sensitive analytical methods for monitoring of antibiotic residue levels in different environmental matrixes are required (1, 2). The main sources of antibiotic leakage to the environment are livestock farms, pharmaceutical production sites, hospitals, and from domestic use (3).
Cefotaxime, ceftriaxone, cefepime, cefoperazone, and ceftazidime are third-generation cephalosporins which are administered by a parenteral route. Many methods have been published for determination of these compounds’ residues in wastewater treatment plants and hospital wastes (4–10). Although the potential risk of their infiltration into environmental water samples (11), very few methods have been published for their determination in environmental water samples. Development of a new method for screening of a specific group of compounds in environmental water samples should consider analysis of the expected compounds as well as their levels in the samples (5). In addition, an increased risk of cephalosporin infiltration to the environment may be anticipated due to the increase of cephalosporins use to 26.6% of antibiotics, during the COVID-19 pandemic (12). Therefore, redevelopment of screening methods for specific types of samples should be adopted.
In addition, most of the described works for determination of these residues in different samples applied LC–MS techniques for identity confirmation and quantitation of their residues (13–22). However, due to the high cost of LC-MS establishment and analysis, there were many efforts to apply HPLC–UV methods that may be coupled with extraction techniques for the prior screening of samples to identify suspected samples. This approach is more cost effective regarding the fast and cheap screening of a larger number of samples and the identification of samples with potential positive detection of target residue peaks prior to further confirmation of identity by LC–MS techniques (11, 18–25). Recent efforts for preconcentration of antibiotic residues prior to HPLC–UV analysis included application of liquid–liquid extraction methods, such as the application of salt-assisted liquid–liquid microextraction (SALLME) for determination of sulfonamides and trimethoprim residues in surface water (18) and a polymeric aqueous two-phase extraction system for preconcentration of trace quantities of three fluoroquinolones in environmental water samples (19). These efforts also included the application of nanoparticles, such as magnetic nanoparticle-assisted supramolecular solvent microextraction for preconcentration of sulfonamides and fluoroquinolones in surface water samples (20), and graphene oxide-based dispersive solid-phase extraction (d-SPE) for trace ampicillin and clindamycin in water samples (21). A combination of fiber solid-phase microextraction with porous hollow fiber liquid-phase microextraction was also reported for the preconcentration of amoxicillin, ciprofloxacin, and cefixime prior to HPLC–UV determination (22).
Solid-phase extraction (SPE) is currently the most used extraction technique for extraction and enrichment of many target analytes from different types of samples. The SPE process involves the selective adsorption of the analytes on a solid-phase sorbent matrix through intermolecular forces such as hydrogen bonds, hydrophobic effects, and cation or anion exchange processes followed by elution with a stronger solvent. SPE procedures have the virtue of efficient sample cleanup from unwanted interferences through selectivity tuning as well as ease of automation.
Literature survey for the coupling of SPE with HPLC-UV analysis for determination of cephalosporins in water samples was not abundant as found for SPE-LC-MS methods. Qureshi et al. described the SPE–HPLC–UV determination of cefradine, cefuroxime, and cefotaxime with detection limits from 50 to 250 ng/mL (5). Wang et al. optimized OASIS HLB-based (Hyrophylic-Lipophilic Balanced) SPE preconcentration of five cephalosporin antibiotics. The optimized conditions required preconcentration of up to 500 mL of the water sample through the SPE cartridge to enable detection limits from 0.03 to 0.06 ng/mL with recovery values ranging between 84–99% (11). Opriş et al. applied SPE–HPLC–UV for determination of ceftazidime and ceftriaxone along with some penicillin antibiotics and two tetracyclines from wastewater samples with detection limits of 70–920 ng/mL (13).
The aim of this work is to develop a simplified screening HPLC–DAD procedure coupled with the SPE extraction technique for six cephalosporin antibiotics; cefoperazone (CFP), cefepime (CEF), ceftazidime (CFZ), ceftriaxone (CFX), cefdinir (CDN), and cefotaxime (CTX), in addition to the residues of some of the most widely used antibiotics: amoxicillin (AMX), levofloxacin (LEV), and ciprofloxacin (CIP), in environmental water samples.
In the current work, an SPE procedure was developed for determination of the residues of target antibiotics from spiked water samples with high recovery. A literature survey of the published methods at the time this work started revealed no reports of a SPE procedure coupled with HPLC–DAD (Diode Array Detector) method for the screening of the selected set of antibiotics.
An HPLC–DAD gradient method as well as a fast HPLC method, based on core-shell stationary phase technology, were also developed and applied for detection and quantitation. LC–MS determination of the same samples was performed to confirm the analysis results of the developed method.
Experimental
Materials and Reagents
The following active pharmaceutical ingredients were kindly provided by Medical Union Pharmaceuticals Co. (MUP, Ismailia, Egypt) with labeled potencies as follows (compound; potency): AMX; 99.6% on dried basis, LEV; 100.04% on as-is basis, CIP; 101.03% on as-is basis, CFP; 92.4% on dried basis, CFZ; 86.0% on dried basis, CEF; 82.6% on dried basis, CFX; 88.65% on dried basis, and CTX; 94.6% on dried basis. The working active pharmaceutical ingredient of CDN was kindly supplied by ADWIA Co. (10th of Ramadan, Sharkia, Egypt) with a labeled potency of 100%. Acetonitrile and methanol were HPLC grade (Scharlau S.L., Barcelona, Spain). The water used for HPLC was distilled and filtered through a 0.45 µm nylon filter. Formic acid was analytical grade (Merck, Darmstadt, Germany). Strata™-X 200 mg/3 cc SPE cartridges for sample pretreatment were obtained from Phenomenex (Torrance, CA, USA). A homemade vacuum system connected to a vacuum pump was used for elution of solvents from SPE cartridges.
Standard Solutions and Calibration Curve
Portions of about 20 mg of each compound were weighed into a 100 mL volumetric flask, recording the weight accurately. The weighed materials were dissolved with water to 100 mL with the aid of ultrasonic irradiation to obtain a stock solution with a nominal concentration of 0.2 mg/mL of each compound. This solution was stored in a refrigerator (2–8°C) for further analysis for up to 24 h. The standard calibration curve solutions were prepared by further dilution of this stock solution with distilled water to obtain nine different concentration levels from 0.04 µg/mL to 3.28 µg/mL. The calibration curve solutions were each analyzed in triplicate for calibration curve construction.
Water Sample Extraction
SPE cartridges were first preconditioned by passing 1 mL methanol followed by 1 mL distilled water through them. The water samples were then passed through the cartridges at a flow rate of approximately 1 mL/min and a total sample volume of 50 mL, then rinsed with 1 mL distilled water. The adsorbed analytes were recovered by passing 2.5 mL methanol followed by 2.5 mL distilled water through with mixing of the methanolic and aqueous extracts. The recovered extracts were evaporated to dryness using a nitrogen stream then reconstituted with 1 mL methanol.
Cleaning Validation Example Sample Preparation
A solution of 100 µg/mL CFX was applied to three separate stainless-steel surfaces A, B, and C (each of area 5 cm × 5 cm) to produce a residue layer of 400 ng/cm2 of CFX as a contaminant for the surface. The dopped surfaces were left to dry then one surface (A) was swabbed with a cotton swab then the swab content was dissolved into 25 mL distilled water and injected directly into the HPLC–DAD system.
The other surfaces, B and C, were cleaned by flushing with water till no physical residue of surface contaminants remained then both the surfaces were swabbed. The swab content corresponding to surface B was dissolved into 25 mL distilled water then injected directly into the HPLC–DAD system. On the other hand, the swab content corresponding to surface C was dissolved into 25 mL distilled water then extracted by the SPE procedure previously described before injection to the HPLC–DAD system.
The amount of CFX residue recovered from the cleaned surface can be calculated from the peak area corresponding to swab C (cleaned surface) and peak area corresponding to swab A (cleaned surface) through the following equation:
HPLC–DAD Chromatographic Conditions
The HPLC or fast HPLC methods used gradient elution conditions with 0.1% formic acid in water as mobile phase A and a mixture of acetonitrile–methanol (40 + 60, by volume) as mobile phase B. All gradient runs were performed at 25 °C with UV detection at 254 nm and calculations were based on peak area.
Regarding the conventional HPLC separation, we used a Shimadzu Prominence HPLC gradient system (Shimadzu, Koyoto, Japan) equipped with a LC-20AD pump, Shimadzu FCV-20A low-pressure gradient flow control valve, Shimadzu CBM-20Alite system controller, DGU-20 A5 on-line degasser, SIL-20A auto sampler, and CTO-20 A column oven. Detection was performed by measurement of UV absorbance by photodiode array detector (SPD-M10). Instrument control, data acquisition, and processing were performed with LC LabSolution® software. An Agilent-HC® C18, 150 mm length, 4.6 mm inner diameter and 5 µm particle size analytical column was selected as a stationary phase. The gradient program started with the initial value of mobile phase B at 7% then it was raised up to 20% over 10 mi, held at 20% for another 10 min then returned to 7% and held for another 4 min for re-equilibration. The flow rate was maintained at 2.0 mL/min throughout the gradient run. The injection volume was 20 µL.
Regarding the fast HPLC method, an Agilent 1100/1200 series low-pressure gradient HPLC modular system (Agilent Technologies, Inc., Santa Clara, CA, United States) was applied. The system was composed of the following modules: Quat Pump-G1311A low-pressure gradient quaternary pump, TCC-G1316A thermostated column compartment, ALS sampler G1329A, and 1260-Degasser-G7122A online degasser. Detection was performed by measurement of UV absorbance using a MWD-G1565B multi-wavelength detector with DAD photodiode detector tube upgrade. The instrument was modified by installation of a semi-micro flow cell of 6 mm path, a micro needle seat of reduced extracolumn volume, and 0.1 mm inner diameter tubes dedicated for fast HPLC operations. A Kinetix® C18, 50 mm length × 3.0 mm inner diameter, 2.6 µm particle size column of core-shell technology, was used. The gradient program started at a flow rate of 1.0 m/min with an initial value of 7% mobile phase B and reached 20% over 6.7 min from the run start then held constant at 20% for 1.3 min before it returned to 7% and was held for 0.5 min for re-equilibration. The injection volume was 5 µL. System control, data acquisition, and processing were performed with Agilent Chemstation® software.
LC–MS Chromatographic Conditions
The samples were analyzed using an Agilent 1260 series HPLC equipped with a DAD and Agilent 6460 mass spectrometer consisted of triple-quad mass spectrometer (Model K6460) with electrospray ionization (ESI) and atmospheric pressure chemical ionization (APCI) at atmospheric pressure. Samples and standards solution were separated on a 100 mm length × 4.6 mm inner diameter Zorbax Eclipse Plus® C18 analytical column with 3.5 µm particle size.
The generic gradient program for LC–MS/MS separation was performed using water containing 0.1% formic acid and 6 mM ammonium formate as mobile phase A and acetonitrile as mobile phase B. The gradient program started at 2% mobile phase B and increased %B in the following steps: reaching 10% in 5.1 min, then to 40% till 7.0 min, then to 60% till 9.0 min, then to 80% till 10.0 min, then to 100% till 12.0 min, then held at 100% till 14.0 min from the run start time. Finally, %B was returned to 2% within 1 min and kept at this value for another 2 min for re-equilibration before starting a new run. The flow rate was maintained at 0.4 mL/min throughout the gradient run. The injection volume was 10 µL.
ESI and multiple reaction monitoring mode (MRM) were used to obtain total ion chromatograms (TICs) for the target analytes. The protonated molecular ion [M + H]+ from all of the compounds was acquired except for CTX where the negative ion [M−H]− was acquired. At least one confirming daughter fragment ion was acquired for each source ion of each compound. Parameters for LC–MS/MS scan segments are given in Supplemental Table S1. The described method has been applied to river and well water samples spiked with 2.5 µg/ml of each of the studied compounds.
Results and Discussion
Optimization of HPLC and Fast HPLC Operating Conditions
Optimization of conventional HPLC system.—The main objectives for the chromatographic method development were predefined as the achievement of a minimum resolution of the separated analytes of not less than 1.5 within a short analysis time. Low solvent consumption and high sensitivity were also considered as development goals.
During the conventional HPLC method optimization trials, two aqueous solvents; 0.1% formic acid and 20 mM ammonium acetate, and two organic solvents, acetonitrile and methanol, were tested. All trials were performed at a column temperature of 25°C, UV detection at 254 nm, and a flow rate of 2.0 mL/min.
Isocratic elution trials were performed at first as it is proposed to be more convenient and more robust than gradient methods. Isocratic trials were performed with different combinations of either 0.1% formic acid in water or 20 mM ammonium acetate as aqueous mobile phase portion with either methanol or acetonitrile as organic mobile phase.
Isocratic trials with 0.1% acqueous formic acid–methanol (9+1, by volume), gave a bad separation as only six peaks out of nine peaks were separated, and with high column backpressure and long run time (60 min). Trials with replacement of 0.1% formic acid with 20 mM ammonium acetate resulted in a similar chromatogram of only six resolved peaks at very long run time (60 min) and high backpressure with peaks of poor sensitivity.
On the other hand, isocratic trials with 0.1% formic acid in water–acetonitrile (9:1, by volume), gave bad separation as the resulting chromatogram separated only five peaks out of nine with low resolution of the peaks. However, column backpressure values from acetonitrile isocratic trials were lower than those from methanol-based trials.
Accordingly, all isocratic elution trials resulted in poor separation of peaks with prolonged run time especially for trials with methanol which resulted also in higher backpressure. This was attributed to the diverse polarity and hydrophobicity values of the studied compounds. In addition, isocratic elution produced peaks with decreased sharpness by increasing the retention time which had negative impact on detection sensitivity. Therefore, the gradient elution mode was adopted to enable separation of compounds with diverse polarities at high resolution in a practical run time. In addition, gradient elution produces peaks of high sharpness and therefore higher detection sensitivity can be obtained.
Different settings of gradient program were tried, and the best tested settings were found to be obtained with 0.1% formic acid in water as mobile phase A and a mixture of acetonitrile and methanol (in ratio of 40:60 v/v) as mobile phase B with the gradient program described in Experimental. A chromatogram with good resolution of all nine compound peaks in less than 15 min was obtained (Figure 1). The chromatographic descriptors of the resulting chromatogram were calculated and were found to satisfy general goals of chromatographic method development (Table 1) with minimum resolution of about 1.548 for the CTX peak with the LEV peak.
Optimization of fast HPLC system.—To investigate the ability to develop a fast HPLC method, the method was transferred to a stationary phase of core-shell technology with reduced dimensions as described in Experimental. Application of core-shell stationary phases enables the achievement of higher peak efficiency and resolution at lower backpressures due to restricted mobile phase diffusion to the minimal portion of the stationary phase particles shells. This technology enables application of methods with high efficiencies with high resolution within very short runtimes on conventional HPLC instruments. Therefore, ultra-performance liquid chromatography (UPLC)-like method performance can be obtained with an affordable budget on legacy HPLC systems.
To enable the use of core-shell stationary phase columns on legacy HPLC systems, the extra-column volume of the HPLC instrument has to be minimized at first. In this work, we replaced the detector flow cell, autosampler needle seat, sampler-to-column tubing and column outlet-to-detector tubing with items of the minimal internal volume to reduce extra-column peak broadening, thus preserving the high resolution and efficiency obtained by core-shell stationary phases.
The same gradient conditions as in the developed conventional HPLC method were initially applied on the core-shell column after recalculations of the gradient program time steps. This was done by multiplication of each time point (T) in the gradient program by the following factor:Column void volume was calculated from column dimensions and stationary phase package porosity (an average value of 65% for totally porous particles and 49% for core-shell particles) by the following equation (26):However, due to selectivity differences between the conventional HPLC column (Agilent HC-C18) and the applied fast HPLC core-shell column (Kinitix C18 column), the gradient time program required a longer gradient program to attain acceptable peak separation.
According to the adjustment trials, a gradient program starting with 7% and rising to 20% of mobile phase B within 6.7 min resulted in a good chromatogram with the nine peaks well separated within only 8 min with a minimum resolution of 1.66 between AMX and CEF peaks as shown in Figure 2. System suitability is summarized in Table 1.
The developed fast HPLC system provided the opportunity for achieving a fast and sensitive separation within a very short time on conventional HPLC instruments by affordable investment in instrument modification.
Optimization of solid-phase extraction.—Three different eluent compositions were tested for recovery of the adsorbed compounds from the Strata-X SPE cartridges. Strata-X was selected as SPE phase according to preliminary comparison of the application note data for the commercially available SPE packages previously applied for the studied compounds. Strata-X was selected as it was claimed to provide efficient extraction and cleaning of diverse neutral, acidic, or basic compounds with polar moieties and was thus suitable for the studied compounds. In all trials, the cartridges were first conditioned with 1 mL methanol followed with 1 mL water. The 50 mL water sample was then passed through at a flow rate of approximately 1 mL/min. The eluent of each trial was evaporated to dryness using a nitrogen stream and the residue was reconstituted again with 1 mL methanol. The approaches’ trial results were as follows (summarized in Figure 3):
Using 5 mL acetonitrile as eluent: poor recoveries (14–62%) were obtained for all the compounds.
The application of 5mL methanol for elution resulted in higher recovery percentages than the first trial with acetonitrile for all analytes (32–99%). However, the recovery values of CEF, AMX, CFZ, CFX, and CTX were below 80%. From this trial, switching from acetonitrile to methanol, it was expected that increasing the eluent polarity would increase the recovery percentages (Figure 3).
According to the previous results, water was added as a solvent with a higher polarity. The adsorbed analytes were eluted by 2.5 mL methanol followed by 2.5 mL water. All analytes had an acceptable percentage recovery (>95%).
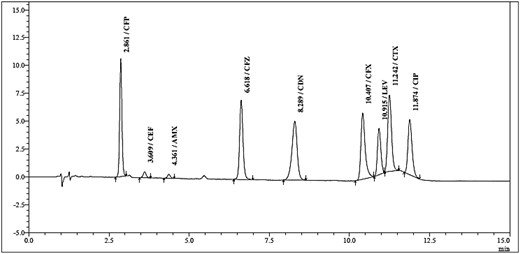
HPLC–DAD method chromatogram of a standard solution of antibiotics.
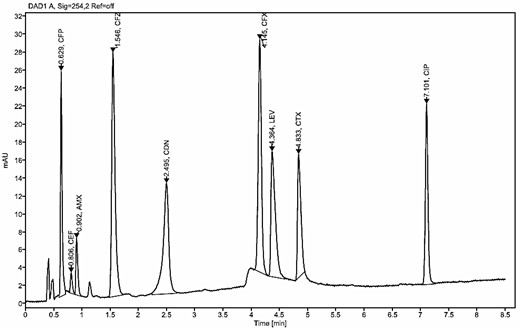
Fast HPLC–DAD method chromatogram of the standard solution of antibiotics.
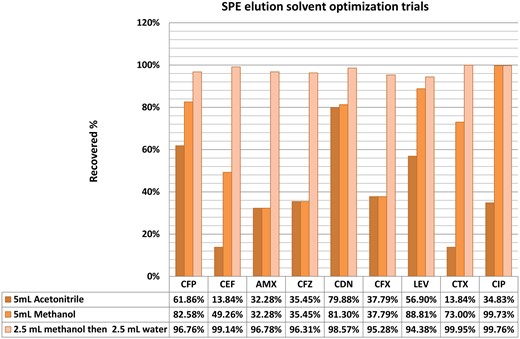
Optimization trials for eluent composition for the SPE procedure.
System suitability test results of the developed HPLC and fast HPLC methods for determination of CFP, CEF, AMX, CFZ, CDN, CFX, LEV, CTX, and CIP
| Compound | HPLC method | Fast HPLC method | ||||
|---|---|---|---|---|---|---|
| Retention time, min | Selectivity (α) | Resolution (Rs) | Retention time, min | Selectivity (α) | Resolution (Rs) | |
| CFP | 2.861 | Not calcualted | Not calcualted | 0.629 | Not Calcualted | Not Calcualted |
| CEF | 3.609 | 1.28 | 4.536 | 0.806 | 1.28 | 3.44 |
| AMX | 4.361 | 1.12 | 4.055 | 0.902 | 1.12 | 1.66 |
| CFZ | 6.618 | 1.36 | 5.782 | 1.546 | 1.36 | 4.99 |
| CDN | 8.289 | 1.61 | 6.518 | 2.495 | 1.61 | 7.47 |
| CFX | 10.407 | 1.66 | 7.790 | 4.145 | 1.66 | 13.05 |
| LEV | 10.915 | 1.05 | 2.325 | 4.364 | 1.05 | 1.83 |
| CTX | 11.242 | 1.11 | 1.548 | 4.833 | 1.11 | 3.71 |
| CIP | 11.874 | 1.47 | 2.702 | 7.101 | 1.47 | 23.23 |
These findings augmented the hypothesis derived from the previous steps. Also, of the possible interactions between the polymeric adsorbing phase and the studied compounds, hydrogen bonding interactions predominate and therefore more polar solvents can provide more competitive eluents for the studied compounds (seeSupplemental Table S2).
According to these results, the eluent composed of 2.5 mL methanol followed by 2.5 mL water was selected for elution in the SPE procedure. A chromatogram of a water sample spiked with the antibiotic standard solution at a level of 0.25 µg/mL is provided (Figure 4).
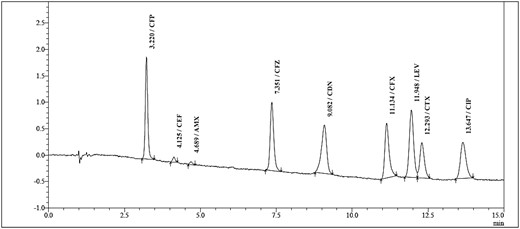
SPE-HPLC chromatogram of a water sample spiked with the standard solution of antibiotics at a spiking concentration of 0.25 µg/mL.
Validation Study
Both methods, HPLC–DAD and fast HPLC, were validated according to International Conference of harmonization (ICH) guidelines regarding linearity, range, LODs, and LOQs, while the SPE procedure was validated for repeatability and recovery through the complete SPE–HPLC–DAD procedure.
Linearity and range.— The linearity of the HPLC–DAD system was confirmed from the regression analysis of the standard curve of the studied compounds. Linearity was evaluated by analyzing nine different concentrations of each compound ranging between about 0.04 µg/mL to about 3.3 µg/mL. Triplicate injections of 20 µL were made for each concentration and analyzed under the specified HPLC conditions. Regression analysis of the acquired peak areas against corresponding concentrations for each compound resulted in high correlation coefficients (r2 >0.998) indicating the linearity of the method (Table 2).
The linearity of the fast HPLC system was confirmed by injection of standard curve solutions within the range of 0.076 µg/mL to about 2.4 µg/mL and recording the peak area for further regression analysis. Linearity of the method was indicated by the high correlation coefficients (r2 >0.996; Table 3).
The LODs and LOQs of both SPE–HPLC–DAD and SPE–fast HPLC procedures were estimated by the S/N method. A water sample originally free from any antibiotic was spiked in the range of 70–200 ng/mL for each compound (seeSupplemental Figure S1). The spiked sample was determined by both SPE–HPLC–DAD and SPE–fast HPLC procedures. Average S/N values (5–6 replicates) were acquired by the chromatographic data processing software of both HPLC–DAD and fast HPLC systems for the examined chromatograms. LOD and LOQ were calculated from the average of the acquired S/N values from the following equations:For the SPE–HPLC–DAD procedure, LODs were estimated to range from 0.2 ng/mL for CDN to 3.8 ng/mL for LEV. Subsequently, LOQ estimates for the whole procedure ranged from 0.6 ng/mL for CDN to 12.8 ng/mL for LEV. On the other hand, for the SPE–fast HPLC procedure, LODs were estimated to range from 0.65 ng/mL for CDN to 12.2 ng/mL for CFX. Subsequently, LOQ estimates for the whole procedure ranged from 2.2 ng/mL for CDN to 40.7 ng/mL for CFX (Table 5).
These low values of LOD and LOQ for both procedures, in combination with the ease of sample preparation, provide an advantage for the developed methods.
Since the SPE–HPLC–DAD system provided the lower LODs, precision and recovery studies for SPE procedure validation were performed using the HPLC–DAD system for determination. An additional rational for this decision was that the major cause of the variability in the whole procedure would originate from the SPE procedure rather than the determination by HPLC.
Selectivity.—The method selectivity of the HPLC–DAD system was demonstrated by analysis of spiked water samples and examination of the spectral purity of each separated peak. Diode array examination and spectral purity calculations for each peak confirmed the spectral purity of the separated compounds (seeSupplemental Figure S2). The resolution of the analytes from other potential components such as impurities or degradation products indicated good selectivity. The method selectivity of the fast HPLC system was similarly demonstrated by the resolution of analyte peaks from any other adjacent compounds.
Precision and recovery.—Intra-day precision was confirmed for the SPE–HPLC–DAD procedure by repeated analysis of spiked water samples at three concentration levels; 0.25, 1, and 2 µg/mL of each compound each with three independent extraction procedures for three independent samples. The intra-day precision RSD of recovery percentages ranged from 0.74 to 1.80% for all recovered compounds with average recovery ranging from 98.5 to 100.2%. Inter-day precision involved the evaluation of recovery results of repeated analysis over two consecutive days. The second day precision RSD of recovery percentages ranged from 0.67 to 1.63% with average recoveries ranging from 98.69 to 100.4% (Table 4). These recovery values, both averages and RSD, indicated the precision of the method as well as the complete recovery of the extracted analytes from samples.
Injected solution stability.—The stability of the standard solution peak area was evaluated by repeated injection of a standard solution kept in a capped vial inside the HPLC–DAD system autoinjector tray at ambient conditions (24± 2°C) with recording of peak area. The peak area change upon repeated injection of the standard solution over the storage time periods was insignificant for 24 h at ambient conditions (seeSupplemental Figure S3). These results indicated the stability of the injected solutions within the specified time periods and storage conditions. These results supported the validity of the results obtained by overnight injection of many samples and therefore encouraged the daily analysis of more samples.
Characteristic parameters of the calibration curve equations for HPLC–DAD; Y = a + bC, where C is the concentration of compound in µg/mL and Y is the peak area
| Parameters | CFP | CEF | AMX | CFZ | CDN | CFX | LEV | CTX | CIP |
|---|---|---|---|---|---|---|---|---|---|
| Calibration range, µg/mL | 0.05–2.5 | 0.04–2.2 | 0.04–2.2 | 0.04–2.0 | 0.05–2.7 | 0.05–2.2 | 0.05–2.6 | 0.06–3.0 | 0.07–3.3 |
| Slope (b) | 110.5 × 10³ | 5.4 × 10³ | 8.4 × 10³ | 132.5 × 10³ | 116.2 × 10³ | 78.9 × 10³ | 134.9 × 10³ | 95.1 × 10³ | 108.3 × 10³ |
| SD of Slope | 96.2 | 1.6 | 115.1 | 150.7 | 98.5 | 115.5 | 2048.1 | 1566.1 | 1156.3 |
| Intercept (a) | 264.6 | 0.77 | −275.0 | 0.84 | −591.4 | 50.2 | 1594.4 | 2262.2 | −2095.9 |
| SD of Intercept | 90.7 | 1.40 | 95.4 | 116.5 | 100.7 | 99.1 | 2054.1 | 1826.9 | 1461.0 |
| Regression coefficient (r2) | 0.9999 | 0.9999 | 0.9986 | 0.9999 | 0.9999 | 0.9999 | 0.9984 | 0.9981 | 0.9992 |
Characteristic parameters of the calibration curve equations for Fast HPLC methods; Y = a + bC, where C is the concentration of compound in µg/mL and Y is the peak area
| Parameters | CFP | CEF | AMX | CFZ | CDN | CFX | LEV | CTX | CIP |
|---|---|---|---|---|---|---|---|---|---|
| Calibration range, µg/mL | 0.1–1.2 | 0.08–1.0 | 0.07–0.86 | 0.08–0.9 | 0.08–1.01 | 0.09–1.08 | 0.09–1.09 | 0.1–1.15 | 0.2–2.4 |
| Slope (b) | 333.2 | 35.3 | 297.1 | 167.4 | 1532.7 | 86.2 | 1802.2 | 919.2 | 192.5 |
| SD of Slope | 0.85 | 6.3 | 5.3 | 4.8 | 4.8 | 2.2 | 47.8 | 30.7 | 3.0 |
| Intercept (a) | 1.45 | 5.03 | −0.234 | −0.09 | 1.96 | 0.26 | 25.9 | 25.03 | 0.22 |
| SD of Intercept | 0.61 | 3.66 | 2.72 | 2.65 | 2.88 | 1.40 | 31.4 | 21.3 | 4.33 |
| Regression coefficient (r2) | 0.999967 | 0.99963 | 0.99844 | 0.99586 | 0.99995 | 0.99689 | 0.99649 | 0.99446 | 0.99877 |
Precision and recovery using the developed SPE–HPLC–DAD method
| Concentration, µg/mL | Day 1 | Day2 | |||
|---|---|---|---|---|---|
| Recovery, % | RSD, % | Recovery, % | RSD, % | ||
| CFP | 0.25 | 99.4 | 1.33 | 98.7 | 1.52 |
| 1 | 99.7 | 1.26 | 99.2 | 1.44 | |
| 2 | 98.8 | 1.18 | 100.4 | 1.63 | |
| CEF | 0.25 | 99.7 | 0.97 | 100.1 | 1.57 |
| 1 | 99.9 | 1.80 | 99.4 | 0.82 | |
| 2 | 99.9 | 1.71 | 99.6 | 0.97 | |
| AMX | 0.25 | 99.0 | 1.18 | 98.9 | 1.29 |
| 1 | 98.5 | 0.85 | 100.1 | 1.35 | |
| 2 | 99.1 | 0.97 | 99.3 | 0.99 | |
| CFZ | 0.25 | 98.7 | 1.33 | 99.9 | 0.94 |
| 1 | 99.2 | 1.12 | 99.0 | 1.31 | |
| 2 | 99.4 | 0.74 | 99.7 | 1.11 | |
| CDN | 0.25 | 98.8 | 1.45 | 100.2 | 1.56 |
| 1 | 99.9 | 1.39 | 99.5 | 0.88 | |
| 2 | 99.4 | 0.77 | 98.8 | 1.25 | |
| CFX | 0.25 | 100.2 | 1.12 | 99.7 | 0.93 |
| 1 | 99.5 | 0.97 | 99.8 | 1.07 | |
| 2 | 99.4 | 1.03 | 99.4 | 1.33 | |
| LEV | 0.25 | 99.6 | 1.33 | 99.2 | 0.67 |
| 1 | 99.0 | 1.11 | 98.8 | 1.08 | |
| 2 | 99.4 | 1.23 | 99.0 | 1.51 | |
| CTX | 0.25 | 98.8 | 1.41 | 100.1 | 1.36 |
| 1 | 100.1 | 1.62 | 99.5 | 1.13 | |
| 2 | 99.7 | 1.09 | 99.7 | 1.16 | |
| CIP | 0.25 | 100.0 | 0.91 | 99.5 | 1.24 |
| 1 | 99.1 | 1.28 | 99.2 | 0.75 | |
| 2 | 99.8 | 1.34 | 99.3 | 1.01 | |
LODs and LOQs calculated from average S/N values acquired from a spiked water sample for both SPE–HPLC–DAD and SPE–fast HPLC methods
| Compound | Spiking concn, ng/mL | SPE–HPLC–DAD | SPE–fast HPLC | ||||
|---|---|---|---|---|---|---|---|
| S/N | LOD | LOQ | S/N | LOD | LOQ | ||
| CFP | 98.8 | 368.9 | 0.80 | 2.68 | 93.2 | 3.2 | 10.6 |
| CEF | 80.1 | 467.1 | 0.51 | 1.71 | 71.0 | 3.4 | 11.3 |
| AMX | 71.6 | 71.1 | 3.02 | 10.06 | 32.3 | 6.7 | 22.2 |
| CFZ | 76.1 | 79.6 | 2.87 | 9.56 | 57.8 | 4.0 | 13.2 |
| CDN | 84.0 | 1350.1 | 0.19 | 0.62 | 388.4 | 0.65 | 2.2 |
| CFX | 90.2 | 698.5 | 0.39 | 1.29 | 22.2 | 12.2 | 40.7 |
| LEV | 90.8 | 71.0 | 3.83 | 12.78 | 249.3 | 1.1 | 3.6 |
| CTX | 96.2 | 814.8 | 0.35 | 1.18 | 169.4 | 1.7 | 5.7 |
| CIP | 198.4 | 353.4 | 1.68 | 5.61 | 150.2 | 4.0 | 13.2 |
Confirmatory LC–MS Method
An additional LC–MS/MS method was provided to confirm the sample analysis by SPE–HPLC–DAD and SPE–fast HPLC and to provide identity confirmation of the recovered analytes in case of samples of positive identification of any tested compound. Spiked river and well water samples were analyzed by a generic LC–MS/MS method to determine the residue recovery for the spiked antibiotics. The responses of the recovered compounds were recorded as described as TICs (seeSupplemental Figure S4).
The recoveries using the LC–MS/MS system were found to range from 97.2 to 99.4% for spiked river samples and from 97.3 to 99.8% for spiked well samples over a concentration range of 0.2–0.44 ng/mL for the tested compounds (SeeSupplemental Table S3). The obtained recovery data of LC–MS/MS showed no significant difference from those obtained from the proposed SPE–HPLC–DAD method.
Accordingly, the LC–MS/MS method enables identity confirmation and verification of determined antibiotic residue amounts for the samples of positive identification by either SPE-HPLC-DAD or SPE-Fast HPLC procedures.
Analysis of Real Samples
Environmental water samples.—Real water samples were analyzed using the SPE–HPLC-DAD method. The SPE–HPLC–DAD system was selected by virtue of its low LOD and LOQ estimated values. Two samples were collected from a rural site at Abo-Balah village (Ismailia governorate, Egypt). The village was located about 10 km from three pharmaceutical factories and about 6 km from poultry farms. One sample (well sample) was collected from a household deep well (7 m depth) used for domestic purposes. The other sample (canal sample) was collected from an irrigation canal in the same village (1 m from the canal bank). The samples were tested to confirm suitability of water use regarding the tested compounds.
SPE of the provided water samples was performed by the developed procedure followed by determination using the HPLC–DAD method. No antibiotic residues of the studied compounds were detected in either sample (seeSupplemental Figure S5a and b). The results indicated the absence of the studied antibiotics in the water samples within the LOD of the applied method.
Application to cleaning validation samples.—One potential application of the developed method is cleaning validation analysis. The following example illustrated the potential application of the SPE–HPLC–DAD method for this purpose.
Direct HPLC–DAD analysis of CFX residues in solutions of swabs taken from the uncleaned surface A produced a peak area that corresponded to the swab retrieved amount from an initially loaded surface with 400 ng/cm2 of CFX residues. Direct HPLC–DAD analysis of swab B content did not produce a reliable response for quantitation as it was not detectable. However, SPE extraction of swab content C prior to HPLC–UV analysis produced a peak area corresponding to about 17.93 ng/cm2 of CFX. These results indicated the potential applicability of the proposed SPE–HPLC–DAD method in cleaning validation for surfaces contaminated with the studied antibiotics (seeSupplemental Figure S6).
Conclusions
The proposed SPE–HPLC–DAD method provided a simple, reproducible, and accurate quantitative analysis of CFP, CEF, AMX, CFZ, CDN, CFX, LEV, CTX, and CIP residues in water samples. The method has been validated according to the ICH recommendations and proved suitable and convenient in application. The recovery of the method was comparable to the values obtained from LC–MS analysis of spiked water samples.
The simplicity, combined with the low LODs and LOQs, provided added benefits of the method for screening of the studied drugs residues in water samples. Beside the application in environmental analysis, this method could be applied to the monitoring of antibiotic residues in swab and rinse water samples from cleaning validation activities in pharmaceutical production lines.
Also, a fast HPLC method was developed for the same separation in the context of this work. The development of the later method demonstrated the feasibility of the application of core-shell technology stationary phases with an affordable budget for legacy HPLC system modification. This would enable separations close to UPLC performance with affordable investment in available laboratory instrumentation.
CRediT Author Statement
Rania Mahmoud: Conceptualization, Methodology, Data curation, Formal analysis—Validation—Writing—original draft. Ghada Hadad: Methodology, Supervision, Writing—review & editing. Randa Abdel-Salam: Methodology, Supervision, Writing—review & editing. Hatem Mokhtar: Methodology, visualization- Writing—review & editing.
Acknowledgments
We acknowledge Medical Union Pharmaceutical Co. (Abu-Sultan, Ismailia, Egypt) and ADWIA Co. (10th of Ramadan, Sharkia, Egypt) for provision of working reference materials. We also acknowledge Medical Union Pharmaceutical Co. for facilitating HPLC analysis.
Conflict of Interest
All authors declare no conflict of interest.
Funding
The authors declare that no funds, grants, or other support were received during the preparation of this manuscript.
Supplemental Information
Supplemental information is available on the J. AOAC Int. website.
