


Abstract
The KangarooSci® Aerobic Count Plate (ACP) is a sample-ready culture medium system for direct counting of aerobic bacteria colonies after 48–72 h of incubation.
The KangarooSci ACP was evaluated for AOAC Performance Tested MethodsSM certification.
The KangarooSci ACP was evaluated through matrix studies and product consistency/stability study and robustness testing. For the matrix study, nine food products (nonfat dry milk powder, fresh raw bovine milk, pasteurized liquid bovine milk, fresh raw ground beef, frozen uncooked chicken breast, cooked shredded pork, apple juice, ice cream, and fresh strawberries), and one environmental surface (stainless steel) were evaluated following the KangarooSci ACP product instructions and compared to the ISO 4833–1:2013, Microbiology of food and animal feeding stuffs—Horizontal methods for the enumeration of microorganisms—Part 1: Colony count at 30 °C by the pour plate technique reference standard. The product consistency and stability testing evaluated three separate production lots of the KangarooSci ACP. The robustness testing examined three test parameters, volume of sample plated, incubation time, and incubation temperature, using a factorial study design.
Results from the matrix study demonstrated equivalent performance between the KangarooSci ACP and the ISO 4833–1:2013 reference standard. The product consistency and stability testing showed that the performance of the assay was equivalent over time up to 12 months and between production lots. Minor changes to the operational test conditions showed no significant impact on performance during the robustness testing.
The KangarooSci ACP is an effective method for aerobic plate count for all matrixes evaluated.
The KangarooSci ACP allows for fast, reliable enumeration of aerobic bacteria. Utilizing the alternative method takes up less space in incubators, requires no sample spreader, and requires fewer consumables compared to the reference method.
General Information
Total aerobic plate counts can be used as an indicator of aerobic microbial contamination, not an indicator of pathogenic bacteria, reflecting the hygienic condition of food and food processing environments. The total aerobic count can be an indicator of the amount of microbial contamination present, allowing corrective action to be taken during the production process as needed.
Cultural reference methods using plate count agar poured into Petri dishes are widely accepted in the field of food microbiology and are still used today (1, 2). However, these traditional culture methods have some shortcomings in that the plates take extra time to prepare and experimental operation, and they are not easily stackable and storable.
Principle
The KangarooSci® Aerobic Count Plate (ACP) is a sample-ready culture system for the counting of mesophilic aerobic bacteria after 48–72 h. The KangarooSci ACP contains a ready-made dry medium with tryptone, yeast extract powder, glucose, and cold-water soluble gelling agent, and an indicator. The tryptone provides a carbon and nitrogen source, the yeast extract powder provides vitamin B, the glucose provides an energy source, and the cold-water soluble gelling agent is a coagulator of the culture medium. The indicator allows for a red color change when colony growth is present. The KangarooSci ACP plates can be counted manually or through an automated plate count instrument and software.
Scope of Method
Analytes.—Mesophilic aerobic bacteria.
Matrixes.—Nonfat dry milk (NFDM) powder, fresh raw bovine milk (4% fat), pasteurized liquid bovine milk (2% fat), fresh raw ground beef (80% lean), frozen uncooked chicken breast, cooked shredded pork, apple juice, ice cream, fresh strawberries, and stainless steel environmental surface (18 GA [gauge], 300 series, brush finish, NSF certified].
Summary of validated performance claims.—The study data indicate with 95% confidence that the performance of the KangarooSci ACP is equivalent to the ISO 4833-1:2013, Microbiology of the food chain—Horizontal method for the enumeration of microorganisms—Part 1: Colony count at 30°C by the pour plate technique reference standard (1) for the matrixes evaluated.
Definitions
Difference of means.—Difference in log10 of the average results between the candidate and reference method for one level of contamination.
Repeatability.—Precision where independent test results are obtained with the same method on equivalent test items in the same laboratory by the same operator using the same equipment within a short interval of time.
Standard error.—A measure of the statistical accuracy of an estimate, equal to the standard deviation of the theoretical distribution of a large population of such estimates.
Confidence interval (CI).—A CI displays the probability that a parameter will fall between a pair of values around the mean. CIs are calculated at the 90% and 95% levels.
Statistical equivalence.—The acceptance criterion for statistical equivalence is that the 90% CI on the bias between the methods falls within −0.5, 0.5.
Materials and Methods
Test Kit Information
Kit name.—KangarooSci Aerobic Count Plate.
Catalog number.—KGR001.01.
Ordering information.—KGR001220822, KGR001220712, KGR001220920, KGR001230217
Test Kit Components
KangarooSci Aerobic Count Plate.—Twelve tests/plates packed in a foil pouch.
Additional Supplies and Reagents
Sample buffer solution.
Sterile saline solution (0.85–0.90%).
KH2PO4 water solution.
0.1% peptone water.
Peptone salt diluent.
Buffered peptone water (BPW).
Hydrochloric acid (HCl, 1 mol/L).
Sodium hydroxide (NaOH, 1 mol/L).
Apparatus
Incubator.—Capable of maintaining 36 ± 1°C and 30 ± 1°C.
Blender or paddle blender.—For homogenizing samples.
SerologicalpPipette.—For sample preparation and delivering 1 mL.
Vortex mixer.
Colony counter.—Quebec darkfield or equivalent.
Hand tally.
Safety Precautions
Do not open the package before testing and do not use expired products. Opened packages can be stored in a cool dry place and used within 30 days after opening. This plate may contain microorganisms that may be a potential biohazard. Follow current industry standards for disposal.
General Preparation
Do not open the KangarooSci ACP package until ready to use the plate. Prior to use, place the KangarooSci ACP on a flat surface and allow the plate to equilibrate to room temperature.
Opened packages can be stored in a cool dry place and used within 30 days after opening. Do not use products past the expiration date printed on the packaging.
For environmental surfaces, sample the surface as described in ISO 18593:2018, Microbiology of the food chain—Horizontal methods for surface sampling reference standard (3).
Sample Preparation
Solid samples (25 g).—Weigh 25 g sample into a sterile homogenizing bag, then add 225 mL sterile sample buffer solution and homogenize for 1–2 min to prepare a 1:10 sample solution. Adjust the sample solution pH to 6.6–7.2 using NaOH for acidic products, and HCl for alkaline products. Take 1 mL of the prepared sample suspension with a sterile pipette, add it into the sterile test tube, then add 9 mL sample buffer solution carefully, and mix thoroughly by shaking gently. The prepared solution will be the 1:100 sample suspension. The sample suspension can be further diluted as needed according to requirements.
Liquid samples (25 mL).—Add 25 mL sample to a sterile flask, then add 225 mL sample buffer solution, mix thoroughly, then adjust the sample solution pH to 6.6–7.2 using NaOH for acidic products, and HCl for alkaline products. Take 1 mL of the prepared sample suspension with a sterile pipette, add it to the sterile test tube, then add 9 mL sample buffer solution carefully, and mix thoroughly by shaking gently. The prepared solution will be the 1:100 sample suspension. The sample suspension can be further diluted as needed according to requirements.
Environmental surfaces (100 cm2).—Sample the environmental surface as described in ISO 18593:2018. Pre-moisten a sampling sponge with 10 mL Dey/Engley (D/E) broth and sample the test area by wiping with firm even pressure 10 times diagonally, vertically, and horizontally. After sampling, return the sponge to a sterile sample bag. Add 90 mL of a suitable sample buffer solution to prepare a 1:10 dilution. Mix by massaging by hand for 1–2 min. Take 1 mL of the prepared sample suspension with a sterile pipette, add it to the sterile test tube, then add 9 mL sample buffer solution carefully, and mix thoroughly by shaking gently. The prepared solution will be the 1:100 sample suspension. The sample suspension can be further diluted as needed according to requirements.
Plating and incubation
Place the KangarooSci ACP plate on a flat surface. Lift the cover and place 1 mL sample onto the center of the plate, in duplicate.
Carefully drop the cover onto the sample to avoid producing any bubbles. Make sure the sample spreads gradually and covers the entire plate and does not spill outside of the growth area.
Attach the lower end of the plate cover to the back of the plate tightly. Leave the plate rest for 3–5 min horizontally on the flat surface. Do not move or tilt the plate until the sample and plate have solidified.
Stack the plates no more than six high and incubate at 36 ± 1°C for 48 ± 2 h. Note: For aquatic (seafood) products incubate plates at 30 ± 1°C for 72 ± 3 h.
Calculations and Interpretation
Quantitative counting of the plate can be done by a standard colony counter. All red colonies should be counted regardless of the size or intensity.
Count colonies within 30–300 CFU, counting all the red colonies. Multiply the number of colonies by the dilution factor to obtain the CFU/g, mL, or surface test area for the matrix tested.
If the entire plate is red or has a dark background, the test sample should be further diluted and then reanalyzed.
If further isolation or identification is required, peel the cover back, pick a single colony from the gel and transfer to a nonselective agar. Further identification studies can be conducted from the nonselective agar.
Validation Study
This validation study was conducted under the AOAC Research Institute (RI) Performance Tested MethodSM program and the AOAC INTERNATIONAL Methods Committee Guidelines for Validation of Microbiological Methods for Food and Environmental Surfaces (4). The full validation study (matrix, product consistency/stability, and robustness) was conducted independently by Q Laboratories.
Reference Strains
Organisms used were obtained from the American Type Culture Collection (ATCC), Manassas, VA, United States.
Salmonella enterica serovar Typhimurium, ATCC 14028 (source, animal tissue).
Listeria monocytogenes, ATCC 13932 (source, spinal fluid).
Klebsiella aerogenes, ATCC 35029 (source not available).
Escherichia coli, ATCC 8739 (source, feces).
Staphylococcus aureus, ATCC 6538 (source, lesion).
Methodology
Matrix study.—For the matrix study the KangarooSci ACP was evaluated for mesophilic aerobic bacteria count in the following matrixes (25 g/mL test portions), NFDM, fresh raw bovine milk (4% fat), pasteurized liquid bovine milk (2% fat), fresh raw ground beef (80% lean), frozen uncooked chicken breast, cooked shredded pork, apple juice, ice cream, fresh strawberries, and stainless steel environmental surfaces (100 cm2, 18 GA, 300 series, brush finish, NSF certified). All food products were purchased form a local supplier and screened for the mesophilic aerobic plate count following ISO 4833–1:2013, Microbiology of the food chain—Horizontal method for the enumeration of microorganisms—Part 1: Colony count at 30°C by the pour plate technique, 2022-01. Natural contamination was found in fresh raw whole bovine milk (4.9 × 10³ CFU/mL), fresh raw ground beef (80% lean, 1.3 × 10⁴ CFU/g), frozen uncooked chicken breast (2.4 × 10³ CFU/g), ice cream (20 CFU/g), and strawberries (80 CFU/g). All other matrixes had an aerobic plate count of <10 (CFU/g or mL) and artificial contamination was required.
For the naturally contaminated matrixes with a high microbial load, (raw milk, fresh raw ground beef, and frozen uncooked chicken breast) additional matrix was purchased and screened to find lower contamination levels. Different levels of contamination were prepared by combining different materials to create the low (1–100 CFU/g) and medium (100–1000 CFU/g) levels. For naturally contaminated products with low microbial load, including ice cream and strawberries, temperature stress was applied to create the additional medium (100–1000 CFU/g) and high (1000–10 000 CFU/g) levels. For both ice cream and strawberries, a portion was heat stressed at 35 ± 1°C for 6 h and an additional portion was heat stressed at 35 ± 1°C for 10 h to create the two additional levels of contamination.
For pasteurized liquid milk, cooked shredded pork, and apple juice, the products were inoculated with a heat-stressed culture. The heat-stressed inoculum was prepared by propagating the strains from a stock culture stored at −70°C to a sheep blood agar (SBA) plate and incubated for 18–24 h at 35 ± 1°C. A single colony from the SBA plate was then transferred into brain heart infusion (BHI) broth and was incubated at 37 ± 1°C for 24 ± 4 h. Following incubation, the culture was heat stressed by heating the culture at 55 ± 0.1°C for 10–20 min. The heat-stressed culture was plated to a nonselective agar and a selective agar and incubated for 24 ± 4 h at 35 ± 1°C. Following incubation, the % injury was determined using the following formula:where nselect = number of colonies on the selective agar; and nnonselect = number of colonies on the nonselective agar, and the inoculating culture must have a % injury of 50–80. The heat-stressed inoculum was then diluted in phosphate-buffered water (PBW) and used to inoculate the matrix to obtain a low level (1–100 CFU/g), a medium level (100–1000 CFU/g), and a high level (1000–10 000 CFU/g). The matrix was mixed to ensure homogeneous distribution of the organisms within the matrix. For 25 g replicates, the test portion for each level of contamination was transferred to sterile filter laboratory blender bags. Low-moisture products were held at ambient temperature for 2 weeks, refrigerated products were held for 48–72 h at 2–8°C, and frozen foods were held for 2 weeks at −20°C to allow for equilibration of the organism as per AOAC guidelines.
For the low-moisture matrixes, a lyophilized culture was used. The lyophilized inoculum was prepared by propagating the culture strain from a stock culture stored at −70°C to an SBA plate and incubating for 24 ± 4 h at 37 ± 1°C. A single colony was then transferred to BHI broth and incubated for 24 ± 4 h at 37 ± 1°C. The culture was then diluted in a sterile cryoprotectant, reconstituted NFDM, and freeze-dried for 48–72 h. The lyophilized culture that was diluted in powdered NFDM was used to inoculate the matrix to obtain a low level (1–100 CFU/g), a medium level (100–1000 CFU/g), and a high level (1000–10 000 CFU/g). For 25 g test portions, the specified test portion for each level of contamination was transferred to sterile filter laboratory blender bags. Test portions were then held at room temperature (20–25°C) to allow for equilibration of the organism as per AOAC guidelines.
For stainless steel environmental sponges, the test area was inoculated with 0.25 mL of the diluted inoculum and allowed to dry for 16–24 h at room temperature (20–25°C) prior to sampling. For the uninoculated test portions, sterile BHI was used. The surfaces were sampled by premoistening a sponge in neutralizing buffer. The surfaces were swabbed vertically 10 times, then the sampler was turned over and the other side was used to swab horizontally 10 times and diagonally 10 times.
The matrix study consisted of evaluating a total of five paired replicate test portions (25 g/mL) for each of three contamination levels. Levels of contamination included a low level (1–100 CFU/g), a medium level (100–1000 CFU/g), and a high level (1000–10 000 CFU/g). For products requiring artificial contamination, five non-inoculated replicate test portions (25 g/mL) were analyzed for a total of four levels. All test portions were analyzed using the KangarooSci ACP following product instructions, and the ISO 4833–1:2013 reference standard.
ISO 4833-1:2013 reference method.—For the ISO 4833–1:2013 reference method, 1 mL of each dilution was pipetted into separate, duplicate Petri dishes (90 to 100 mm). Plate count agar (PCA; 12–15 mL at 45 ± 1°C) was added to each plate within 20 min of the original dilution. Samples and agar were mixed by rotating and moving plates back and forth on a flat surface. The PCA was then allowed to solidify.
Solidified plates were then inverted and placed in an incubator set to 30 ± 1°C for 72 ± 3 h. The number of colonies per dilution were enumerated and recorded.
KangarooSci ACP method.—For the KangarooSci ACP candidate method, 1 mL of each dilution of each test portion was pipetted onto the middle of the dry medium sheet of each plate, in duplicate. The cover was dropped carefully to avoid generating bubbles and to ensure that the liquid sample spread gradually on the entire plate. Plates were left on a flat surface for 3–5 min to solidify. Plates, stacked no more than six high, were placed in an incubator set at 36 ± 1°C for 48 ± 2 h. The number of colonies per dilution were manually enumerated and recorded.
Product consistency and stability.—For the product consistency and stability study, three test kit lots of the KangarooSci ACP were analyzed. The three lots consisted of a lot near the expiration date (12 months), a lot near the middle of the expiration period (7 months), and a lot recently manufactured (2 months). Apple juice test portions were artificially contaminated with a liquid culture of E. coli (ATCC 8739) representing low (1–100 CFU/mL), high (1000–10 000 CFU/mL), and non-inoculated levels. The inoculum was prepared by propagating the culture strain from a stock culture stored at −70°C to an SBA plate and incubated for 24 ± 4 h at 37 ± 1°C. A single colony from the SBA plate was then transferred into BHI broth and was incubated at 37 ± 1°C for 24 ± 4 h. The culture was diluted to a target level using BHI broth as the diluent and added to the matrix at an appropriate amount to obtain the desired levels. A total of five replicate test portions (25 mL) were analyzed per level. All test portions were randomized and analyzed blind coded following the KangarooSci ACP product instructions. Results were decoded and analyzed for effects on bias and repeatability.
Robustness.—For the robustness study, three testing parameters of the KangarooSci ACP method were altered: volume of sample plated, incubation time, and incubation temperature. A factorial design was used to evaluate eight treatment combinations which were compared to the nominal combination. Apple juice test portions were artificially contaminated with a liquid culture of E. coli (ATCC 8739) representing low (1–100 CFU/mL), high (1000–10 000 CFU/mL), and non-inoculated levels. The inoculum was prepared by propagating the culture strain from a stock culture stored at −70°C to an SBA plate and incubated for 24 ± 4 h at 37 ± 1°C. A single colony from the SBA plate was then transferred into BHI broth and was incubated at 37 ± 1°C for 24 ± 4 h. The culture was diluted to a target level using BHI broth as the diluent and added to the matrix at an appropriate amount to obtain the desired levels. A total of five replicate test portions (25 mL) were analyzed per level. All test portions were randomized and analyzed blind coded and then processed using the KangarooSci ACP method following the factorial combinations listed in Table 1.
Robustness parameters for the KangarooSci ACP
| Treatment combination | Volume of sample plated, mL | Incubation time, h | Incubation temperature, °C |
|---|---|---|---|
| 1 | 0.95 | 45 | 34 ± 1 |
| 2 | 0.95 | 45 | 38 ± 1 |
| 3 | 0.95 | 52 | 34 ± 1 |
| 4 | 0.95 | 52 | 38 ± 1 |
| 5 | 1.05 | 45 | 34 ± 1 |
| 6 | 0.95 | 45 | 38 ± 1 |
| 7 | 0.95 | 52 | 34 ± 1 |
| 8 | 0.95 | 52 | 38 ± 1 |
| 9 (Nominal) | 1.00 | 48 | 36 ± 1 |
Results
Statistical analysis was conducted for each matrix/contamination level, production lot, and robustness test condition. Logarithmic transformation of the counts (CFU/g) was performed and the difference of means between the candidate method and the reference methods was determined with 90 and 95% CIs. The difference of means and CIs were calculated using the Least Cost Formulations Quantitative Analysis for Micro Methods v1.2 (Virginia Beach, VA, United States) supplied by the AOAC RI. The acceptance criterion for statistical equivalence is that the 90% CI on the bias between the methods falls within −0.5, 0.5. The repeatability standard deviation (sr) was calculated on all means for all results.
In the matrix study, the percent injury for the inoculum used in pasteurized liquid bovine milk (2% fat) was 57.1%, 60% in cooked shredded pork, and 55.2% in apple juice. Cochran and Grubbs outlier tests were also performed for the KangarooSci ACP plate and the ISO reference method for all levels of all matrixes. No outliers were determined for either method for any matrix. The statistical analysis between the KangarooSci ACP plate and the reference method indicated that the methods are statistically equivalent. The matrix study data are presented in Table 2. Figures 1–10 display graphs of the log10 values of the candidate method and the reference methods.
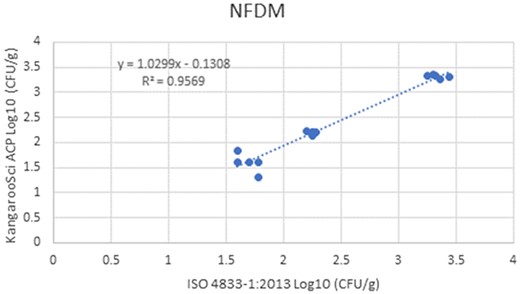
Method comparison results of the Ringbio KangarooSci ACP versus ISO 4833–1:2013 for NFDM.
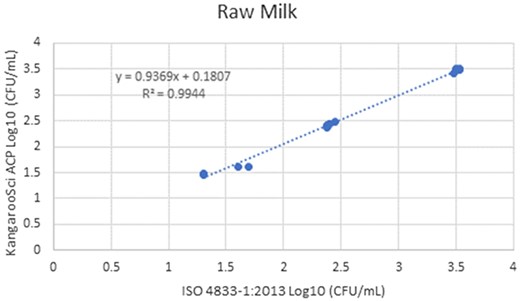
Method comparison results of the Ringbio KangarooSci ACP versus ISO 4833–1:2013 for raw milk.
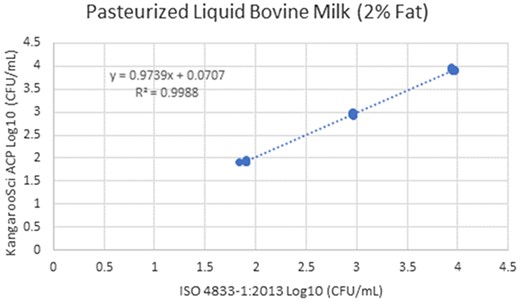
Method comparison results of the Ringbio KangarooSci ACP versus ISO 4833–1:2013 for pasteurized liquid bovine milk (2% fat).
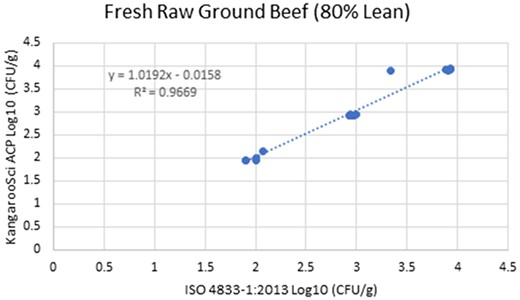
Method comparison results of the Ringbio KangarooSci ACP versus ISO 4833–1:2013 for fresh raw ground beef.
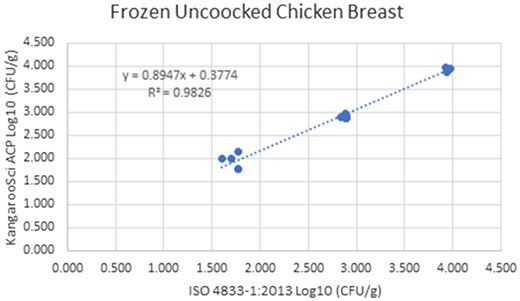
Method comparison results of the Ringbio KangarooSci ACP versus ISO 4833–1:2013 for frozen uncooked chicken breast.
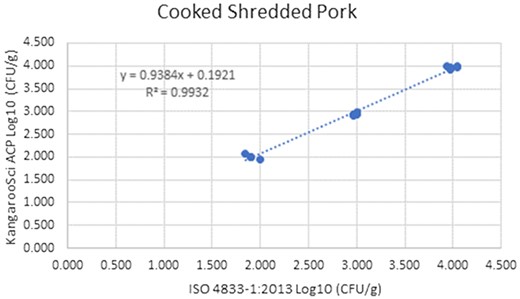
Method comparison results of the Ringbio KangarooSci ACP versus ISO 4833–1:2013 for cooked shredded pork.
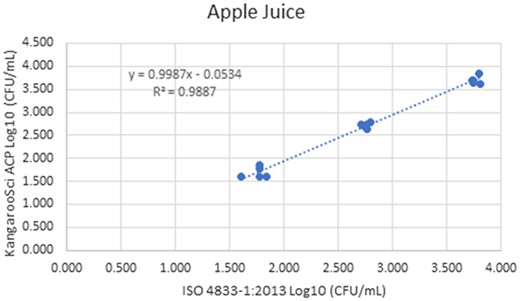
Method comparison results of the Ringbio KangarooSci ACP versus ISO 4833–1:2013 for apple juice.
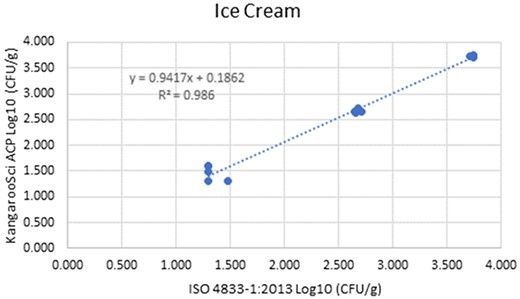
Method comparison results of the Ringbio KangarooSci ACP versus ISO 4833–1:2013 for ice cream.
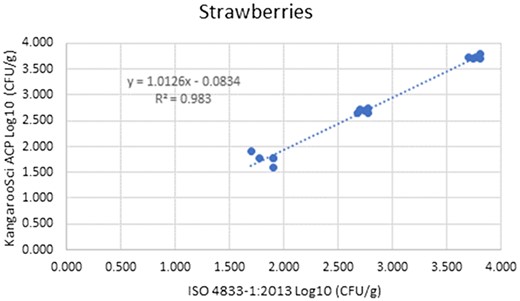
Method comparison results of the Ringbio KangarooSci ACP versus ISO 4833–1:2013 for strawberries.
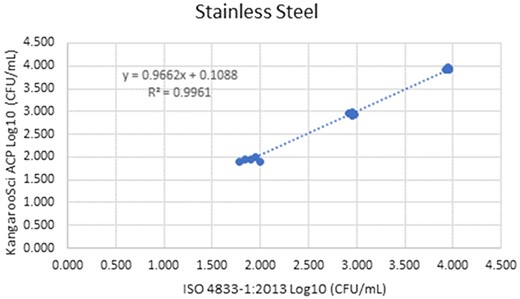
Method comparison results of the Ringbio KangarooSci ACP versus ISO 4833–1:2013 for stainless steel environmental surface.
Results of Ringbio Kangaroo ACP versus ISO 4833–1:2013
| Matrix/inoculating straina | Contamination level | nj | Kangaroo ACP | ISO 4833–1:2013 | DOMd | SEe | 90% CIf | 95% CI | ||||
|---|---|---|---|---|---|---|---|---|---|---|---|---|
| Log10 meanb | src | Log10 mean | sr | LCLg | UCLh | LCL | UCL | |||||
| Non-inoculated | 5 | 0.000 | NAk | 0.000 | NA | 0.000 | NA | NA | NA | NA | NA |
| Low | 5 | 1.592 | 0.192 | 1.693 | 0.088 | −0.101 | 0.117 | −0.351 | 0.149 | −0.426 | 0.224 | |
| Medium | 5 | 2.198 | 0.031 | 2.250 | 0.027 | −0.052 | 0.022 | −0.099 | −0.004 | −0114 | 0.010 | |
| High | 5 | 3.317 | 0.041 | 3.338 | 0.072 | −0.021 | 0.046 | −0118 | 0.076 | −0.148 | 0.106 | |
| Raw milk | Low | 5 | 1.588 | 0.123 | 1.443 | 0.194 | 0.146 | 0.098 | −0.062 | 0.354 | −0.125 | 0.417 |
| Medium | 5 | 2.433 | 0.041 | 2.401 | 0.027 | 0.032 | 0.009 | 0.014 | 0.051 | 0.008 | 0.056 | |
| High | 5 | 3.476 | 0.037 | 3.510 | 0.023 | −0.034 | 0.011 | −0.058 | −0.011 | −0.065 | −0.003 | |
| Pasteurized liquid | Non-inoculated | 5 | 0.000 | NA | 0.000 | NA | 0.000 | NA | NA | NA | NA | NA |
| bovine milk (2% Fat) | Low | 5 | 1.914 | 0.023 | 1.892 | 0.026 | 0.022 | 0.013 | −0.007 | 0.050 | −0.015 | 0.059 |
| Listeria monocytogenes | Medium | 5 | 2.954 | 0.026 | 2.962 | 0.010 | −0.008 | 0.012 | −0.035 | 0.018 | −0.043 | 0.026 |
| ATCC 13932 | High | 5 | 3.924 | 0.025 | 3.955 | 0.016 | −0.031 | 0.017 | −0.068 | 0.006 | −0.079 | 0.017 |
| Fresh raw ground beef | Low | 5 | 2.002 | 0.083 | 1.978 | 0.075 | 0.025 | 0.021 | −0.020 | 0.069 | −0.033 | 0.083 |
| Medium | 5 | 2.930 | 0.013 | 2.958 | 0.025 | −0.027 | 0.013 | −0.055 | 0.001 | −0.064 | 0.009 | |
| High | 5 | 3.918 | 0.020 | 3.915 | 0.023 | 0.002 | 0.013 | −0.026 | 0.030 | −0.034 | 0.039 | |
| Frozen uncooked | Low | 5 | 1.941 | 0.160 | 1.728 | 0.078 | 0.213 | 0.088 | 0.025 | 0.402 | −0.032 | 0.459 |
| chicken | Medium | 5 | 2.908 | 0.039 | 2.878 | 0.022 | 0.030 | 0.019 | −0.011 | 0.072 | −0.024 | 0.084 |
| breasta | High | 5 | 3.935 | 0.034 | 3.947 | 0.017 | −0.012 | 0.016 | −0.045 | 0.022 | −0.055 | 0.032 |
| Cooked shredded | Non-inoculated | 5 | 0.000 | NA | 0.000 | NA | 0.000 | NA | NA | NA | NA | NA |
| Pork | Low | 5 | 2.007 | 0.045 | 1.911 | 0.056 | 0.096 | 0.044 | 0.001 | 0.190 | −0.027 | 0.218 |
| Klebsiella aerogenes | Medium | 5 | 2.938 | 0.033 | 2.(0).978 | 0.020 | −0.041 | 0.010 | −0.061 | −0.020 | −0.067 | −0.014 |
| ATCC 35029 | High | 5 | 3.967 | 0.028 | 3.993 | 0.047 | −0.026 | 0.022 | −0.072 | 0.021 | −0.087 | 0.035 |
| Apple juice | Non-inoculated | 5 | 0.000 | NA | 0.000 | NA | 0.000 | NA | NA | NA | NA | NA |
| Escherichia coli | Low | 5 | 1.687 | 0.117 | 1.757 | 0.091 | −0.070 | 0.059 | −0.196 | 0.055 | −0.234 | 0.093 |
| ATCC 8739 | Medium | 5 | 2.720 | 0.052 | 2.754 | 0.030 | −0.033 | 0.023 | −0.083 | 0.016 | −0.097 | 0.031 |
| High | 5 | 3.696 | 0.090 | 3.764 | 0.036 | −0.067 | 0.039 | −0.151 | 0.016 | −0.176 | 0.041 | |
| Ice cream | Low | 5 | 1.458 | 0.150 | 1.338 | 0.078 | 0.120 | 0.092 | −0.076 | 0.316 | −0.136 | 0.376 |
| Medium | 5 | 2.669 | 0.031 | 2.677 | 0.027 | −0.008 | 0.015 | −0.040 | 0.025 | −0.050 | 0.035 | |
| High | 5 | 3.734 | 0.023 | 3.740 | 0.014 | −0.007 | 0.012 | −0.032 | 0.019 | −0.040 | 0.026 | |
| Strawberries | Low | 5 | 1.769 | 0.107 | 1.838 | 0.094 | −0.069 | 0.083 | −0.247 | 0.108 | −0.301 | 0.162 |
| Medium | 5 | 2.687 | 0.041 | 2.734 | 0.043 | −0.047 | 0.024 | −0.099 | 0.005 | −0.115 | 0.021 | |
| High | 5 | 3.736 | 0.035 | 3.765 | 0.045 | −0.029 | 0.024 | −0.079 | 0.022 | −0.095 | 0.037 | |
| Stainless steel | Non-inoculated | 5 | 0.000 | NA | 0.000 | NA | 0.000 | NA | NA | NA | NA | NA |
| environmental surface | Low | 5 | 1.943 | 0.041 | 1.897 | 0.088 | 0.047 | 0.039 | −0.037 | 0.130 | −0.062 | 0.155 |
| Staphylococcus aureus | Medium | 5 | 2.946 | 0.025 | 2.947 | 0.025 | −0.001 | 0.017 | −0.038 | 0.036 | −0.049 | 0.047 |
| ATCC 6538 | High | 5 | 3.931 | 0.028 | 3.947 | 0.013 | −0.017 | 0.012 | −0.042 | 0.009 | −0.050 | 0.017 |
Inoculating strain only indicated for artificial contamination. Matrixes are naturally contaminated where strains are not indicated.
Mean of five replicate portions, after logarithmic transformation: log10[CFU/g + (0.1)f]. f is the reported CFU/unit corresponding to the smallest reportable result.
sr = Standard deviation of repeatability.
DOM = Difference of means; meancand − meanref.
SE = Standard Error of DOM.
CI = Confidence interval for DOM.
LCL = Lower confidence limit for DOM.
UCL = Upper confidence limit for DOM.
American Type Culture Collection, Manassas, VA, United States.
n = Plates number (repeat times).
NA = Not applicable.
KangarooSci ACP: Product consistency and stability study results
| Matrix/inoculating Strain | Target level, CFU/g | DOMd | 90% CIe | 95% CIf | |||||||
|---|---|---|---|---|---|---|---|---|---|---|---|
| na | Meanb | Mean | sr | ||||||||
| Lot Ag (021623) | Lot Bh (091922) | ||||||||||
| Apple juice (E. coli ATCCi 8739) | High | 5 | 3.513 | 0.057 | 3.584 | 0.019 | 0.071 | 0.008, 0.135 | −0.012, 0.154 | ||
| Low | 5 | 1.744 | 0.079 | 1.747 | 0.138 | 0.003 | −0.173, 0.179 | −0.226, 0.232 | |||
| 0 | 5 | 0 | 0 | 0 | 0 | 0 | 0 | 0 | |||
| Lot A (021623) | Lot Cj (071122) | ||||||||||
| Apple juice (E. coli ATCC 8739) | High | 5 | 3.513 | 0.057 | 3.512 | 0.043 | −0.001 | −0.060, 0.057 | −0.077, 0.075 | ||
| Low | 5 | 1.744 | 0.079 | 1.780 | 0.124 | 0.036 | −0.038, 0.110 | −0.061, 0.133 | |||
| 0 | 5 | 0 | 0 | 0 | 0 | 0 | 0 | 0 | |||
| Lot B (091922) | Lot C (071122) | ||||||||||
| Apple juice (E. coli ATCC 8739) | High | 5 | 3.584 | 0.019 | 3.512 | 0.043 | −0.072 | −0.120, -0.025 | −0.134, -0.011 | ||
| Low | 5 | 1.747 | 0.138 | 1.780 | 0.124 | 0.033 | −0.159, 0.224 | −0.216, 0.282 | |||
| 0 | 5 | 0 | 0 | 0 | 0 | 0 | 0 | 0 | |||
n = Number of test portions.
Mean of five replicate portions, after logarithmic transformation: log10[CFU/g + (0.1)f]. f is the reported CFU/unit corresponding to the smallest reportable result.
sr = Repeatability standard deviation.
DOM = Difference of means between the candidate and reference methods.
90% Confidence interval on the mean difference. If the 90% CI falls within −0.5, 0.5, the conditions are considered equivalent.
95% Confidence interval on the mean difference. If the 95% CI contains 0, the methods are considered not statistically different.
Test kit Lot A—Manufactured on 021623 (approximately 2 months old).
Test kit Lot B—Manufactured on 091922 (approximately 7 months old).
Test kit Lot C—Manufactured on 071122. Product accelerated by holding at room temperature for 8 days (approximately 12 months old).
American Type Culture Collection, Manassas, VA, United States.
KangarooSci ACP: Robustness study results
| Test combinationa | Test conditions | Test combination results | Nominal conditione results | ||||||||
|---|---|---|---|---|---|---|---|---|---|---|---|
| Sample volume, mL | Incubation time, h | Incubation temperature, °C | nb | Meanc | Mean | sr | DOMf | 90% CIg | 95% CIh | ||
| (Apple juice + Escherichia coli) – High level | |||||||||||
| 1 | 0.95 | 45 | 34 | 5 | 3.629 | 0.024 | 3.655 | 0.047 | 0.026 | −0.040, 0.092 | −0.060, 0.112 |
| 2 | 0.95 | 45 | 38 | 5 | 3.616 | 0.030 | 3.655 | 0.047 | 0.039 | 0.006, 0.072 | −0.004, 0.082 |
| 3 | 0.95 | 52 | 34 | 5 | 3.639 | 0.031 | 3.655 | 0.047 | 0.016 | −0.012, 0.045 | −0.021, 0.053 |
| 4 | 0.95 | 52 | 38 | 5 | 3.625 | 0.015 | 3.655 | 0.047 | 0.030 | −0.002, 0.062 | −0.011, 0.071 |
| 5 | 1.05 | 45 | 34 | 5 | 3.639 | 0.022 | 3.655 | 0.047 | 0.016 | −0.032, 0.064 | −0.047, 0.078 |
| 6 | 1.05 | 45 | 38 | 5 | 3.653 | 0.028 | 3.655 | 0.047 | 0.002 | −0.028, 0.033 | −0.038, 0.042 |
| 7 | 1.05 | 52 | 34 | 5 | 3.631 | 0.032 | 3.655 | 0.047 | 0.024 | −0.024, 0.073 | −0.038, 0.087 |
| 8 | 1.05 | 52 | 38 | 5 | 3.615 | 0.047 | 3.655 | 0.047 | 0.040 | −0.013, 0.093 | −0.029, 0.109 |
| (Apple juice + Escherichia coli) – Low level | |||||||||||
| 1 | 0.95 | 45 | 34 | 5 | 1.518 | 0.132 | 1.562 | 0.151 | 0.044 | −0.121, 0.210 | −00171, 0.260 |
| 2 | 0.95 | 45 | 38 | 5 | 1.538 | 0.153 | 1.562 | 0.151 | 0.025 | −0.184, 0.234 | −0.247, 0.297 |
| 3 | 0.95 | 52 | 34 | 5 | 1.578 | 0.056 | 1.562 | 0.151 | −0.016 | −0.176, 0.145 | −0.225, 0.194 |
| 4 | 0.95 | 52 | 38 | 5 | 1.538 | 0.153 | 1.562 | 0.151 | 0.025 | −0.233, 0.283 | −0.311, 0.361 |
| 5 | 1.05 | 45 | 34 | 5 | 1.518 | 0.132 | 1.562 | 0.151 | 0.044 | −0.157, 0.246 | −0.218, 0.306 |
| 6 | 1.05 | 45 | 38 | 5 | 1.458 | 0.150 | 1.562 | 0.151 | 0.104 | −0.130, 0.338 | −0.200, 0.409 |
| 7 | 1.05 | 52 | 34 | 5 | 1.553 | 0.068 | 1.562 | 0.151 | 0.009 | −0.163, 0.181 | −0.215, 0.233 |
| 8 | 1.05 | 52 | 38 | 5 | 1.613 | 0.107 | 1.562 | 0.151 | −0.051 | −0.201, 0.099 | −0.246, 0.144 |
| (Apple juice + diluent) – Uninoculated control | |||||||||||
| 1 | 0.95 | 45 | 34 | 5 | 0.00 | 0.00 | 0.00 | 0.00 | 0.00 | 0.00, 0.00 | 0.00, 0.00 |
| 2 | 0.95 | 45 | 38 | 5 | 0.00 | 0.00 | 0.00 | 0.00 | 0.00 | 0.00, 0.00 | 0.00, 0.00 |
| 3 | 0.95 | 52 | 34 | 5 | 0.00 | 0.00 | 0.00 | 0.00 | 0.00 | 0.00, 0.00 | 0.00, 0.00 |
| 4 | 0.95 | 52 | 38 | 5 | 0.00 | 0.00 | 0.00 | 0.00 | 0.00 | 0.00, 0.00 | 0.00, 0.00 |
| 5 | 1.05 | 45 | 34 | 5 | 0.00 | 0.00 | 0.00 | 0.00 | 0.00 | 0.00, 0.00 | 0.00, 0.00 |
| 6 | 1.05 | 45 | 38 | 5 | 0.00 | 0.00 | 0.00 | 0.00 | 0.00 | 0.00, 0.00 | 0.00, 0.00 |
| 7 | 1.05 | 52 | 34 | 5 | 0.00 | 0.00 | 0.00 | 0.00 | 0.00 | 0.00, 0.00 | 0.00, 0.00 |
| 8 | 1.05 | 52 h | 38 | 5 | 0.00 | 0.00 | 0.00 | 0.00 | 0.00 | 0.00, 0.00 | 0.00, 0.00 |
Each parameter test combination is being compared to the nominal test condition.
n = Number of test portions.
Mean of five replicate portions after logarithmic transformation: log10[CFU/g + (0.1)f]. f is the reported CFU/unit corresponding to the smallest reportable result.
sr = Repeatability standard deviation.
Nominal conditions are 1 mL sample volume, 48 h incubation time, and 36°C incubation temperature.
DOM =Difference of means between the test combination and nominal condition results.
90% Confidence interval on the mean difference. If the 90% CI falls within −0.5, 0.5, the conditions are considered equivalent.
95% Confidence interval on the mean difference. If the 95% CI contains 0, the methods are considered not statistically different.
For product consistency and stability, the different production lots gave equivalent results at all time points examined. Minor variations in the test conditions (sample volume, incubation time, and incubation temperature) did not have any negative affect on the results. Equivalent results were seen when compared to the nominal test condition (Tables 3 and 4).
Discussion
The data supports the claim that the KangarooSci ACP method is statistically equivalent to the ISO 4833–1:2013 reference method for all matrixes evaluated. The 90% CI on the difference of means (DOM) for all comparisons in the matrix study, product consistency/stability, and robustness studies were well within the −0.5, 0.5 acceptance criterion.
The KangarooSci ACP method is robust, quick, and simple to perform, providing enumerable colonies in 48–72 h after incubation when compared to 72 h of the reference method. The small size of the plate allows for less space to be occupied by plates in the incubators. The ability of the medium to self-diffuse removes an additional step requiring the end user to manually spread the sample over the plate area using a typical dry media plate spreader.
Colonies on the KangarooSci ACP are red. Organisms that form very large colonies on the plates will appear entirely red or have red centers surrounded by a very large red border.
Conclusions
The data from this study, within their statistical uncertainty, support the product claim that the KangarooSci ACP can be utilized to enumerate mesophilic aerobic bacteria from NFDM powder, fresh raw whole bovine milk (4% fat), pasteurized liquid bovine milk (2% fat), fresh raw ground beef (80% lean), frozen uncooked chicken breast, cooked shredded pork, apple juice, ice cream, strawberries, and stainless steel environmental surface. The results obtained by the analysis of the study demonstrated statistical equivalence between the number of aerobic bacteria enumerated by the KangarooSci ACP and ISO 4833–1:2013 reference method for all matrixes tested.
Submitting Company
Ring Biotechnology Co., Ltd
Building 3
Zhongtongtai Science Park
No. 11, Kechuang 14th St
Beijing, 100176
China
Independent Laboratory
Q Laboratories
1930 Radcliff Dr
Cincinnati, OH 45204
United States
Conflict of Interest
The authors declare that they work for Ring Biotechnology Co., Ltd and receive a salary for this work. The authors of Q Laboratories received payment from Ring Biotechnology Co., Ltd to perform the independent study work.
References
ISO 4833-1:2013 - Microbiology of the food chain — Horizontal method for the enumeration of microorganisms — Part 1: Colony count at 30 °C by the pour plate technique, https://www.iso.org/standard/53728.html (accessed April 2023)
GB 4789.2-2022 National food safety standard: Microbiological test of food: Determination of the total number of colonies, http://down.foodmate.net/standard/sort/3/123310.html (accessed May 2023)
ISO 18593:2018 - Microbiology of the food chain — Horizontal methods for surface sampling, https://www.iso.org/standard/64950.html (accessed April 2023)
Official Methods of Analysis (
