


Abstract
Bisphenol A (BPA) is a chemical of concern in the food industry. There is a need for a sensitive analytical method for the determination of BPA in beverages.
To develop a method for the determination of BPA in carbonated, non-carbonated, and non-alcoholic drinks.
Replicates of a carbonated soft drink, orange juice with pulp, and a dairy-based coffee drink at spiking levels ranging from 0 to 32 ng/mL were analyzed. The carbonated soft drink was adjusted to pH 7.4 and diluted with phosphate buffered saline (PBS). The orange juice with pulp and the dairy-based coffee drink were extracted with methanol and sodium chloride, then diluted with PBS.
LOD ranged from 0.06 to 0.08 ng/mL and LOQ ranged from 0.10 to 0.14 ng/mL. Recoveries of BPA from all sample types at 1 to 16 ng/mL spiked levels were between 93 and 100%; relative standard deviation (RSDr, %) ranged from 0.71 to 8.38% depending on matrix and spiking levels.
The results indicate that the method for determination of BPA in carbonated, non-carbonated, and non-alcoholic drinks is reproducible and meets AOAC Official MethodSM performance criteria.
The test portions were filtered and the filtrates applied to an immunoaffinity column (IAC) containing antibodies specific for BPA. After the column was washed with water, BPA was eluted from the IAC with 80% methanol and the eluate was directly injected, or concentrated and injected, into ultra-performance liquid chromatography (UPLC) with fluorescence detector (FLD) for separation, detection, and quantitation.
Bisphenol A (BPA) is a chemical used primarily in the production of polycarbonate plastics and epoxy resins. Polycarbonate plastics are commonly utilized for food/beverage packaging and medical devices. Epoxy resins are often used for coating metal products such as food cans, bottle tops and water supply pipes. Studies in animal models have shown that BPA has various toxic effects on the immune, nervous, and reproductive systems (1–3). Potentially hazardous chemicals have always been of concern to customers, especially for food/beverage producers. Although the effects of BPA on human health remain unclear, many countries and regions have set their own regulations to mitigate the risk of human exposure to BPA.
Methods have been developed to detect BPA in environmental and food products including GC/MS, LC/MS, U/HPLC, and ELISA (4–6). Immunoaffinity purification has been widely used in sample preparation for chemical analysis, especially for analytes present in trace amounts. Immunoaffinity purification not only specifically separates the targeting analyte from a complex matrix but also enriches the analyte simultaneously. Sample preparation through an immunoaffinity column (IAC) provides an effective and simple route to improve sensitivity and precision of the downstream instrumental analysis on various sample matrixes.
Highly sensitive analytical tests usually demand sophisticated and expensive instrumentation. In this study, we developed an IAC-facilitated method for BPA analysis based on a UPLC/FLD system, which is commonly found in many analytical laboratories. The goal of this study was to determine the performance characteristics of an IAC purification combined with UPLC with a fluorescence detection method for the determination of free BPA in commercially packaged ready-to-consume carbonated/non-carbonated and non-alcoholic beverages.
AOAC Official Method 2019.07 Bisphenol A (BPA) in Beverages Immunoaffinity Column Purification and UPLC with Fluorescence Detector First Action 2019
[Applicable for the determination of free bisphenol A in commercially packaged ready to consume carbonated, non-carbonated and non-alcoholic beverages].
Caution: Disposal of BPA waste must strictly follow state regulations. All reagents used in the test are required to be BPA-free or non-detectable, especially the water and PBS buffer used in the sample preparation, extraction, and BPA capture. All containers, pipette tips, tubes, and transfer vessels shall be made of BPA-free materials.
The immunoaffinity column from storage at 4°C shall be equilibrated to room temperature (≥15 min) before use.
A. Principle of the Method
A monoclonal antibody (Mab) against BPA is covalently conjugated to sepharose beads. The coupled beads are packed into an empty column cartridge to produce an IAC. When sample extract is passed through the coupled beads in the column, if BPA is present, it will be captured by anti-BPA Mab. To remove any non-specific binding impurities, the wash step(s) is applied by passing water or phosphate buffer saline (PBS) through the beads in the column. An organic solvent such as methanol is used to elute BPA from the anti-BPA Mabs. The eluate is then directly injected or dried under nitrogen and then reconstituted before being injected into UPLC for analysis. BPA content is quantified by fluorescence detection.
B. Apparatus
Ultra-performance liquid chromatography.—ACQUITY UPLC H-Class with fluorescence detector (Waters, Milford, MA), or equivalent instrument.
Column.—CORTECS UPLC C18+, 2.1 × 100 mm, 1.6 μm (Waters, Part No. 186007116), or equivalent column.
Immunoaffinity column (IAC).—BPATest™ columns (VICAM, Milford, MA).
Fluted paper filter.—VICAM, Part No. 31240.
Column pump stand.—VICAM, Part No. G1104.
Polypropylene tube.—15 mL size.
C. Materials and Reagents
Beverages.—Carbonated regular soft drink with full calories, 100% orange juice with pulp, and dairy-based coffee drink were purchased from a local grocery store (Milford, MA).
Bisphenol A.—Certified reference material, TraceCERT® Bisphenol A (42088, Sigma-Aldrich, St. Louis, MO). Bisphenol B, E, F, and S were also purchase from Sigma.
Acetic acid.—Sigma (A6283).
Sodium hydroxide.—Fisher (BP359-212).
Sodium chloride, reagent grade.—Fisher (S642).
Methanol, LC-MS grade.—Fisher (A996-4).
Acetonitrile, LC-MS grade.—Fisher (A454-4).
Phosphate buffered saline (PBS).—VICAM (P/N G1113).
Water.—Distilled or purified, with resistivity ≥18 MΩ at 25°C, containing no detectable BPA.
D. Reagent, Standard and Sample Spiking
Acid, base and organic solvents were prepared in a ventilation hood.
BPA calibration standards.—The stock BPA standard (6400 ng/mL) was prepared in 80% methanol and stored in a refrigerator (used within 4 weeks). A standard curve was generated every day that the test was performed. The current test procedure provides ten times of enrichment. Calibrants containing 0, 5, 10, 40, 80, 160, and 320 ng/mL in 80% methanol (representing 0, 0.5, 1, 4, 8, 16, and 32 ng/mL samples) were prepared from stock BPA standard for recovery study. For lower level calibrants, such as for the LOD/LOQ study, calibrants containing 0, 0.25, 0.5, 1, 2, and 4 ng/mL BPA (equivalent to 0, 0.025, 0.05, 0.1, 0.2 and 0.4 ng/mL in samples) were prepared in 80% methanol. The standard peak areas of BPA were plotted against the corresponding BPA concentration to generate the standard curve. BPA concentrations of unknown samples were extrapolated from the standard curve by applying the peak area values into the linear regression equation (details in Calculations section).
BPA spiked samples.—Beverage samples were spiked with BPA at 1, 4, 8, 16, and 32 ng/mL levels. In the recovery study, 0.5 mL BPA standard stock (6400 ng/mL) was added to a 100 mL sample to be tested, which produced a 32 ng/mL spiked sample. The 32 ng/mL sample was serially diluted to 16, 8, 4, and 1 ng/mL using a blank sample.
Laboratory safety practice.—Lab coats, gloves, and safety glasses were worn as personal protective equipment when performing the experiments. All BPA standard preparation and sample spiking were handled in a safety ventilation hood. Any waste containing BPA was placed in a specified hazardous waste can. Other organic liquid waste (methanol based) was placed in a labeled liquid safety disposal container following local regulations. Tubes, pipets and glass waste (if used) was disposed of separately, following local recycling guidelines.
E. Sample Preparation
Carbonated full calorie regular soft drinks.—The pH of 100 mL carbonated soft drink (blank and BPA spiked) was adjusted to 7.4 with 4 N NaOH. The pH-adjusted carbonated drink was then diluted with PBS (s: PBS = 1:1, v/v), stirred for 2 min and 20.0 mL of the final diluted solution was loaded into a BPATest™ column. The volume of original sample loaded was 10.0 mL. This sample preparation procedure was designed for samples containing no insoluble solids, for example, carbonated diet drinks and non-carbonated drinks such as sport drinks.
100% juice with pulp and dairy-based coffee drinks.—The BPA extraction of blank and BPA-spiked juice and dairy-based coffee drink was originated by adding and dissolving NaCl to a final concentration of 2% (w/v, g/mL) and then adding methanol at 1:1 ratio (v/v), followed by constant mixing at ambient temperature for 30 min. The extraction solution was filtered with fluted paper filter. Ten (10) mL of filtrate was then mixed with 40 mL PBS. Twenty (20) mL of this final solution, equivalent to 2 mL original juice or coffee sample, was loaded into a BPATest™ column. This sample preparation procedure was developed for samples containing insoluble solids, such as juice with or without pulp, dairy-based drinks, etc.
F. Immunoaffinity Column Chromatography
Condition the immunoaffinity column.—Since BPA is widely present in reagents and equipment used for IAC manufacturing, it is recommended to strip the IAC to remove any potential BPA contamination within the column. The PBS buffer in the column headspace was discarded and 3 mL freshly prepared solution of 10% acetic acid in water was passed through the column at a flow rate of one drop/s. The column was then washed with 10 mL PBS immediately.
Immunoaffinity column application.—Sample solution (20 mL) was passed through the IAC at a flow rate of one drop/2 s. The column was washed with 10 mL water at a flow rate of one drop/s. BPA was eluted with 1 mL 80% methanol at a rate of one drop/2 s and elution was completed by pushing air through the column with an air pump. The eluate was directly injected into the UPLC (for the carbonated drink sample) or concentrated by drying under a slow stream of nitrogen and reconstituted with 200 μL 80% methanol (for the orange juice and dairy-based coffee drink) and then injected into the UPLC.
G. UPLC Conditions
Instrument.—Waters ACQUITY UPLC H-Class System.
Column.—CORTECS UPLC C18+, 2.1 × 100 mm, 1.6 µm id (Waters, Part No. 186007116).
Column temperature.—30°C.
Mobile phase.—Acetonitrilewater (50:50, v/v).
Flow rate.—0.4 mL/min.
Injection volume.—5 µL.
Fluorescent detector.—ACQUITY UPLC FLR Detector.
Excitation wavelength.—275 nm.
Emission wavelength.—313 nm.
Running time.—2 min.
Retention time.—Approximately 1.10 min.
H. Calculations
LOD and LOQ—Both LOD and LOQ for current test methods were determined according to AOAC criteria:
LOD = blank mean + 3 × standard deviations of ten independent analyses of blank
LOQ = blank mean + 10 × standard deviations of ten independent analyses of blank
All blank samples tested were actual matrix blanks and not solvent blanks.
BPA quantitation.—The BPA calculation in this report was automatically done by Waters’ Empower software following its analysis instrument method. BPA quantitation can also be done manually. Briefly, a BPA peak in the chromatogram was identified by comparing its retention time with that of the BPA standard under the same conditions. The peak areas (response, y-axis) of each BPA in standards versus corresponding concentrations (ng/mL, x-axis) were plotted in an Excel spreadsheet; the slope (b) and y-intercept (a) were determined by the Excel software. The level of BPA in a tested sample (ng/mL) was calculated from the equation below, where Y is the peak area obtained from the tested sample, V1 is the volume of the final elute or drying/reconstituted volume (mL), and V2 is the volume of original sample (mL) loaded into the IAC:
BPA (X), ng/mL = [(Y − a)/b] × V1/V2
Results and Discussion
LOD and LOQ
Selected samples containing the lowest amount of BPA contamination were used for the LOD/LOQ study since BPA-free samples were difficult to find. A total of ten replicates were analyzed for each sample type. The mean and standard deviation (SD) were calculated. The LOD and LOQ were calculated and are shown in Table 1.
LOD and LOQ levels (ng/mL, ppb) in different matrixes
| Carbonated soft drink, ng/mL | Orange juice with pulp, ng/mL | Dairy-based coffee, ng/mL | |
|---|---|---|---|
| Replicate 1 | 0.048 | 0.058 | 0.051 |
| Replicate 2 | 0.036 | 0.061 | 0.050 |
| Replicate 3 | 0.041 | 0.058 | 0.041 |
| Replicate 4 | 0.032 | 0.050 | 0.056 |
| Replicate 5 | 0.038 | 0.058 | 0.047 |
| Replicate 6 | 0.031 | 0.054 | 0.050 |
| Replicate 7 | 0.037 | 0.040 | 0.052 |
| Replicate 8 | 0.028 | 0.050 | 0.049 |
| Replicate 9 | 0.042 | 0.059 | 0.067 |
| Replicate 10 | 0.032 | 0.067 | 0.031 |
| Mean, ng/mL | 0.037 | 0.055 | 0.049 |
| SD | 0.006 | 0.007 | 0.009 |
| LOD, ng/mL | 0.055 | 0.078 | 0.077 |
| LOQ, ng/mL | 0.097 | 0.130 | 0.142 |
Results of Spiking at LOQ Levels
Based on theoretical calculations defined by the AOAC, the LOQ of the current test for carbonated drinks is 0.1 ng/mL, and for orange juice with pulp and dairy-based coffee is 0.13 and 0.15 ng/mL, respectively. To further confirm if the method can quantitatively determine the theoretical LOQ levels, samples were spiked at 0.1 ng/mL or 0.15 ng/mL and the recovery was tested. The results were summarized in Table 2. The results demonstrate that the method detects BPA at LOQ levels in various sample matrixes with good accuracy and precision.
BPA recovery of spiking at LOQ level (ng/mL, ppb)
| Carbonated soft drink, ng/mLa | Orange juice with pulp, ng/mLa | Dairy-based coffee, ng/mLa | |
|---|---|---|---|
| Spiking level, ng/mL | 0.10 | 0.15 | 0.15 |
| Replicate 1 | 0.11 | 0.13 | 0.15 |
| Replicate 2 | 0.10 | 0.12 | 0.14 |
| Replicate 3 | 0.11 | 0.14 | 0.15 |
| Replicate 4 | 0.11 | 0.12 | 0.12 |
| Replicate 5 | 0.11 | 0.12 | 0.15 |
| Replicate 6 | 0.10 | 0.13 | 0.17 |
| Mean, ng/mL | 0.10 | 0.13 | 0.15 |
| Recovery, % | 104.83 | 84.11 | 97.44 |
| RSD | 0.01 | 0.01 | 0.02 |
| CV, % | 5.80 | 7.24 | 11.21 |
Background BPA was subtracted in the final report. The BPA background in carbonated soft drink, orange juice with pulp, and dairy-based coffee was 0.016, 0.064, and 0.127 ng/mL, respectively.
System Suitability
The system suitability was examined to ensure that the UPLC/fluorescence detector system and procedures are adequate for the analytical method. The results are given in Table 3, including retention time (mean ± %RSD, n = 6), peak area (%RSD, n = 6), peak tailing factor and the number of theoretical plates.
System suitability results
| Parameters | Observed values | Specification |
|---|---|---|
| Retention times, (min, mean±%RSD, n=6) | 1.06 ± 0.41% | RSD <2% |
| Peak area, RSD, % (n = 6) | 2.66 | <5 |
| Peak tailing factor | 1.12 | <1.5 |
| No. of theoretical plates | 4986 | >3000 |
| Parameters | Observed values | Specification |
|---|---|---|
| Retention times, (min, mean±%RSD, n=6) | 1.06 ± 0.41% | RSD <2% |
| Peak area, RSD, % (n = 6) | 2.66 | <5 |
| Peak tailing factor | 1.12 | <1.5 |
| No. of theoretical plates | 4986 | >3000 |
Chromatograms of Blanks and Spiked Samples
Chromatograms obtained for carbonated soft drinks, orange juice with pulp, and dairy-based coffee drinks, are shown in Figures 1–3, respectively. All representative samples were naturally contaminated with very low levels of BPA content ranging from 0.23 to 0.45 ng/mL. The chromatogram of each sample was compared with the same sample spiked with 1 ng/mL BPA and an analytical blank standard was also included in the same graph as reference.
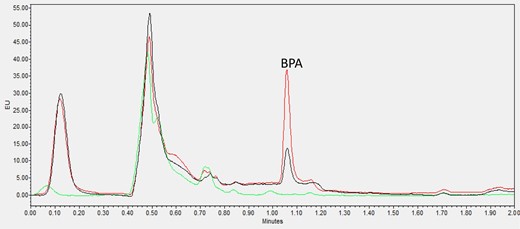
Chromatogram of BPA from zero standard blank (green line), blank carbonated drink (black line, 0.47 ng/mL BPA contaminated) and its 1 ng/mL spiked sample (red line).
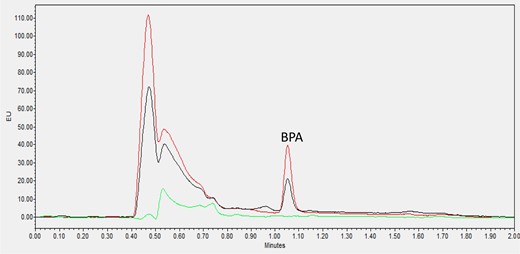
Zero standard blank (green line), blank orange juice with pulp (black line, 0.87 ng/mL BPA contaminated) and its 1 ng/mL spiked sample (red line).
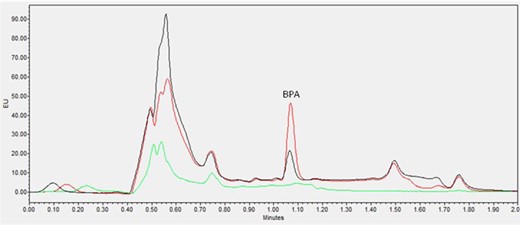
Zero standard blank (green line), blank dairy-based coffee (black line, 0.28 ng/mL BPA contaminated) and its 1 ng/mL spiked sample (red line).
BPA Affinity Column Capacity and BPA Monoclonal Antibody Specificity
The BPA column is 8 × 65 mm in size and the BPA binding capacity of the current BPA antibody column is 500 ng according to the manufacturer’s specification, which is determined by spiking increasing amount of BPA in PBS and running it through the column. It is confirmed that the column can bind at least 500 ng of BPA with greater than 95% recovery (data not included in this report). The columns should be stored at refrigerated temperature (2–8°C) until the expiration date on the box of columns; columns are good for 1 year from production date. It is recommended to warm up the columns to room temperature (18–22°C) before use.
According to the manufacturer’s study on the BPA antibody for the column, the current antibody cross-reacts with bisphenol B and E, and has less cross-reactivity with F. Under the current method conditions, bisphenol A, B, E, and F can be clearly separated and there is no interference on the BPA analysis. A typical chromatogram of a mixture of bisphenol A, B, E, and F is shown in Figure 4.

Separation of mixture of BPA (A) with its analogs BPF (F), BPE (E), and BPB (B). An approximate equal amount of A, E, F and B (2 ng/mL each) spiked in 80% methanol (blue line); black line 80% methanol only.
The mixture of bisphenols (2 ng/mL each) was spiked in a carbonated soft drink and the recovery result of each bisphenol is summarized in Table 4. The result showed good potential that the method can be used to quantitatively detect BPB and BPE in a beverage sample, which is beyond the scope of this report.
The results of spiking 2 ng/mL of BPA, BPB, BPE, BPF, and BPS, respectively, in carbonated soft drink
| R1 | R2 | R3 | R4 | R5 | R6 | Mean | Recovery, % | |
|---|---|---|---|---|---|---|---|---|
| BPA, ng/mL | 2.01 | 2.14 | 2.14 | 1.90 | 1.98 | 2.01 | 2.03 | 101.50 |
| BPB, ng/mL | 1.86 | 2.00 | 2.00 | 1.80 | 1.92 | 1.92 | 1.92 | 95.83 |
| BPE, ng/mL | 1.90 | 1.99 | 2.01 | 1.82 | 1.91 | 1.94 | 1.93 | 96.42 |
| BPF, ng/mL | 0.50 | 0.60 | 0.68 | 0.70 | 0.66 | 0.62 | 0.63 | 31.33 |
| BPS, ng/mL | 0.00 | 0.00 | 0.00 | 0.00 | 0.00 | 0.00 | 0.00 | 0.00 |
Method Repeatability
Samples of carbonated soft drinks, 100% orange juice with pulp and dairy-based coffee drinks spiked at 0, 1, 4, and 16 ng/mL levels were tested with six replicates by one operator, using the same equipment. Results of the recovery and relative standard deviation (RSDr) are summarized in Tables 5–7.
Method precision (repeatability) for BPA in spiked carbonated soft drink, results obtained by one operator on the same day
| BPA spiked, ng/mL | R1a,b | R2 | R3 | R4 | R5 | R6 | Mean | Recovery, % bias, %c,d | RSD,% |
|---|---|---|---|---|---|---|---|---|---|
| 0 | 0.46 | 0.47 | 0.41 | 0.41 | 0.35 | 0.39 | 0.42 | – | 10.75 |
| 1 | 0.96 | 0.91 | 0.97 | 1.02 | 1.05 | 1.07 | 1.00 | 99.67, –0.33 | 5.75 |
| 4 | 3.80 | 3.76 | 3.75 | 3.82 | 3.79 | 3.82 | 3.79 | 94.75, –3.25 | 0.71 |
| 16 | 14.75 | 14.95 | 15.15 | 15.00 | 14.77 | 15.22 | 14.97 | 93.58, –6.42 | 1.28 |
Result at 1, 4, and 16 (ng/mL) = Amount found (ng/mL) – amount found (ng/mL) at 0 spiked level.
R = Replicate.
Recovery, % = result/spiked level × 100.
Recovery bias, % = Bias is the difference between the BPA method % recovery and the true value of 100%.
Method precision (repeatability) for bisphenol A in spiked orange juice with pulp, results obtained by one operator on the same day
| BPA spiked ng/mL | R1a,b | R2 | R3 | R4 | R5 | R6 | Mean | Recovery, % bias, %c,d | RSD, % |
|---|---|---|---|---|---|---|---|---|---|
| 0 | 1.12 | 1.22 | 1.20 | 1.13 | 1.22 | 1.25 | 1.19 | – | 4.45 |
| 1 | 0.98 | 1.02 | 1.11 | 0.96 | 0.93 | 0.87 | 0.98 | 97.83, –2.17 | 8.36 |
| 4 | 3.86 | 3.91 | 3.94 | 3.96 | 3.96 | 4.06 | 3.95 | 98.71, –1.29 | 1.68 |
| 16 | 14.61 | 15.12 | 15.71 | 14.30 | 15.00 | 15.33 | 15.01 | 93.82, –6.18 | 3.36 |
Result at 1, 4, 16 (ng/mL) = amount found (ng/mL) – amount found (ng/mL) at 0 spiked level.
R = Replicate.
Recovery, % = result/spiked level × 100.
Recovery bias, % = Bias is the difference between BPA method % recovery and the true value of 100%.
Method precision (repeatability) for BPA in spiked in dairy-based coffee drinks, results obtained by one operator on the same day
| BPA spiked, ng/mL | R1a,b | R2 | R3 | R4 | R5 | R6 | Mean | Recovery % %biasc,d | RSD, % |
|---|---|---|---|---|---|---|---|---|---|
| 0 | 1.12 | 0.88 | 0.95 | 0.80 | 0.78 | 0.92 | 0.91 | – | 13.54 |
| 1 | 0.94 | 0.96 | 0.91 | 0.98 | 1.00 | 0.96 | 0.96 | 95.50, –4.50 | 3.27 |
| 4 | 3.76 | 3.79 | 3.97 | 3.88 | 3.77 | 3.92 | 3.85 | 96.13, –3.87 | 2.28 |
| 16 | 15.42 | 14.82 | 15.28 | 15.48 | 14.89 | 15.95 | 15.30 | 95.65, –4.35 | 2.72 |
Result at 1, 4, 16 (ng/mL) = Amount found (ng/mL) – amount found (ng/mL) at 0 spiked level.
R = Replicate.
Recovery, % = Result/spiked level × 100.
Recovery bias, % = Bias is the difference between BPA method % recovery and the true value of 100%.
Additional Method Repeatability
The repeatability of the method was further evaluated by repeating the test on different days. A summary of repeatability for the method in carbonated soft drinks, 100% orange juice with pulp, and dairy-based coffee drinks is given in Table 8.
Method precision (repeatability) for BPA in carbonated soft drink, orange juice with pulp and dairy-based coffee drinks
| Repeatability parameters | Carbonated soft drinka | Orange juice with pulpa | Dairy-based coffeea | |||
|---|---|---|---|---|---|---|
| BPA spiked, ng/mL | 4 | 16 | 4 | 16 | 4 | 16 |
| BPA detected, ng/mL R1 | 3.80 | 14.95 | 3.86 | 14.61 | 3.88 | 15.48 |
| R2 | 3.76 | 14.75 | 3.91 | 15.12 | 3.77 | 14.89 |
| R3 | 3.75 | 15.15 | 3.94 | 15.71 | 3.92 | 15.95 |
| R4 | 3.82 | 15.00 | 3.96 | 14.3 | 3.76 | 15.42 |
| R5 | 3.79 | 14.77 | 3.96 | 15.00 | 3.79 | 14.82 |
| R6 | 3.82 | 15.22 | 4.06 | 15.33 | 3.97 | 15.28 |
| R7 | 4.06 | 14.90 | 4.02 | 16.06 | 3.74 | 15.63 |
| R8 | 3.97 | 14.98 | 3.89 | 15.47 | 3.81 | 15.07 |
| R9 | 3.74 | 14.71 | 3.99 | 15.54 | 4.04 | 14.86 |
| Mean, ng/mLa | 3.83 | 14.94 | 3.95 | 15.24 | 3.85 | 15.27 |
| Recovery, %b | 95.75 | 93.38 | 98.75 | 95.25 | 96.25 | 95.44 |
| Recovery bias, %c | −4.75 | −6.62 | −1.25 | −4.75 | −3.75 | −4.56 |
| SD, ng/mL | 0.11 | 0.18 | 0.06 | 0.55 | 0.10 | 0.39 |
| RSD, % | 2.83 | 1.18 | 1.60 | 3.59 | 2.72 | 2.55 |
Result (ng/mL) = Amount found (ng/mL) – amount found (ng/mL) at 0 spiked level, nine replicates.
Recovery % = Result/spiked level × 100.
Recovery bias % = Bias is the difference between BPA method % recovery and the true value of 100%.
Method Linearity
Linearity was determined by spiking dairy-based coffee drinks with BPA at levels ranging from 0 to 32 ng/mL and each spiking level was tested in triplicate. Individual data points are presented in the Table 9 and the linear regression was given in Figure 5.
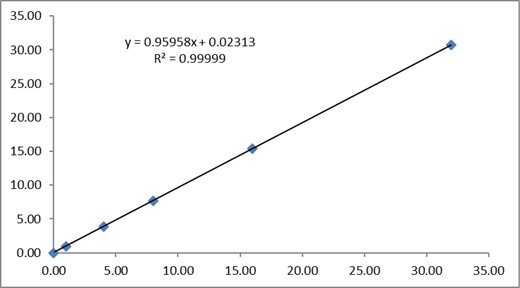
Linear regression of spiking BPA in dairy-based coffee.
Summary of linearity study in dairy-based coffee drinks
| BPA spiked, ng/mLa | R1b | R2c | R3 | Mean | Recovery, % | SD | RSD, % |
|---|---|---|---|---|---|---|---|
| 0 | 0.78 | 0.80 | 0.92 | 0.83 | — | 0.08 | 9.09 |
| 1 | 0.98 | 1.00 | 0.96 | 0.98 | 97.67 | 0.02 | 2.05 |
| 4 | 3.88 | 3.77 | 3.92 | 3.85 | 96.33 | 0.08 | 2.02 |
| 8 | 7.84 | 7.38 | 7.90 | 7.70 | 96.29 | 0.28 | 3.69 |
| 16 | 15.48 | 14.89 | 15.95 | 15.44 | 96.48 | 0.53 | 3.44 |
| 32 | 30.98 | 30.07 | 31.06 | 30.70 | 95.94 | 0.55 | 1.79 |
Spiked levels (ng/mL).
Result (ng/mL) = Amount found (ng/mL) – amount found (ng/mL) at 0 spiked level, excepting that the 0 spiking level was kept from subtraction.
R = Replicate.
The linear regression equation for dairy-based coffee is y = 0.96x + 0.023 and the correlation coefficient (R2) for BPA in the range from 0 to 32 ng/mL is 0.99999, indicating that the linearity of the current method from 0 to 32 ng/mL for the BPA test is excellent in dairy-based coffee.
Similar results were observed in carbonated drinks and orange juice. The detailed data are not presented here. The linear regression equations for carbonated drinks and orange juice are y = 0.97x – 0.09 with R2= 0.9993, y = 0.94x + 0.19 with R2=0.9996, respectively.
Conclusions
The observed results indicate that the method for determination of BPA in carbonated, non-carbonated, and non-alcoholic drinks is precise and reproducible from a single-laboratory validation study, meeting AOAC Official MethodSM performance criteria (7).
Conflicts of interest
The authors declare no competing financial interest.
References
Standard Method Performance Requirement (SMPR®) 2017.018 (2018) J. AOAC Int.
