


Abstract
To analyze PeriData.Net, a clinical registry with linked maternal–infant hospital data of Milwaukee County residents, to demonstrate a predictive analytic approach to perinatal infant risk assessment.
Using unsupervised learning, we identified infant birth clusters with similar multivariate health indicator patterns, measured using perinatal variables from 2008 to 2019 from n = 43 969 clinical registry records in Milwaukee County, WI, followed by supervised learning risk-propagation modeling to identify key maternal factors. To understand the relationship between socioeconomic status (SES) and birth outcome cluster assignment, we recoded zip codes in Peridata.Net according to SES level.
Three self-organizing map clusters describe infant birth outcome patterns that are similar in the multivariate space. Birth outcome clusters showed higher hazard birth outcome patterns in cluster 3 than clusters 1 and 2. Cluster 3 was associated with lower Apgar scores at 1 and 5 min after birth, shorter infant length, and premature birth. Prediction profiles of birth clusters indicate the most sensitivity to pregnancy weight loss and prenatal visits. Majority of infants assigned to cluster 3 were in the 2 lowest SES levels.
Using an extensive perinatal clinical registry, we found that the strongest predictive performance, when considering cluster membership using supervised learning, was achieved by incorporating social and behavioral risk factors. There were inequalities in infant birth outcomes based on SES.
Identifying infant risk hazard profiles can contribute to knowledge discovery and guide future research directions. Additionally, presenting the results to community members can build consensus for community-identified health and risk indicator prioritization for intervention development.
Lay Summary
Despite decades of research and interventions to improve infant health outcomes, there remain stark differences in who will likely reach their first birthday. The gap in effective interventions to reduce infant mortality among non-Hispanic Black birthing parents and infants may stem from ineffective assessment or detection of causes and risks. This study used analytical models to demonstrate an approach to maternal and infant risk assessment using data from a perinatal clinical registry. The results yielded 3 infant groups: healthy infants, late preterm infants, and early preterm infants. The early preterm infants had the worst health at birth and were from the 2 lowest economic and educational levels in Milwaukee County, WI. The 2 strongest predictors of an infant being in the early preterm group were maternal pregnancy weight loss and 6 or fewer prenatal visits. Identifying maternal and infant health predictors informs clinical practice, knowledge discovery, and future research directions. In addition, presenting the results to community members can build consensus for community-identified intervention development.
Background and significance
Infant mortality rate (IMR) is a critical indicator of health for whole populations, as it reflects the structural factors that affect the health and well-being of people.1 The CDC2 defines IMR as the number of infant deaths for every 1000 live births. In 2020, the US IMR was 5.4 deaths per 1000 live births, ranking 36th out of 49 Organisation for Economic Co-operation and Development (OECD) countries.3 However, not all populations within the US experience the same IMR. Specific people are at higher risk of infant mortality due mainly in part to social and structural determinants of health, not based on biological differences among races.4–6 Scholars conceptualize inequitable risk as a social disadvantage.
Social disadvantage is the “unfavorable social, economic, or political conditions that some groups of people systematically experience based on their relative position in social hierarchies” (p. S151).7 Social disadvantage precludes people from enjoying and benefiting from societal progress. For example, individuals with low socioeconomic status (SES), those who do not identify as White, or who are women, may experience social disadvantage at higher rates than White males. Health disparities are adverse differences in health outcomes experienced by socially disadvantaged groups.7 Health disparities experienced by pregnant and birthing people with social disadvantages can adversely affect birthing parents and infants across the life course.8–11
In particular, the lived experience of being Black in the US places Black infants at higher risk of poorer birth outcomes.12 Non-Hispanic Black infants have the highest national IMR at 10.75 deaths per 1000 live births, followed by Native Hawaiian or other Pacific Islander (9.39 deaths per 1000 live births), American Indian/Alaska Native (8.15 deaths per 1000 live births), Hispanic (4.86 deaths per 1000 live births), non-Hispanic White (4.63 deaths per 1000 live births), and Asian infants (3.63 deaths per 1000 live births).13 The disparities by racial and ethnic groups in Wisconsin are even more disparate than the national statistics.
Wisconsin leads the nation with the highest mortality rate for infants of non-Hispanic Black women at 14.28 per 1000 live births.14 The IMR of non-Hispanic Black infants has consistently been 2–3 times worse than White birthing parents for over 30 years in Wisconsin.15 Furthermore, the March of Dimes Report card,16 which grades maternal and infant health outcomes, gave Milwaukee County and the City of Milwaukee an “F” for worsening preterm delivery at 12.0% (Milwaukee County) and 12.9% (City of Milwaukee). Stress over the life course, experienced by non-Hispanic Black women disproportionally, is a potential contributing factor to premature birth.17–19 Stressors may include low SES and structural racism.17,18,20 Moreover, inequitable distribution of resources and lack of access to high-quality and just healthcare may also contribute to the increased prevalence of premature birth of infants in Wisconsin, disproportionately impacting ethnic and racial minority populations.21
Despite decades of research and interventions to improve infant health outcomes, there remain stark differences in who will likely reach their first birthday.13,22,23 The gap in effective interventions to reduce infant mortality among non-Hispanic Black birthing parents and infants may stem from ineffective assessment or detection of root causes and risks.10 Traditional analytical methods for identifying infant and maternal health risks tend to assess complex interactions and nonlinear systems inadequately.24 Sufficient resources are seldom available among local, state, and federal agencies to collect and analyze data to demonstrate cause–effect relationships between multiple social, behavioral, and environmental exposures and maternal and infant health outcomes. The assumptions of linear relationships or parametric data further complicate deciding how and what to measure. The inability to characterize exposure and risk in the multivariate space results in the need for alternative methods to identify and develop maternal and infant intervention priorities.25
Researchers can overcome the limitations of traditional analytical methods using artificial intelligence models or artificial neural networks (ANNs). One approach is to apply self-organizing maps (SOMs) to large clinical databases or clinical registries to illustrate the proximity of similar variables within the complex systems that encompass social, behavioral, mental, and physical health. The SOM technique, and other neural net algorithms, is a learning process tolerant of nonlinear and nonparametric data. The method implemented here using JMP 16 (©2021 SAS Institute) is a simple variation on k-means clustering. SOMs create clusters (ie, 2-dimensional “maps”) of data near each other in the multivariate space. Observations in proximal clusters are more spatially and temporally similar than those in distal clusters.26 The SOM process does not rely on assumptions of linear relationships or parametric data. This approach helps researchers overcome challenges of nonlinearity and skewed data distributions that often occur in clinical data.25,27
Various disciplines have utilized ANN since first described by McCulloch and Pitts.28 For example, in the financial literature, neural networks and similar artificial intelligence models outperformed traditional analytical methods to predict financial fraud29 and banking and financial crises.30,31 Also, the prediction of SOM cluster membership based on public health outcome data using ANNs has been successfully applied to cause-of-death and birth outcomes24 and neonatal mortality risk of newborns in Brazil.32 Developing similar predictive models using perinatal clinical data registries (such as PeriData.Net) could allow efficient and robust identification of maternal and infant health and risk hazard profiles to inform knowledge discovery and future research directions. In addition, presenting the results to community members can build consensus for community-identified health and risk indicator prioritization for intervention development.
Objective
The study’s objective was to use PeriData.Net, a clinical registry with linked maternal–infant hospital data of Milwaukee County residents, to demonstrate a predictive analytic approach to perinatal infant risk assessment.
Materials and methods
PeriData.Net
PeriData.Net is a web-based comprehensive perinatal clinical registry, created through an academic-practice partnership in 2006 across Wisconsin’s birthing hospitals. It contains a comprehensive de-identified dataset encompassing fields required for vital records, care processes, and outcomes with linked maternal and newborn data. Birthing hospital clinicians enter Peri-Data and use it for internal reporting, quality improvement, and secure electronic transmission of data to vital records and other external data registries.33 The Wisconsin Maternal Infant Outcomes Study (WI-MIOS) houses a subset of the PeriData.Net perinatal clinical registry database from 2008 to 2019, comprised of 14 birthing hospitals and 87 552 birth records. This study analyzed PeriData.Net perinatal clinical registry data in Milwaukee County, WI. The University of Wisconsin-Milwaukee’s Institutional Review Board approved this study (IRB #: 22.142) as Exempt Status under Category 4 as governed by 45 CFR 46.104(d).
Analytical framework
We adapted the risk assessment framework developed by the World Health Organization (WHO)34 as the framework for this study, see Figure 1. The WHO defines Risk as the complex function of the Probability of suffering harm or loss (adverse outcome) from exposure and susceptibility to some Hazard. In this study’s context, risk assessment is the scientific process used to estimate the threat that particular hazards pose to pregnancy, birth, and infant outcomes. We can use these methods to engage in risk management first to identify what factors can be mitigated or managed and second to focus on identifying predictors to address in clinical and community settings.

Adapted risk assessment framework developed by the World Health Organization. Pregnancy, birth, and infant outcome risk is the complex function of a hazard, exposure, and susceptibility.
Unsupervised learning
We used SOMs, an ANN technique, to accomplish unsupervised learning to form infant birth outcome SOMs.24,25 SOMs enable an analysis of high-dimensional data without a priori knowledge.25 SOMs are created without supervision through competitive learning and neighborhood adaptation. SOMs autonomously organize the data by grouping similar data in a similar multivariate, forming clusters, and revealing underlying patterns or relationships.24,25,27 Models were constructed using infant data from PeriData.Net, routinely collected data from birthing hospitals in Wisconsin. Before analysis, we transformed these health data to adjust for heteroscedasticity (log10 for quantities and arc-sin for proportions). We used the k-means SOM clustering feature of JMP Pro 16.2 (©2021 SAS Institute) to categorize the infant data into clusters that described groups of infants with similar patterns of birth outcomes. We used the default methods in JMP Pro 16.2, hold back proportion 0.333, 3 hidden layers, a learning rate of 0.1, and the squared penalty method. The clusters used data aggregated between 2008 and 2019 measured using clinical data from PeriData.Net from Milwaukee County, WI residents from 2008 to 2019. We used previously known indicators of birth outcomes, weeks/days gestation, heel-crown length, Apgar score at 1 min, and Apgar score at 5 min5,35,36 to create the clusters. Although various factors influence and there are limitations of the Apgar score34 (eg, maternal sedation, interobserver reliability, and it cannot predict morbidity or mortality for an individual infant), it is an accepted and convenient assessment of an infant’s physiological status after birth.
There is no definitive method for determining the number of clusters in SOMs.27 We ran the SOM analysis for 2, 3, 4, and 5 clusters. To maintain the anonymity of the deidentified dataset and sufficient numbers of individuals in each cluster, we choose only to include clusters with >1000 infants. Three SOMs included at least 1000 individuals in each cluster; 2, 4, and 5 clusters did not. We used principal component analyses to display and visualize the clusters.
Supervised learning model
Next, we applied supervised learning methods to predict the relationships between the birth indicator patterns and maternal predictive factors of clinical interest. To illustrate this step, we choose maternal factors of pre-pregnancy weight, pregnancy weight change, pre-pregnancy BMI, gestational diabetes (yes/no), and the number of prenatal visits. We included pre-pregnancy weight and pre-pregnancy BMI to explore the relationships between weight and body composition indicators and infant outcomes. We applied supervised learning to predictive variables using the ANN prediction model constructed in JMP 16 (©2021 SAS Institute). They created predictive models for cluster membership. We used the K-fold hold-back validation method to verify the model. Figure 2 displays the artificial neural networks methodology.
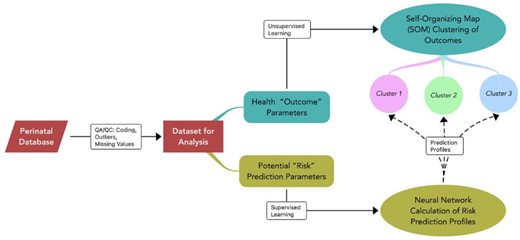
Artificial neural networks unsupervised learning: self-organizing map (SOM) and supervised learning: identify factors predicting SOM cluster identity. SOMs were created without supervision through a process of competitive learning and neighborhood adaptation. SOMs autonomously organize the data by grouping similar data in a similar multivariate, forming clusters, and revealing underlying patterns or relationships. The data used to create the SOM were, weeks/days gestation, infant heel-crown length, Apgar score at 1 min, and Apgar score at 5 min. Next, we applied supervised learning methods to predict the relationships between the birth indicator clusters and maternal predictive factors of clinical interest using neural network calculation of risk. The maternal factors for the prediction profiles included, pre-pregnancy weight, pregnancy weight change, pre-pregnancy BMI, gestational diabetes (yes/no), and the number of prenatal visits.
Spatial pattern of infant birth outcome SOMs by SES
To understand the relationship between socioeconomic factors and outcome cluster assignment, we recoded each Milwaukee County zip code in Peridata.Net according to the Milwaukee Health Report SES levels. The SES levels are calculated from income, based on median reported income values within the ZIP codes, and education, based on the percentages of people with bachelor’s degrees education birth (ie, Low, Medium-Low, Medium, Medium-High, and High).37 First, we analyzed the equality of birth outcomes across Milwaukee zip codes by tabulating SES by birth SOM cluster. Then to understand the equity of birth outcomes across Milwaukee zip codes, we tabulated the percentage of SES levels in each birth SOM cluster.
Results
The analysis included 43 988 people who gave birth between 2008 and 2019 and resided in Milwaukee County, WI. One hundred percent of the sample were reported as female, with a mean age of 26.9 (SD = 6.04) years, and 55.43% with an education level of a high school degree, GED, or lower. The majority of the sample was reported as a minority race, with 45.91% identified as Black or African American. Most births were billed to Medicaid insurance (69.58%). Table 1 displays the Maternal Sample Characteristics.
Maternal sample characteristics (N = 43 988).
| n (%) | |
|---|---|
| Gender | |
| Female | 43 988 (100) |
| Age | |
| <20 | 4846 (11.02) |
| 21–25 | 12 095 (27.50) |
| 26–30 | 12 266 (27.88) |
| 31–35 | 9460 (21.51) |
| 36–40 | 4325 (9.83) |
| 41+ | 968 (2.20) |
| Race | |
| White | 18 000 (40.92) |
| Black or African American | 20 195 (45.91) |
| Asian or Pacific Islander | 1945 (4.42) |
| American Indian or Alaska Native | 258 (0.59) |
| Other | 1891 (4.30) |
| Unknown | 1699 (3.86) |
| Educational level | |
| 8th grade or less | 1643 (3.74) |
| 9th–12th grade/no diploma or less | 7663 (17.42) |
| High school degree or GED | 15 073 (34.27) |
| Associate degree | 2901 (6.59) |
| Some college credit, but not a degree | 7689 (17.48) |
| Bachelor’s degree | 6117 (13.91) |
| Graduate degree | 1766 (4.01) |
| Doctorate or Professional degree | 611 (1.39) |
| Unknown | 525 (1.19) |
| Insurance | |
| Medicaid, BadgerCare Plus | 29 528 (67.13) |
| Private insurance | 12 034 (27.36) |
| Other Government (Federal, State, Local), CHAMPUS, TRICARE, or Indian Health Service | 71 (0.16) |
| Self-pay | 719 (1.63) |
| Unknown | 1636 (3.72) |
Infant birth outcome SOMs
Three unique SOM clusters were created, visualizing infant birth outcome patterns similar in multivariate space. Generally, these clusters contain very healthy full-term infants, late preterm infants, and early preterm infants. Cluster 1 included the healthiest infants: mean gestational age was 39.44 (SD = 0.92) weeks, with the highest averages of infant length and Apgar scores at 1 and 5 min. In cluster 2, the mean gestational age was 37.37 (SD = 1.85) weeks, close to the same averages of infant length, and Apgar scores at 1 and 5 min as cluster 1. Cluster 3 includes the sickest infants; the mean gestational age is 31.11 (SD = 6.61) weeks, and the lowest averages of infant length and Apgar scores at 1 and 5 min after birth compared to clusters 1 and 2. Table 2 displays the Infant Outcome Variables by Birth Self-Organizing Map Cluster.
Infant outcome variables by birth self-organizing map cluster.
| Birth SOM cluster | N | Mean APGAR 1 (min) | SD APGAR 1 | Mean APGAR 5 | SD APGAR 5 | Mean crown-heel length (CM) | SD crown-heel length | Mean gestational age (weeks) | SD gestational age |
|---|---|---|---|---|---|---|---|---|---|
| 1 | 23 350 | 7.91 | 1.04 | 8.94 | 0.31 | 51.69 | 1.84 | 39.44 | 0.92 |
| 2 | 9281 | 7.85 | 0.94 | 8.90 | 0.35 | 47.29 | 2.31 | 37.37 | 1.85 |
| 3 | 1237 | 3.02 | 1.80 | 5.41 | 2.28 | 40.92 | 8.20 | 31.11 | 6.61 |
| N/Aa | 10 120 | 7.66 | 1.49 | 8.79 | 0.85 | 44.58 | 8.38 | 38.04 | 3.36 |
Abbreviations: CM, centimeters; min, minute; SD, standard deviation; SOM, self-organizing map.
Missing one or more variable, not assigned to a birth SOM cluster.
Supervised learning model
A supervised learning model was used to understand which factors potentially predict birth outcome cluster membership. To illustrate this step, we choose maternal factors of weight pre-pregnancy, pregnancy weight change, BMI pre-pregnancy, gestational diabetes (Yes/No), and the number of prenatal visits. These graphs illustrate how maternal factors predict SOM birth outcome cluster membership. Figure 3 is an example of an individual risk profile of a pregnant person with a pre-pregnancy weight of 125 Lbs., 30 Lbs. weight gain, a pre-pregnancy BMI of 25, who does not have gestational diabetes, and who completed 12 prenatal care visits during their pregnancy. The triangles indicate the sensitivity and direction of a predictive factor. For example, if a pregnant person has the individual risk profile described above, the infant has a higher probability (0.972) of being in SOM birth cluster 1, the healthiest birth outcome cluster. The sensitivity indicator triangles are pointed down in SOM birth clusters 2 and 3, indicating a lower probability of an infant being in SOM birth cluster 2 (0.028) or SOM birth cluster 3 (0.0003) with an individual woman with these factors. There is a difference in the sensitivity of pre-pregnancy birth weight and pre-pregnancy BMI as predictors for infant outcome cluster assignment, demonstrating the need to include both predictor factors in the analysis.
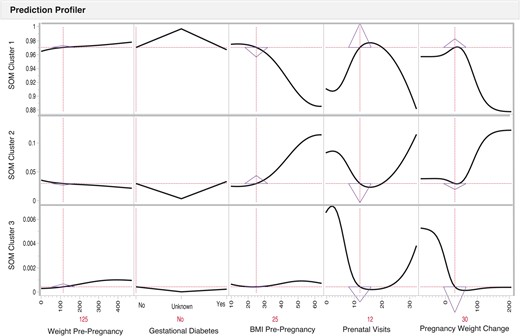
Risk prediction profiles for the SOM birth clusters identification using directed-learning neural network models of a pregnant person with a pre-pregnancy weight of 125 pounds, a 30-pound pregnancy weight gain, a pre-pregnancy BMI of 25, who does not have gestational diabetes, and who completed 12 prenatal care visits during their pregnancy. The pregnant person factors indicate the level of risk factors for an infant; y-axis indicates the probability for an infant to be classified within a specific SOM cluster when pregnant person’s factors exhibit a specific level of the predictor on the x-axis. A pregnant person has the individual risk profile described above, the infant has a higher probability (0.972) of being in SOM birth cluster 1, the healthiest birth outcome cluster. The sensitivity indicator triangles are pointed down in SOM birth clusters 2 and 3, indicating a lower probability of an infant being in SOM birth cluster 2 (0.028) or SOM birth cluster 3 (0.0003) with an individual woman with these factors. There is a difference in the sensitivity of pre-pregnancy birth weight and pre-pregnancy BMI as predictors for infant outcome cluster assignment, demonstrating the need to include both predictor factors in the analysis.
However, Figure 4 illustrates an example of a pregnant person with a pre-pregnancy weight of 125 Lbs., a pre-pregnancy BMI of 25, who does not have gestational diabetes, and who completed 6 prenatal care visits and experienced a 5 Lbs. weight loss during their pregnancy. In this case, the risk of the infant being in SOM cluster 3 increases by 18 233% (0.03% vs 5.5%). Prediction profiles of the infant birth clusters show that clusters are most sensitive to pregnancy weight change and the number of prenatal visits. Table 3 reports the birth outcome cluster assignments for the individual profiles discussed in the previous 2 paragraphs and illustrated in Figures 3 and 4.
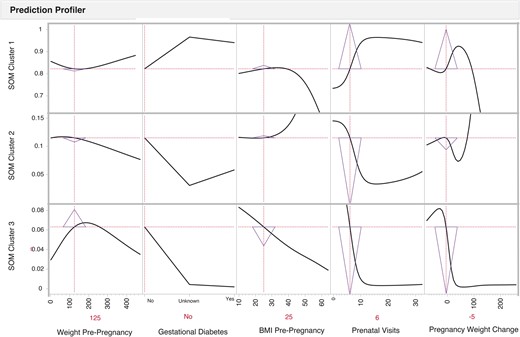
Risk prediction profiles for the SOM birth clusters identification using directed-learning neural network models of a pregnant person with a pre-pregnancy weight of 125 pounds, a pre-pregnancy BMI of 25, who does not have gestational diabetes, and who completed 6 prenatal care visits and experienced a 5-pound weight loss during their pregnancy. The pregnant person factors indicate the level of risk factors for an infant; y-axis indicates the probability for an infant to be classified within a specific SOM cluster when pregnant person’s factors exhibit a specific level of the predictor on the x-axis. The sensitivity indicator triangles are pointed up in SOM birth cluster 1 (.839) and down in SOM birth clusters 2 (0.106) and 3 (0.055), indicating a lower probability of an infant being in SOM birth cluster 2 or SOM birth cluster 3 with an individual woman with these factors. However, the sensitivity triangles illustrate the change in probability from the prediction profiler illustrated in Figure 3.
Comparison of maternal predictors and birth outcome cluster assignment.
| Individual profile | Birth outcome cluster assignment | |||
|---|---|---|---|---|
| 1 | 2 | 3 | ||
| 1 |
| 97.2% | 2.8% | 0.03% |
| 2 |
| 83.9% | 10.6% | 5.5% |
| Individual profile | Birth outcome cluster assignment | |||
|---|---|---|---|---|
| 1 | 2 | 3 | ||
| 1 |
| 97.2% | 2.8% | 0.03% |
| 2 |
| 83.9% | 10.6% | 5.5% |
Abbreviations: PNV, prenatal visits; Wt, weight.
Pattern detection at the aggregate or population level illustrates to what extent does a population with these factors have the collective probability of having an infant in one of these birth clusters. Or how sensitive a change in a factor or factors influences the probability of the assignment to a SOM birth outcome cluster. Like the individual prediction profile, the aggregate or population level prediction profiler SOM birth cluster assignment was most sensitive to pregnancy weight loss and 6 or fewer prenatal visits (Supplementary Material).
Spatial pattern of infant birth outcome SOMs by SES
The spatial patterning of birth outcome SOM clusters indicated that zip codes with the highest SES had 16 percentage points more infants in cluster 1, the healthiest birth cluster compared to the lowest SES zip codes (81% vs 65%). In cluster 2, the lowest SES was almost 1.82 times more likely to have an infant than the highest SES and 3 percentage points higher than the Medium-Low and Medium SES levels. Infants born to birthing parents living in the Low, Medium-Low, and Medium SES levels were twice as likely as the Highest SES to have an infant assigned to cluster 3 (4% vs 2%), the sickest infant cluster. These results are displayed in Figure 5.
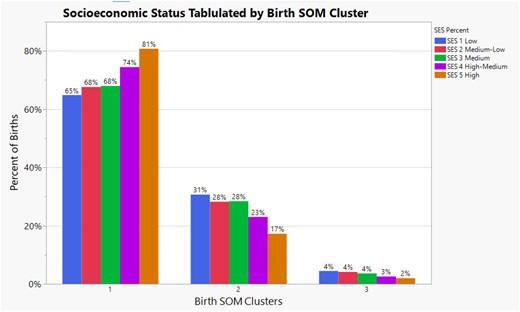
Illustrates the percent of births within each self-organizing birth map cluster by socioeconomic status level in Milwaukee County. It also illustrates the inequality of self-organizing birth map cluster assignment at each socioeconomic status level.
We also analyzed the percentage of birth outcome SOM cluster representation by SES level. In this spatial patterning analysis, 42% of infants in cluster 3 were from the lowest SES level. Nearly three-fourths (71%) of infants in birth outcome SOM cluster 3 were from the Low and Medium-Low SES levels versus 3% in the Highest SES level. These results are displayed in Figure 6.
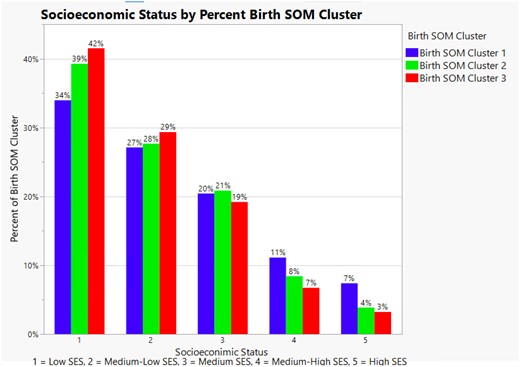
Illustrates the percent of self-organizing birth map cluster assignment by socioeconomic status level in Milwaukee County. It also illustrates the inequity of self-organizing birth map cluster 3 assignment at the lowest 2 socioeconomic status levels.
Discussion
A barrier in studying maternal and infant health is the inability of traditional analytical methods to detect, quantify, and illustrate risk from multiple exposures.38,39 However, the 2-step SOM cluster analysis of infant birth outcomes combined with supervised learning to develop risk profiles successfully identified key maternal indicators related to infant health, thereby overcoming traditional analytical limitations to uncover hidden health and risk hazard patterns. These analyses allowed us to look at infant health outcomes at the population level and how changes in individual variables affect the probability of a community having more or fewer infants in a probabilistic way, going into one birth outcome cluster or the other. The graphs illustrate the interrelatedness of factors that may be more prevalent in particular communities or zip codes. Researchers can use NNA to predict future maternal and infant health trends, answering the questions “when,” “where,” “how,” and “why.”40
Pregnancy weight loss and <6 prenatal visits exhibit a strong risk relationship with patterns in infant birth outcomes. These results affirmed known clinical indicators and added the multivariate space, which may signal broader influences on outcomes. For example, people may lose weight during pregnancy due to clinical conditions, that is, persistent or intractable nausea and vomiting,41 messaging from providers that weight loss in pregnancy may be beneficial for the dyad,42 lack of knowledge regarding the impact of nutritional intake on fetal development, or limited access to nutritious foods.43 Food insecurity, lack of access to nutritionally safe and adequate food needed to support a healthy life,44 affects 10%–30% of pregnant people.45 Social determinants of health, including food insecurity, are often not screened for during obstetric visits; therefore, the prevalence in pregnant populations is unknown and must be further explored.43 The missed opportunity to identify and provide resources to pregnant people who experience food insecurity may contribute to poorer maternal and birth outcomes.43
We analyzed birth outcome cluster representation geospatially using the SES level. The spatial analysis revealed the (in)equality and (in)equity of birth outcomes by economic and educational levels. Health equality is the concept that every person has the same opportunity to access care, services, and resources, whereas health equity removes social, structural, political, and racialized barriers so “everyone has a fair and just opportunity to attain their highest level of health” (para 1).46,Figure 4 displays the equality of infant birth SOM outcomes. When comparing the percentages of infant birth SOM outcomes, one may surmise that the predicted probability of an infant in cluster 3 is low (2%–4%). However, when analyzed with an equity lens, Figure 6 displays the significant inequality of proportion of infant birth SOM outcomes cluster 3 in the 2 lowest SES areas in Milwaukee County. Some of the root causes of the infant birth SOM cluster 3 inequities can be traced to historic redlining and strategic disinvestment in the Milwaukee zip codes.47
The racial and structural inequities uphold how certain women experience the healthcare system and perpetuate significant disparities due to those interactions.48 Addressing gendered racism requires understanding and focusing on its multiple social and structural dimensions that broadly impact individual and public health.49,50 One strategy to understand how women are experiencing the healthcare system is to cultivate community members’ wisdom and lived experience through community-based participatory research.51,52 This study identified inequalities in infant birth outcomes based on SES. However, it is through the democratization and contextualization of clinical and community knowledge (ie, knowledge equity) that the health of birthing parents and infants can be improved. Furthermore, presenting the results to community members can build consensus for community-identified health and risk indicator prioritization for intervention development. The risk of unhealthy births may decrease through community prioritization, intervention co-development, and resource reallocation.47,53
Conclusion
The study’s objective was to use perinatal clinical registry data of Milwaukee County residents to demonstrate a predictive analytic approach to perinatal infant risk assessment. The method yielded 3 infant outcome SOM clusters, including term, late preterm, and early preterm infants. The maternal predictors of infant outcome SOM cluster assignment aligned with clinical knowledge.35 The results also indicated inequity among the SES levels, with the vast majority of early preterm infants being born in the 2 lowest educational and income areas of Milwaukee County. This study demonstrated an innovative use of a perinatal clinical registry applying ANN analyses leading to actionable results for clinical care and communities. We plan to present the study’s results to community members to honor community wisdom, prioritize intervention co-development, and collectively work on resource reallocation.
Author contributions
All authors contributed significantly to the article. J.M.H., A.T., T.S.J., and T.E. were responsible for the design and execution of the study. J.M.H. and T.E. contributed to the analysis. All authors contributed to drafting the article and final approval of the article. We confirm all patient/personal identifiers have been removed so the patient/person(s) are not identifiable and cannot be identified through the details of the article.
Supplementary material
Supplementary material is available at JAMIA Open online.
Funding
This research received no specific grant from any funding agency in the public, commercial, or not-for-profit sectors.
Conflict of interest
None declared.
Data availability
The data underlying this article cannot be shared publicly due to the data use agreement between the University of Wisconsin-Milwaukee and the birthing hospitals. The data may be shared upon reasonable request to the corresponding author.
References
What is Health Equity?
