


Abstract
The primary aim of this study was to apply a novel technology acceptance model (TAM) for virtual reality (VR) in healthcare. The secondary aim was to assess reliability of this model to evaluate factors that predict the intentions of pediatric health providers’ use of VR as an anxiolytic for hospitalized pediatric patients.
Healthcare providers that interacted with pediatric patients participated in a VR experience available as anxiolysis for minor procedures and then completed a survey evaluating attitudes, behaviors, and technology factors that influence adoption of new technologies.
Reliability for all domain measurements were good, and all confirmatory factor analysis models demonstrated good fit. Usefulness, ease of use, curiosity, and enjoyment of the VR experience all strongly predict intention to use and purchase VR technologies. Age of providers, past use, and cost of technology did not influence future purchase or use, suggesting that VR technologies may be broadly adopted in the pediatric healthcare setting.
Previous VR-TAM models in non-healthcare consumers formulated that age, past use, price willing to pay, and curiosity impacted perceived ease of use. This study established that age, past use, and cost may not influence use in healthcare. Future studies should be directed at evaluating the social influences and facilitating conditions within healthcare that play a larger influence on technology adoption.
The VR-TAM model demonstrated validity and reliability for predicting intent to use VR in a pediatric hospital.
Lay Summary
Acceptance of virtual reality (VR) in healthcare has been evaluated by a technology acceptance model (TAM) known as VR TAM, but these studies were limited to nursing students and psychiatrists. This study explored the validity and reliability of a VR TAM to predict the intentions of 270 pediatric health providers to use VR as an anxiolytic for hospitalized pediatric patients. Usefulness, ease of use, curiosity, and enjoyment of the VR experience strongly predicted intention to use and purchase VR technologies. Age of providers, past use, and cost of technology did not influence future purchase or use, suggesting that VR technologies may be broadly adopted in the pediatric healthcare setting. Future studies should evaluate the social influences and facilitating conditions that influence technology adoption.
Introduction
The technology acceptance model (TAM) is the predominant paradigm used to predict consumer use of new technologies.1–4 Davis1 developed the original TAM under the assumption that attitudes toward technologies are the primary determinants of intention to use. Predictions in the model stem from consumer perceptions of a technology’s usefulness and ease of use.5 Rigorous study in the years following the original model has resulted in not only its validation, but many variations targeting novel technologies.3,5–10
Despite our dependence on technology in healthcare, numerous barriers exist to adopting new technology in practice, including infrastructure for troubleshooting, accessibility across clinical platforms, ease of use in time-limited clinical settings, and perceived usefulness to care.2,11 In 2010, Holden and Karsh2 used the TAM framework to evaluate health information acceptance, demonstrating the applicability of the TAM to healthcare. TAMs have since predicted intent to use for contact tracing technology, telehealth, patient telemonitoring, and handheld medical devices.8,12–15 Continued use of TAMs in healthcare help predict acceptance of current medical technologies and influence development of novel ones.
Virtual reality (VR) is a new class of technologies striving for consumer acceptance, with applications both within and beyond healthcare. A 2019 VR acceptance model incorporated perceived enjoyment, age, curiosity, past use, and price willing to pay as factors to predict VR usage. Manis and Choi16 evaluated this VR TAM model among non-healthcare professionals. Within healthcare, although research has supported the usefulness of VR technology for anxiolysis in pediatric clinical settings, widespread clinical adoption is lacking.17,18 VR TAMs targeting allied health professionals may help predict the factors that contribute to acceptance. VR TAMs have been proposed for psychiatrists’ utilization of VR for treatment of mental health conditions and the use of VR for airway management training with nursing students.19,20 These studies were useful in determining factors associated with intent to use in these focused areas. However, VR’s use for pediatric anxiolysis has broad applications, ranging from procedural anxiolysis to bedside wellness, necessitating a VR TAM that predicts utilization from a range of healthcare professionals.18
Objectives
The primary aim was to model factors that predict the behavioral intentions of pediatric health providers’ use of VR as an anxiolytic for hospitalized pediatric patients. The secondary aim assessed the reliability of the TAM measurements for modeling use in this healthcare context.
Methods
Context and setting
This study was conducted at Lucile Packard Children’s Hospital Stanford (LPCHS) (Stanford University, Palo Alto, CA). Oculus Go VR headsets (Meta, Inc., Menlo Park, CA) displayed the application Pebbles the Penguin (Stanford Chariot Program, Palo Alto, CA). During gameplay, a penguin slides down a snowy landscape, collecting fun objects for points. This application is intuitive to play, encouraging, lacks a fail-state, and has been used in the healthcare setting to reduce pediatric anxiety.21 The VR headsets were compliant with infection control standards at LPCHS and consistent with hospital instrument and electrical compliance.
Inclusion criteria were health professionals who directly interacted with patients, including physicians (faculty and trainees), nurses, nurse practitioners (NPs), physician assistants (PAs), child life specialists, and technicians. Exclusion criteria were providers with nausea, motion sickness, seizure disorders, and active illness. Physicians practicing anesthesia were excluded due to participation in a conflicting study protocol. The Stanford University Internal Review Board approved a waiver of consent, and there were no financial payments for participation.
Intervention
Trained research assistants (RAs) recruited in multiple areas of the hospital, including the perioperative breakroom, outside the cafeteria, and on the acute care floors. RAs sequentially solicited volunteer healthcare workers for participation. Different areas of the hospital were chosen to maximize heterogeneous recruitment. Upon enrollment, RAs provided participants with descriptions of the clinical use of the VR experience for anxiolysis during minor procedures, such as phlebotomy or intravenous placement. Participants completed a brief demographic survey and were then fitted with the VR headset. RAs oriented participants to the application, and participants played the game for approximately 2 min. Following the experience, participants completed a survey adapted for healthcare providers, derived from a previously validated VR acceptance model (Appendix SA).16
Outcomes
The primary outcome was to determine the predictive validity of the VR TAM for pediatric distraction and anxiolysis within a heterogenous group of pediatric providers. The secondary outcome explored the reliability of the VR TAM in this pediatric healthcare setting.
Measures
Demographic data collected prior to intervention included age, gender, race, clinical role, years of employment, and prior VR utilization. The TAM surveyed aspects of perceived usefulness, perceived ease of use, perceived enjoyment, intention to use, intention to purchase, and curiosity.16 The model was modified to assess predictability specifically in pediatric clinical settings. Items were answered on a 1–5 Likert scale, ranging from strongly disagree (1), neither agree or disagree (2), neither agree or disagree (3), mostly agree (4), and strongly agree (5) (Appendix SB). Price willing to pay was measured with $200 frequencies ranging from $0 to $1000. Study data were collected and managed securely using REDCap (Research Electronic Data Capture) electronic data capture tools hosted at Stanford University, and available upon request.22,23
VR-TAM hypotheses
This study applied the hypothesis model from Manis and Choi16 for predicting VR acceptance. In this model, metrics were based on prior research supporting their predictive role.24 For example, age impacts ease of use, and participants with past use may have greater perceived usefulness of VR.24,25 Additional domains included in the model stem from those indicative of a participant’s attitudes about VR. Perceived ease of use, perceived usefulness, and perceived enjoyment were established in the earliest versions of the TAM and are widely applicable to technology acceptance. Attitude toward using is influenced by perceived ease of use and perceived usefulness and is an indicator of intention to use. All of these metrics are included in the current VR TAM hypothesis model. Manis and Choi16 uniquely established curiosity, or a participant’s inherent desire to adopt new information, as an indicative factor for VR acceptance. Manis and Choi16 also reported price willing to pay to be a relevant predictor for VR intention to use. These additional domains are reflected in the VR TAM in this study (Figure 1).
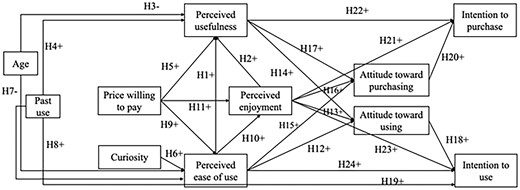
VR technology acceptance hypothesis model (adapted from Manis and Choi). Note: + indicates a positive effect, and − denotes a negative effect.
Analysis
To assess the predictive validity of the VR TAM, means and standard deviations were evaluated for each scale. Confirmatory factor analysis (CFA) was conducted using Mplus 8.6 to test the construct validity, where items over 0.7 are considered satisfactory.26,27 Normal distribution assumptions of the scale items were tested. Wherever the distribution of items in the scale were found to be non-normal, the robust maximum likelihood method was utilized. For all other scales, the maximum likelihood estimation method was performed with Mplus 8.6. Multiple indices were used to evaluate the model fitting, including the comparative fit index (CFI), Tucker–Lewis index (TLI), root mean square error (RMSEA), and standardized residual root mean square (SRMR).28–31 CFI >0.9, TLI >0.9, RMSEA <0.8, and SRMR <0.8 represented acceptable fit. We adopted the dummy coding methods to include the ordinal predictors (age, price willing to pay, and past use) into the model. The reference groups were set as aged 55 or older, $801-$1000 (the highest price group), and no prior experience with VR. The results of the path coefficients were interpreted as the difference between each non-reference group and the corresponding reference group.
To assess the secondary outcome of VR TAM reliability, each scale was evaluated using Cronbach’s and composite reliability.
Results
Demographics
In total, 270 healthcare professionals participated. After excluding responses with missing values, 263 participants were included in the final analyses (Table 1). There were 202 females, 58 males, and 3 participants who chose not to disclose their gender. Among the participants, 189 participants were under 36 years, 43 participants were 36-45 years, 14 participants were aged 46-55 years, and 17 participants were 55 years or older (Table 1).
Demographics.
| Current role | N | Area | N |
|---|---|---|---|
| Child life | 14 | Floor | 6 |
| ICU | 2 | ||
| Periop | 5 | ||
| MD/DO (faculty) | 16 | Pediatric subspecialty | 9 |
| Pediatrics | 5 | ||
| Surgery | 2 | ||
| MD/DO (trainee) | 36 | Pediatric subspecialty | 5 |
| Pediatrics | 23 | ||
| Radiology | 1 | ||
| Surgery | 2 | ||
| Other | 4 | ||
| Nurse | 92 | Floor | 35 |
| ICU | 9 | ||
| Periop | 19 | ||
| Radiology | 1 | ||
| Other | 26 | ||
| Technician | 25 | Floor | 6 |
| Periop | 4 | ||
| Radiology | 11 | ||
| NP | 17 | ||
| PA | 6 | ||
| Medical student | 16 | ||
| Other | 41 |
N denotes the sample size.
Primary outcome: predictive validity of VR TAM
Description of responses
For each domain, mean and standard deviation of responses were: Perceived usefulness (mean 3.896 out of 5, SD 0.906); Perceived ease of use (mean 4.926 out of 6, SD 1.315); Perceived enjoyment (mean 4.615 out of 5, SD 0.687); Intention to use (4.108 out of 5, SD 0.885); Intention to purchase (mean 4.053 out of 5, SD 0.873); Curiosity (mean 3.479 out of 5, SD 0.962); Attitude toward using (mean 4.437 out of 5, SD 0.627), and Attitude toward purchasing (mean 4.380 out of 5, SD 0.695). All responses demonstrated normality except perceived enjoyment.
Confirmatory factor analysis
All CFA models demonstrated good fit. Standardized factor loadings of items ranged from 0.681 to 0.970, suggesting that the construct validity of the different scales was excellent. Only one survey item, “there is a high likelihood that I would support the hospital purchasing VR hardware within the foreseeable future,” within the intention to purchase domain was below 0.7 (Appendix SA). To evaluate model fit, CFA was conducted for the results in all domains (CFI 0.970-1; TLI 0.925-1; RMSEA 0-0.194; SRMR 0-0.021) (Table 2).
Confirmatory factor analysis of the measures.
| Variable | CFI | TLI | RMSEA | SRMR |
|---|---|---|---|---|
| Perceived usefulness | 0.998 | 0.994 | 0.054 | 0.007 |
| Perceived ease of use | 0.970 | 0.925 | 0.194 | 0.021 |
| Perceived enjoyment | 0.994 | 0.964 | 0.094 | 0.003 |
| Intention to use | 1 | 1 | 0 | 0.001 |
| Intention to purchase | 1 | 1 | 0 | 0.002 |
| Curiosity | 1 | 1 | 0 | 0 |
| Attitude toward using | 0.981 | 0.952 | 0.127 | 0.019 |
| Attitude toward purchasing | 0.986 | 0.972 | 0.111 | 0.015 |
Hypothesis diagram
Perceived ease of use was hypothesized to influence perceived usefulness, perceived enjoyment, attitude toward purchasing, attitude toward using, and intention to use. These relationships were all significant (β .398, P < .001 [CI 0.297, 0.498]; β .519, P < .001 [CI 0.429, 0.608]; β .187, P .009 [CI 0.047, 0.326]; β .357, P < .001 [CI 0.228, 0.487]; β .365, P < .001 [CI 0.265, 0.465], respectively) (Figure 2, Table 3).
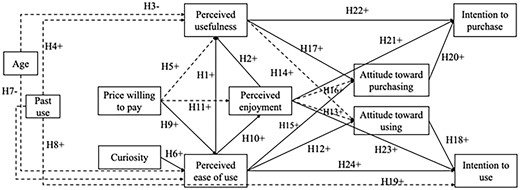
VR technology acceptance model results. Note: Solid paths: significant estimates; dash paths: non-significant estimates.
Standardized estimates of the VR technology acceptance model.
| Predictor | Outcome | 95% CI | |||
|---|---|---|---|---|---|
| H1 | Perceived ease of use | Perceived usefulness | .398** | <.001 | [0.297, 0.498] |
| H2 | Perceived enjoyment | Perceived usefulness | .370** | <.001 | [0.268, 0.471] |
| H6 | Curiosity | Perceived ease of use | .278** | <.001 | [0.165, 0.390] |
| H10 | Perceived ease of use | Perceived enjoyment | .519** | <.001 | [0.429, 0.608] |
| H12 | Perceived ease of use | Attitude toward using | .357** | <.001 | [0.228, 0.487] |
| H13 | Perceived enjoyment | Attitude toward using | .098 | .144 | [−0.033, 0.230] |
| H14 | Perceived usefulness | Attitude toward using | .130 | .069 | [−0.010, 0.270] |
| H15 | Perceived ease of use | Attitude toward purchasing | .187** | .009 | [0.047, 0.326] |
| H16 | Perceived enjoyment | Attitude toward purchasing | .097 | .172 | [−0.042, 0.235] |
| H17 | Perceived usefulness | Attitude toward purchasing | .220** | .003 | [0.074, 0.366] |
| H18 | Attitude toward using | Intention to use | .214** | <.001 | [0.116, 0.312] |
| H21 | Perceived enjoyment | Intention to purchase | .269** | <.001 | [0.171, 0.368] |
| H20 | Attitude toward purchasing | Intention to purchase | .404** | <.001 | [0.323, 0.486] |
| H22 | Perceived usefulness | Intention to purchase | .268 | <.001 | [0.166, 0.371] |
| H23 | Perceived enjoyment | Intention to use | .246** | <.001 | [0.137, 0.355] |
| H24 | Perceived ease of use | Intention to use | .365** | <.001 | [0.265, 0.465] |
| H9 | Price willing to pay ($0-$200) | Perceived ease of use | −.145 | .068 | [−0.302, 0.011] |
| H9 | Price willing to pay ($201-$400) | Perceived ease of use | −.156 | .091 | [−0.337, 0.025] |
| H9 | Price willing to pay ($401-$600) | Perceived ease of use | −.086 | .335 | [−0.260, −0.089] |
| H9 | Price willing to pay ($601-$800) | Perceived ease of use | −.167* | .028 | [−0.316, −0.018] |
| H11 | Price willing to pay ($0-$200) | Perceived enjoyment | −.016 | .821 | [−0.155, 0.123] |
| H11 | Price willing to pay ($201-$400) | Perceived enjoyment | −.040 | .625 | [−0.198, 0.119] |
| H11 | Price willing to pay ($401-$600) | Perceived enjoyment | −.006 | .938 | [−0.162, 0.150] |
| H11 | Price willing to pay ($601-$800) | Perceived enjoyment | −.035 | .608 | [−0.171, 0.100] |
| H5 | Price willing to pay ($0-$200) | Perceived usefulness | −.067 | .276 | [−0.189, 0.054] |
| H5 | Price willing to pay ($201-$400) | Perceived usefulness | −.034 | .640 | [−0.174, 0.107] |
| H5 | Price willing to pay ($401-$600) | Perceived usefulness | −.017 | .803 | [−0.152, 0.118] |
| H5 | Price willing to pay ($601-$800) | Perceived usefulness | .003 | .957 | [−0.113, 0.120] |
| H7 | Age (<36) | Perceived ease of use | .081 | .460 | [−0.134, 0.297] |
| H7 | Age (36-45) | Perceived ease of use | .094 | .362 | [−0.108, 0.295] |
| H7 | Age (46-55) | Perceived ease of use | .084 | .068 | [−0.067, 0.236] |
| H3 | Age (<36) | Perceived usefulness | .023 | .785 | [−0.143, 0.190] |
| H3 | Age (36-45) | Perceived usefulness | .029 | .714 | [−0.127, 0.185] |
| H3 | Age (46-55) | Perceived usefulness | .080 | .181 | [−0.037, 0.197] |
| H19 | Past use (yes) | Intention to use | .003 | .945 | [−0.078, 0.084] |
| H8 | Past use (yes) | Perceived ease of use | .059 | .329 | [−0.060, 0.178] |
| H4 | Past use (yes) | Perceived usefulness | −.010 | .833 | [−0.102, 0.082] |
P < .01,
P <.05. CI, confidence interval. For the categorical variables (age, price willing to pay, and past use), the reference groups were set as the aged 55 or older, $801-$1000 (the highest price group), and no prior experience with VR, respectively. Estimates for these variables indicate the differences between the reference group and other groups.
Curiosity was hypothesized to influence perceived ease of use. This relationship was significant (β .278, P < .001 [CI 0.165, 0.390]) (Figure 2, Table 3).
Price willing to pay was hypothesized to influence perceived ease of use. The price that individuals were willing to pay had a significant effect on the perceived ease of use, as participants with lower price range willing to pay ($601-$800) had lower levels of perceived ease of use compared to those with highest price range willing to pay ($801-$1000) (β −.167, P .028, [CI −0.316, −0.018]) (Figure 2, Table 3). Price willing to pay did not significantly influence perceived enjoyment or perceived usefulness.
Perceived usefulness was hypothesized to influence intention to purchase, attitude toward purchasing, and attitude toward using. The relationship with attitude toward using was not significant (β .130 P .069 [CI −0.010, 0.270]), though the other 2 relationships were significant (Intention to purchase β 0.268, P < .001 [CI 0.166, 0.371] and Attitude toward purchase β .220, P .003 [CI 0.074, 0.366]).
Perceived enjoyment was hypothesized to influence intention to purchase, attitude toward purchasing, attitude toward using, intention to use, and perceived usefulness. The relationships with attitude toward purchasing and attitude toward using were not significant (β .097, P .172 [CI −0.042, 0.235] and β .098, P .144 [CI −0.033, 0.230], respectively), though the other 3 relationships were significant (Intention to purchase β .269, P < .001 [CI 0.171, 0.368]; Intention to use β .246, P < .001 [CI 0.137, 0.355]; Perceived usefulness β .370, P < .001 [CI 0.268, 0.471]).
Attitude toward purchasing was hypothesized to influence Intention to purchase. This relationship was significant (β .404, P < .001 [CI 0.323, 0.486]). Attitude toward using was hypothesized to influence Intention to use and was also significant (β .214, P < .001 [CI 0.116, 0.312]) (Figure 2, Table 3).
All other hypothesis relationships were not significant, including those for age and past use. (Figure 2, Table 3).
Secondary outcome: reliability of measurements
Reliability for all domain results was good, with Cronbach’s results ranging from 0.811 to 0.966 and composite reliability ranging from 0.812 to 0.967, where 0.8 indicates a good level of reliability (Table 4).32
Reliability of the measurement tools.
| Variable | Cronbach’s | Composite reliability |
|---|---|---|
| Perceived usefulness | .943 | .911 |
| Perceived ease of use | .946 | .946 |
| Perceived enjoyment | .966 | .967 |
| Intention to use | .956 | .957 |
| Intention to purchase | .906 | .914 |
| Curiosity | .811 | .812 |
| Attitude toward using | .909 | .909 |
| Attitude toward purchasing | .939 | .939 |
Discussion
Our primary aim demonstrated that the proposed VR-TAM predicted intended clinical utilization for anxiolysis within this group of pediatric providers. Within this model, perceived usefulness, perceived enjoyment, and perceived ease of use were significant predictors of intention to use and intention to purchase. Perceived enjoyment also directly predicted intention to purchase and intention to use, while attitude toward purchasing or attitude toward using did not influence intention. With respect to the secondary aim, all VR-TAM scales demonstrated overall good construct validity and reliability. The curiosity scale requires modifications to improve reliability. The curiosity scale as used in this study had only 3 items, leading to the CFA model to be saturated. Future versions of VR-TAM will require additional items within the curiosity domain.
Based on the ability of the VR-TAM to predict influential variables, a variety of relationships were studied. The VR-TAM that we based our model upon studied non-healthcare consumers and established that age, past use, price willing to pay, and curiosity impacted perceived ease of use.16
In contrast, the age of our participants did not influence perceived usefulness or perceived ease of use. This finding may be attributed to the fact that the collected age was that of the provider and not that of the intended pediatric user. Another possibility might be that the majority of the participants surveyed were age 45 or younger. Perceived usefulness may be better represented in future studies if separated into usefulness for the pediatric patient compared to usefulness for the providers.33 Additionally, past use did not influence perceived usefulness, perceived ease of use, or intention to use. This finding was likely influenced by the large percentage (40%) of participants with previous VR experience. Last, price willing to pay was not a significant predictor of perceived usefulness or perceived enjoyment. This may be unique to the healthcare setting where medical device costs are typically realized by the health system and not the providers directly, or due to the relatively low cost of VR devices compared to other healthcare technologies.
This study had several limitations. First, there may have been selection bias if only individuals interested in VR or novel technologies consented to participate in the study. Second, age was presented as a categorical variable, where the lowest category included all under 36 years. Future studies would benefit from examining participants with a greater range of ages given that most of our participants were under the age of 45. Third, although the VR-TAM was comprehensive, there are still other factors that could impact VR acceptance. The patient or family attitudes toward novel technology were not surveyed, and this could have impacted perceived usefulness. Since VR is a commercially available product, social attitudes toward VR outside of healthcare could influence its acceptance as modeled by VR-TAM.34 Fourth, the providers surveyed may experience stronger subjective norms with VR use compared to providers in a less technology-enriched area. Further studies in limited-resource settings are needed to investigate the generalizability of this VR-TAM in those settings. Fifth, this study evaluated prior use of VR as a binary, categorical variable, which did not measure the context of the prior use, namely personal compared to healthcare. Also, organizational facilitating conditions were not explored.34 Sixth, while this study exclusively studied pediatric providers, additional studies may investigate the role of the VR-TAM in understanding the relationship with VR in other medical specialties. We did not explore potential clinical situations within pediatric care that would be more amenable to VR use. Lastly, it would be valuable to directly compare perspectives using VR-TAM amongst various members of the same healthcare team (physicians, nurses, child life specialists, technicians, physical therapists) to evaluate role-specific traits that influence behavioral intention. This study surveyed members of the healthcare team in various roles but did not collect sufficient sub-group samples to conduct tests of group differences.
Conclusion
The VR-TAM model demonstrated validity and reliability for predicting intent to use VR in a pediatric hospital. Usefulness, ease of use, and enjoyment all strongly predict intention to use and purchase VR technologies. Age, past use, and cost of technology were not strong predictors of future purchase or use, indicating that VR technologies can be adopted broadly. This model may be used for future investigations of behavioral intent. Further research should include expanded role subtypes, various medical specialties, and additional practice environments.
Supplementary material
Supplementary material is available at JAMIA Open online.
Acknowledgments
The authors would like to thank the Stanford Chariot Program and the Foundation for Anesthesia Education and Research (FAER) program.
Funding
This research received no specific grant from any funding agency in the public, commercial, or not-for-profit sectors.
Conflict of interest
T.J.C. and E.Y.W. are on the board of Invincikids, a non-profit organization that seeks to distribute immersive technologies to improve pediatric care. They receive no compensation for their roles. The Stanford Chariot Program has received philanthropic gifts from Meta, Inc., and Magic Leap, Inc.
Data availability
All data underlying this article will be shared upon reasonable request to the corresponding author.
