


Abstract
Determine the extent to which use of Clinical Video Telehealth to Home (VT2H) for primary care licensed independent practitioner visits (PCLIPVs) varied over time and across the Veterans Health Administration (VA) during the first 18 months of the COVID pandemic, and if there was an association between VT2H usage and VA station characteristics.
All outpatient encounters (n = 12 143 456) for Veterans (n = 4 373 638) that had VA PCLIPVs during the period of observation were categorized as conducted by VT2H, in-person, or telephone. The change over time in the percentage of total PCLIPVs conducted by VT2H was plotted and associations between VA station characteristics and VT2H usage were analyzed using simple statistics and negative binomial regression.
Between March 2020 and mid-August 2020, VT2H visits increased from <2% to 13% of all VA PCLIPVs. However, VT2H usage varied substantively by VA station and declined system-wide to <9% of PCLIPVs by July 2021. VA stations that serve a greater proportion of rural Veterans were found less likely to use VT2H.
The VA was successful in increasing the use of VT2H for PCLIPVs during the first phase of the COVID pandemic. However, VT2H usage varied by VA station and over time. Beyond rurality, it is unknown what station characteristics may be responsible for the variance in VT2H use.
Future investigation is warranted to identify the unique practices employed by VA stations that were most successful in using VT2H for PCLIPVs and whether they can be effectively disseminated to other stations.
Lay Summary
Before the COVID pandemic started in March 2020, fewer than 2% of primary care visits across the VA healthcare system (VA) were conducted using video telehealth (VT). During the first phase of the pandemic, the VA was successful in increasing the use of VT. By August 2020, over 13% of primary care visits were completed using VT. However, this varied from one VA medical center to another. In addition, the percentage of primary care visits conducted by VT declined system-wide by July 2021. We found that VA medical centers with a high number of rural Veterans were less likely to use VT. However, there were probably many other unknown factors that also contributed to the large differences in VT usage between VA centers. Future studies are needed to identify the unique practices employed by VA healthcare centers that were most successful in using VT. It would also be important to determine whether these practices can be used effectively by other VA sites.
Background and significance
Veterans living in rural areas have less access to primary care services through the Veterans Health Administration (VA) than Veterans living in urban areas.1,2 As a means of addressing these disparities, the VA developed the VA Video Connect (VVC) software system in 2018 as part of the VA “anywhere to anywhere” campaign which provided secure video telehealth to Veterans’ homes.3 It was hoped that Veterans and VA providers, including those from primary care, would be able to use VVC to conduct virtual in-home healthcare visits. Although the VA dedicated considerable resources to this program, uptake of VVC was initially slow among primary care providers.4–6
With the onset of the COVID pandemic, the VA began implementing a wide range of COVID containment practices. By March 2020, this included limiting in-person outpatient appointments by converting them to virtual visits, unless there was an urgent need to see a Veteran in-person.5 Virtual visits were conducted using virtual platforms approved by the VA (eg, VVC, Doximity and Zoom). When completed successfully, providers generally coded them as Real Time Clinical Video Telehealth to Home (VT2H) visits.7 From March to May 2020, VT2H visits by VA primary care providers increased.7,8 However, many patients and providers found that it was difficult to schedule and complete visits using any of the virtual platforms and favored the use of telephone visits when in-person visits were not possible.4,5,7,8 It is unknown whether the use of VT2H visits by VA primary care providers subsequently changed with time.
The VA is organized into 130 healthcare centers or stations. Each station is headed by at least one VA medical center (VAMC), which is a referral center anchored by a secondary or tertiary hospital. The VAMC may also include multiple additional facilities located throughout the geographic catchment area that can include community-based outpatient clinics (CBOCs), Vet Centers (VC), Outreach Clinics (ORCs), and Rehabilitation Centers (REHAB) among others. In October 2020, the Office of Rural Health within the VA initiated funding for our multisite quality improvement (QI) initiative. The goal of this QI initiative is to better meet the healthcare needs of Veterans receiving primary care through the VA, especially those who are older, have multiple medical or socially complex needs, and reside in rural areas. As VT2H is a potentially important and underdeveloped modality for providing primary care, secondary goals of the initiative are to develop a better understanding of when VT2H is an effective alternative to telephone or in-person visits for this vulnerable population and to develop and test models of practice using VT2H. Although the QI initiative was not developed in response to the COVID pandemic, a greater awareness of the potential benefits of expanding use of VT2H within the VA was created by the pandemic. However, there was little information as to how well the VA was able to incorporate VT2H into routine primary care after the first 2 months of the pandemic and what barriers and facilitators to implementation existed. As a first step to inform planning and QI initiative development efforts, we completed this project that examined VT2H usage by primary care providers across the VA, particularly at the 3 pilot sites for our QI initiative, which included, Ann Arbor (station 506), Little Rock (station 598), and Gainesville (station 573). This article describes the results of this project.
Objectives
The objectives of this project were to determine: (1) the patterns of VT2H usage for primary care licensed independent practitioner visits (PCLIPVs) within the VA from the start of the COVID pandemic until July 31, 2021; (2) if VT2H usage for PCLIPVs was evenly distributed across VA stations; and (3) if there was an association between VT2H usage for PCLIPVs and station-specific characteristics.
Materials and methods
Data sources and population
Data used to support this project were primarily extracted from the VA’s Corporate Data Warehouse (CDW), a data repository for VA electronic health records.9,10 The CDW includes data from all 130 VA stations, which include 170 VA medical centers and 1061 CBOCs that together provide primary care to nearly 9 million enrolled Veterans.5 The National Data Systems group, a division under the Veterans Health Administration Office of Health Informatics Health Information Governance, granted operational access to the CDW in support of the development of this project, which was completed as part of ongoing quality improvement efforts. As it was not considered research activity per VA policy, it was not subject to institutional review board review or waiver. Standards for Quality Improvement Reporting Excellence guidelines were followed in formulating this report.11
Using the VA Managerial Cost Accounting Stop Codes, we identified all encounters for outpatient PCLIPVs from all Patient Aligned Care Teams (PACTs) with a designated primary care provider including primary care providers that are members of Post-Deployment Integrated Care teams, Geriatric Primary Care teams, CBOCs, Clinical Resource Hubs, Women’s Health teams, Primary Care-Mental Health Integration (PC-MHI), and specialty population PACTs like HIV and Spinal Cord Injury.12 Compensation or pension examinations and outpatient visits not flagged as “workload” (ie, did not result in an encounter being completed) were excluded. Based on the stop code and/or stop code pairing, each encounter was also categorized as being conducted either in-person, by telephone, or by VT2H.7,13 It was not possible to determine how many of the visits coded as VT2H were conducted using VVC as opposed to other virtual platforms. All analyses included outpatient encounters for PCLIPVs that took place between January 1, 2020, and July 31, 2021. However, 3 of the 130 VA stations were not included in our analysis. These 3 sites had already begun transitioning to the Cerner Millennium electronic health record (EHR) and our team has not yet developed the expertise to accurately identify encounters for PCLIPVs at these sites from available backend data systems.
Station-level characteristics included VA district (ie, Continental, Midwest, North Atlantic, Pacific, Southeast), the total number of primary care licensed independent practitioners (PCLIPs), percentage of Veterans seen by PCLIPs during the observation period that lived in rural or highly rural areas, and designated station-level complexity. Veteran rurality was defined using Rural Urban Commuting Area (RUCA) codes.14 RUCA codes assign a census tract a degree of urbanization using a scale that ranges from 1 to 10 which takes into consideration population density and commuting time to nearby urban areas. In our analyses, rural Veterans were defined as those with their primary residence found within census tracts assigned to RUCA codes 2–10.15 VA station district and complexity were extracted from the VA Site Tracking Database(VAST). Station complexity is based on the Facility Complexity Level Model which categorizes a healthcare center into 1 of 5 complexity levels.16 Highest complexity stations include those with high patient volume, high-risk patients, and advanced level of services (ie, intensive care units and trauma centers), and they support large research and teaching programs. At the other end of the ranking spectrum, low complexity stations are comprised of facilities with low volume, lower-risk patients, and limited complex clinical services, and they support very few, if any, teaching, and research programs.
Statistical analysis
Trends in the percentage of all encounters for PCLIPVs each week that were conducted by VT2H are presented graphically (Figure 1). We present separate plotted lines for the entire VA (ie, all stations) and specific VA stations that represent a spectrum of VT2H use from low to high. Notably, 3 of the VA stations included in the presented plot represent the 3 pilot sites for our QI initiative. To simultaneously demonstrate trends in percentage of PCLIPVs classified as being conducted in-person, by telephone, or by VT2H, a second visualization was created with separate plotted lines by modality (Figure 2).
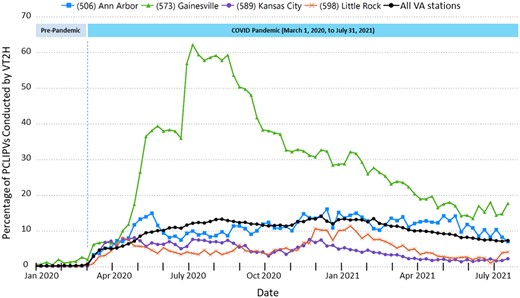
Percentage of PCLIPVs conducted by VT2H by week from January 1, 2020 to July 31, 2021. The 4 VA stations included in the figure represent the spectrum of low to high VT2H use during the period of observation and include the 3 stations that are part of our multisite pilot QI initiative (as listed in the Introduction).
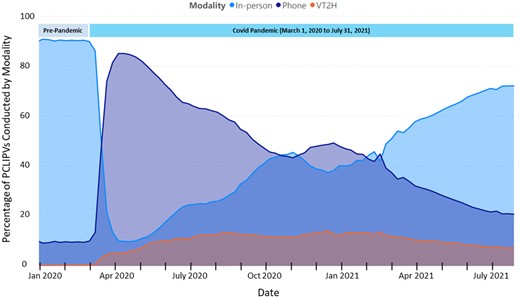
Percentage of All VA visits with a PCLIP conducted in-person, by telephone, or by VT2H from January 1, 2020 to July 31, 2021.
As one method to assess the pattern of high VT2H usage, counts were made by station of the number of weeks in which >30% and >40% of all PCLIPVs were conducted by VT2H. These data are presented in table format.
We conducted more detailed analyses of VT2H use defined as the number of weeks during the observational period where more than 10% of PCLIPVs were conducted by VT2H. We chose a 10% threshold after testing the data for normality and determining the mean proportion of PCLIPVs conducted by V2TH across all stations during the observation period was found to be 9%. Our trend analysis also indicated the majority of VA stations were able to reach this benchmark for one or more weeks; only a minority of stations ever reached the 30% threshold. Means, standard deviations, and proportions were calculated in summarizing station-level characteristics by VT2H use. For the first set of analyses, we categorized VT2H adoption into tertiles (ie, low 0–2 weeks, medium 3–43 weeks, and high 44–72 weeks with 10% or more of PCLIPVs conducted by VT2H) and used chi-square and ANOVA statistical tests to analyze differences in VA station characteristics (eg, # of primary care licensed independent practitioners (PCLIPs), % of patients treated living in rural areas, VA station district, VA station complexity) by tertile grouping. Where appropriate, the relationship between VA station characteristics was examined using Pearson’s Correlation. Due to overdispersion, negative binomial regression was used in examining further the potential association between VT2H use (the dependent variable defined as the number of weeks where >10% of PCLIPVs were conducted by VT2H) and VA station characteristics. We present both unadjusted and adjusted relative risk estimates with 95% confidence intervals. We controlled for rurality and number of PCLIPs in the adjusted model. We also plotted the number of weeks where >10% of PCLIPVs to a given station were conducted by VT2H against the % of Veterans seen at the station who lived in rural areas. To enhance visualization, this relationship was examined using univariable negative binomial regression analysis and the associated regression line was overlaid on the scatter plot (see Figure 3). SAS version 9.4 (SAS Institute; Cary, NC) was used in performing all statistical analyses.
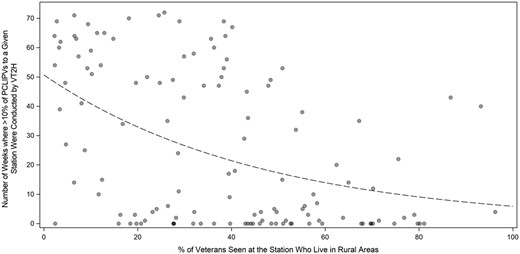
The number of weeks during the COVID-19 Pandemic (January 1, 2020–July 31, 2021) where more than 10% of PCLIPVs to a given station were conducted by VT2H plotted against the % of Veterans seen at the station that live in rural areas. The regression line (black dashes) was generated using univariable negative binomial regression.
Results
In total, 12 143 456 primary encounters on 4 373 638 unique Veterans were included in the analyses of VT2H usage by PCLIPs during the observation period from January 1, 2020 to July 31, 2021. Prior to the start of the COVID pandemic in March 2020, fewer than 1% of these visits were conducted by VT2H (Figure 1). Between March 2020 and mid-August 2020, VT2H visits increased to represent approximately 13% of all PCLIPVs system wide, a change of >1100%. After mid-August 2020, the rate of VT2H usage plateaued until February 2021. From mid-February 2021 until July 31, 2021 (the end of the observation period of this analysis), VT2H visits slowly declined to <8.8% of PCLIPVs.
This represented an approximately 47% decrease in VT2H usage by PCLIPs from what occurred during the initial phase of the COVID pandemic from March 1, 2020 to February 28, 2021.
As with VT2H visits, the percentage of PCLIPVs conducted each week by telephone or in-person also changed substantively over time between January 2020 and late July 2021 (Figure 2). Prior to March 2020, in-person visits accounted for about 90% of all PCLIPVs, but with the onset of the COVID pandemic, this dropped rapidly to represent only about 10% of PCLIPVs by April. In May 2020, the percentage of visits conducted in-person started to increase and continued to rise steadily until November 2020 when it dropped modestly. By mid-December 2020, the percentage of visits conducted in-person started to increase again and continued to rise through the rest of the observation period representing about 70% of total visits by the end of July 2021. The number of visits conducted by telephone changed in inverse proportion to the change in in-person visits throughout this same period. The absolute number of PCLIPVs did not change appreciably during the period of observation.
In addition to varying over time throughout the VA, the use of VT2H by PCLIPs also varied substantially among VA stations. Between January 2020 and July 31, 2021, the highest percentage of PCLIPVs conducted by VT2H in any given week was reported by station 573 (Gainesville, FL). As shown in Figure 1, a little over 60% of PCLIPVs were coded as VT2H visits at this station during certain weeks between March 2020 and October 2020. After October, VT2H usage began to decline steadily. By July 2021, only about 16% of PCLIPVs at this station were coded as VT2H visits. Other VA stations also reported substantial, albeit temporary, increases in the percentage of PCLIPVs being conducted by VT2H. As shown in Table 1, 22 VA stations coded >30% of primary care LIP encounters as being conducted by VT2H during at least 1 week (range 2–40 weeks) between January 1, 2020 and late July 2021. Five of these stations coded >40% of such visits as being conducted by VT2H during at least 1 week during this time. In contrast, many of the other VA stations routinely reported fewer than 5% of PCLIPVs were conducted by VT2H during this time.
VA stations reporting >30% of PCLIPVs conducted by VT2H in any given week during the COVID-19 pandemic.
| Number of weeks with | ||
|---|---|---|
| VA facility | >30% of visits by VT2H | >40% of visits by VT2H |
| (630) New York, NY | 2 | |
| (644) Phoenix, AZ | 2 | |
| (671) San Antonio, TX | 2 | |
| (552) Dayton, OH | 3 | |
| (679) Tuscaloosa, AL | 3 | |
| (664) San Diego, CA | 5 | |
| (534) Charleston, SC | 13 | |
| (642) Philadelphia, PA | 13 | |
| (553) Detroit, MI | 14 | |
| (632) Northport, NY | 14 | 2 |
| (600) Long Beach, CA | 15 | |
| (620) Montrose, NY | 17 | |
| (693) Wilkes-Barre, PA | 18 | |
| (544) Columbia, SC | 19 | |
| (508) Atlanta, GA | 23 | |
| (590) Hampton, VA | 24 | |
| (593) Las Vegas, NV | 25 | |
| (548) West Palm Beach, FL | 26 | 1 |
| (539) Cincinnati, OH | 34 | 1 |
| (573) Gainesville, FL | 34 | 13 |
| (546) Miami, FL | 36 | 13 |
| (561) East Orange, NJ | 40 | |
Although only 17% of VA stations coded >30% of PCLIPVs as being conducted by VT2H during at least 1 week between January 2020 and late July 2021, all but 33 (ie, 75%) coded >10% of such encounters as being conducted by VT2H for at least 1 week during this period of observation. For the entire VA, the median number of weeks with >10% of PCLIPVs coded as being conducted by VT2H was 14 weeks but varied from 0 to 72 weeks (interquartile range [IQR] 0–50).
To identify potential differences between VA stations that were low-, moderate-, and high VT2H users, the VA stations were stratified into tertiles based on the number of weeks they reported >10% of PCLIPVs as being conducted by VT2H. The range of such counts for the first (low) tertile was 0–2 weeks (median 0, IQR 0–0 weeks), for the second tertile 3–43 weeks (median 14, IQR 5–31 weeks), and for the third tertile 45–72 weeks (median 59, IQR 50–65 weeks).
As shown in Table 2, VT2H use (structured into low, medium, and high tertiles) differed significantly by station-level rurality and designated complexity rating. As suggested by the data in Table 2, station-level complexity and rurality were moderately and inversely correlated (correlation coefficient = −0.49377). We did not observe a statistically significant relationship between tertiles of VT2H use and either of the 2 additional station-level characteristics that we examined, the number of PCLIPVs or the number of station outpatient clinics offering primary care services. We also found these additional measures to be highly correlated with number of PCLIPs. As a result, we do not present these results in Table 2 and these additional measures were also not included in the subsequent multivariable analyses.
Associations between VA station characteristics and VT2H usage as indicated by tertile ranking for the number of weeks the station reported >10% of PCLIPVs conducted by VT2H during the COVID-19 pandemic (January 1, 2020–July 31, 2021).
| Tertile | ||||
|---|---|---|---|---|
| VA station characteristics | Low (0–2 weeks) | Medium (3–43 weeks) | High (44–72 weeks) | P-valuea |
| Total number of PCLIPs, mean (SD) | 51.59 (36.44) | 49.07 (27.72) | 62.98 (29.42) | .097 |
| % of Veterans seen that live in rural areas, mean (SD)b | 48.11 (20.43) | 42.3 (24.50) | 22.74 (15.12) | .001 |
| VA station district, N (%) | .140 | |||
| Continental | 9 (39.13) | 11 (47.82) | 3 (2.36) | |
| Midwest | 10 (38.46) | 10 (38.46) | 6 (23.08) | |
| North Atlantic | 12 (33.33) | 11 (30.56) | 13 (36.11) | |
| Pacific | 7 (31.82) | 4 (18.18) | 11 (50.00) | |
| Southeast | 3 (15.00) | 8 (40.00) | 9 (45.00) | |
| VA station complexity, mean (SD)c | 2.97 (1.53) | 2.67 (1.63) | 3.93 (1.26) | <.001 |
Based on ANOVA or chi-square statistical tests.
Percentage of Veterans seen by PCLIPs during the observation period that lived in rural or highly rural areas.
Complexity ranked from 1 (low complexity) to 5 (highest complexity).
Based on the negative binomial regression analyses, VT2H use (defined as the number of weeks where >10% of PCLIPVs were conducted by VT2H) was determined to be significantly higher among VA stations serving a greater proportion of urban Veterans and among VA stations categorized as more complex (see Table 3). However, when adjusting for the number of station PCLIPs and rurality, the association between VA station complexity and VT2H was no longer found to be statistically significant. Figure 3 demonstrates the negative correlation between VT2H use and % of Veterans seen who live in rural areas, while providing additional context at the station-level. As indicated, only a small proportion of the variance in VT2H use is explained by rurality. For example, if we look at the 5 stations with >80% of Veterans that reside in rural areas, 2 achieved a moderate level of VT2H use (ie, ≥40 weeks with >10% of PCLIPVs conducted by VT2H). The converse was also true.
Association between VA station characteristics and the number of weeks during the COVID-19 pandemic (January 1, 2020–July 31, 2021) where more than 10% of PCLIPVs were conducted by VT2H.
| Unadjusted model | Adjusted modela | |||||
|---|---|---|---|---|---|---|
| VA station characteristics | RR | 95% CI | P-value | RR | 95% CI | P-value |
| Total number of PCLIPs | 1.01 | 0.99–1.02 | .286 | 1.00 | 0.99–1.01 | .893 |
| % of Veterans seen that live in rural areasb | 0.98 | 0.97–0.99 | .001 | 0.98 | 0.97–0.99 | .001 |
| VA station district | ||||||
| Continental | 0.40 | 0.16–1.02 | .056 | 0.45 | 0.18–1.10 | .081 |
| Midwest | 0.64 | 0.26–1.59 | .337 | 0.97 | 0.38–2.43 | .947 |
| North Atlantic | 0.94 | 0.42–2.18 | .877 | 1.04 | 0.45–2.37 | .929 |
| Pacific | Ref | — | — | Ref | — | — |
| Southeast | 1.15 | 0.44–3.01 | .781 | 1.21 | 0.48–3.03 | .686 |
| VA station complexityc | 1.20 | 1.00–1.44 | .050 | 1.06 | 0.80–1.40 | .695 |
Adjusted on # of PCLIPs and percentage of Veterans that lived in rural areas.
Percentage of Veterans seen by PCLIPs during the observation period that lived in rural or highly rural areas.
Complexity ranked from 1 (low complexity) to 5 (highest complexity).
Discussion
This analysis indicates that the percentage of PCLIPVs conducted by VT2H varied significantly over time and across VA stations during the first 18 months of the COVID pandemic. For the VA as a whole, VT2H usage increased by roughly 1100% during the first 5 months of the pandemic.17 This represented a remarkable accomplishment for the VA as a change of this magnitude would not have been possible had the VA not committed considerable resources to promote and facilitate this transition.4,5 However, the use of VT2H never represented a larger percentage of PCLIPVs in any week than did in-person or telephone visits (see Figure 2), and within 11 months of the start of the COVID pandemic, use of VT2H by PCLIPs began to steadily decline, dropping 47% by July 31, 2021.
Although there are likely multiple factors that contributed to the increased use of VT2H by VA PCLIPs during the first 5 months of the COVID pandemic, the VA’s decision to restrict in-person outpatient clinic visits early after the start of the pandemic and the ongoing concern many Veterans had about being exposed to COVID during this period may have been most influential. This supposition is supported by our findings. As shown in Figure 2, the percentage of weekly PCLIPVs that were conducted in-person declined rapidly after the start of the COVID pandemic hitting a nadir in April 2020. Simultaneously, the percentage of weekly PCLIPVs conducted by VT2H and telephone increased. The greatest increase was in telephone use, which represented over 85% of weekly PCLIPVs by April 2020.
Early in the pandemic, many patients and providers were finding it challenging to use VT2H or they felt VT2H did not provide a substantive advantage over telephone visits.4,5,7,8,18,19 Telephone visits were much easier to schedule, associated with fewer technical problems, and easier for many patients and staff to master.4,5,20 Although computer peripherals (eg, electronic stethoscopes and high-definition cameras) added an extra dimension to VT2H that was not available by telephone visits, these devices did not attain widespread usage. Some clinicians felt that VT2H visits were necessary only when a visual exam of the Veteran was needed (eg, to assess dermatologic issues or wounds) or it was important to assess the Veteran’s living environment.21 Veteran and provider acceptance of VT2H visits may also be influenced by the virtual platform being utilized as the VA allowed VT2H visits to be conducted using several different virtual platforms (eg, VVC, Doximity, WebEx, and Zoom) during the COVID pandemic. Given these and other considerations, it remains to be determined definitively when (or if) VT2H visits add significantly more value to the patient–provider interaction than telephone visits. More work in this area is needed.
Although the percentage of PCLIPVs conducted by VT2H continued to increase after April 2020, it would remain lower than the percentage of visits conducted in-person at most VA stations. By May 2020, the percentage of PCLIPVs conducted in-person began to increase rapidly accompanied by a proportion decrease in telephone visits. Despite the continued steady increase in VT2H visits, the difference in the percentage of PCLIPVs conducted in-person versus by VT2H began to widen. This trend was only briefly altered by the resurgence in COVID in mid-October 2020. By January 2021, new COVID cases, and COVID-associated hospital admissions and deaths were declining again, a trend that continued until July 2021.22 COVID vaccination rates among Americans were also increasing,23,24 and it appeared to many Americans that the COVID pandemic was being brought under control.25,26 At the same time, the VA continued to lift restrictions on in-person visits. These events were associated with an increase in PCLIPVs conducted in-person and a decline in VT2H and telephone visits.
At any point in time during the first 18 months of the COVID pandemic, there was substantial inter-VA station variance in the use of VT2H for PCLIPVs. Twenty-two VA stations (17% of all stations) coded between 30% and 60% of their PCLIPVs as being conducted by VT2H during certain weeks between January 2020 and late July 2021. In contrast, VT2H visits never exceeded 5% of PCLIPVs in any given week at many other stations. For the entire VA, the median number of weeks with >10% of PCLIPVs during the 18-month period of observation, was 14 weeks but varied from 0 to 72 weeks (IQR 0–50).
We found that VA stations serving a greater proportion of urban Veterans and those classified as providing a high complexity of care appeared to have higher VT2H use. As suggested by the data in Table 2, station-level complexity and rurality are moderately and inversely correlated (correlation coefficient = −0.49377). However, in the multivariable analysis, only Veteran rurality remained significant, thus we believe rurality to be the strongest predictor identified in our analysis.
Differences in access to high-quality broadband services (HQBS) between rural- and urban-residing Veterans may partially account for this finding. Some studies indicate differences in the availability of broadband services in different parts of the country are important factors for patients’ use of VT2H.7,27 People living in rural areas generally have less access to HQBS, although this varies by location and is constantly changing.5,28,29
Differences in PCLIPs coding of PCLIPVs may also account for some of the observed interstation variance on VT2H usage. Surveys have shown that many PCLIPs who attempted to conduct visits by VT2H had to abandon the effort and resort to a telephone visit due to technical problems.30 How often such visits were coded as VT2H is not certain and may have varied by facility. Although the VA adopted performance measures to promote the use of VT2H, they probably did not represent a major factor contributing to the growth of VT2H usage as the thresholds for meeting the measures was low. Resources were not available for this project to examine intra-facility variance in VT2H usage. Based on the limited amount of data available from the project on individual PCLIP use of VT2H, it appears that intra-facility variance in VT2H usage may be quite large. If such is the case, it may suggest that greater PCLIP incentives are needed to expand VT2H usage at all stations. Further work in this area is needed.
There are other potentially important VA station characteristics that may contribute to the high variance in VT2H. For example, we were not able to determine whether there were significant differences in committed resources for creating the infrastructure needed to support the expanded use of VT2H among VA stations.; this would include adequate numbers of appropriately trained schedulers, programs to train providers, patients, and caregivers in the use of VT2H, and VA facility broadband and OIT capabilities that were adequate to support an expanded VT2H program. There is currently little information on this subject in the literature. Future work will be needed to identify the unique practices employed by VA stations that were most successful in using VT2H for PCLIPVs and to determine whether such practices can be effectively disseminated to other VA stations, especially when in-person clinic visits are not being restricted.
This analysis did not focus on patient-level, provider-level, or community factors that influence VT2H usage, which are also critically important. Over the long term, the rate of increase in VT2H use will likely be predicated on patient and provider familiarity with and preference for advancing VT2H technologies (relative to in-person and telephone visits), and the quality and availability of resources needed to maintain VT2H services. Much more investment in this area is needed given the limited access to HQBS in many parts of the country, the limited capabilities of current VT2H software and hardware, and the need to more fully develop the many other components of the infrastructure required to completely support a virtual healthcare system that both patient and providers will fully embrace.5,31,32 At present, it remains unclear how large of a role VT2H will play in primary care outside of a pandemic. As there are many (known and unknown) barriers and facilitators to the successful use of VT2H, much more work is needed to determine which are most important and potentially modifiable.
This project had several limitations. Classification of PCLIPVs was based solely on provider coding. The criteria used to define a VT2H visit and how accurately these criteria were applied may have differed among VA Stations and PCLIPs. Being limited to data available in national VA databases, the project was able to examine only a few VA station characteristics and their association with VT2H usage; the project did not examine other VA station characteristics such as differences in the number of resources mobilized to expanding VT2H capabilities. We also included all PCLIPVs from all PACTs with a designated primary care provider. We did not attempt to determine whether there were any important differences in use of VT2H by type of primary care PACT. Some of the results may have differed slightly had we used more selective inclusion criteria. For example, Clinical Resource Hubs (CRHs) are designed to primarily use VT2H and video telehealth to other facilities (eg, CBOCs) rather than in-person visits. Our inclusion of CRHs in the analyses may have resulted in our slightly over-estimating how successfully stations adapted to the use of VT2H. More work is needed to investigate the significance of all these potential limitations.
In contrast, the project had many strengths. One is the breadth of the project. The results were based on analysis of all PCLIPVs across the entire VA healthcare system during the first phase of the COVID-19 pandemic between February 1, 2019 and July 31, 2021. To our knowledge, this project was the first to examine the inter-station variance in VT2H usage for PCLIPVs and how it changed over time during this period. The project also identified several key VA station characteristics that were associated with a higher rate of PCLIPVs being conducted by VT2H.
Conclusion
Overall, our analysis suggests that the VA was very successful in increasing the use of VT2H visits by PCLIPs as a means of addressing the healthcare needs of Veterans during the first phase of the COVID pandemic. However, the use of VT2H by PCLIPs varied substantially between VA stations and started to decline steadily across the VA by February 2021 when it appeared that the COVID pandemic was being brought under control. Although the percentage of Veterans seen by PCLIPs who resided in rural areas was found to be associated with VT2H use, other yet to be identified factors likely account for most of the variance in VT2H usage across VA stations. Future investigation is warranted to identify the unique practices employed by VA stations that were most successful in using VT2H for PCLIPVs and to determine whether such practices can be effectively disseminated to other VA stations, especially when in-person clinic visits are not restricted.
Author contributions
Conceptualization: D.H.S., Z.B. Data curation: D.H.S., Z.B. Formal analysis: D.H.S., H.E.K., Z.B. Funding acquisition: D.H.S., J.D., C.T.C. Methodology: D.H.S., H.E.K., Z.B., C.T.C., L.M.S. Visualization: D.H.S., H.E.K., Z.B., L.M.S., B.D. Project administration: D.H.S., J.D., C.T.C. Writing original draft: D.H.S., Z.B. Writing-review and editing: D.H.S., L.M.S., B.D., J.D., C.T.C., Z.B.
Funding
This work was supported by a grant from the United States Department of Veterans Affairs Office of Rural Health, the Salt Lake City Veterans Rural Health Resource Center (VRHRC) Data and Analytic Core (DAC), and by resources and use of VA stations at the Central Arkansas Veterans Healthcare System and the Salt Lake City Health Care System.
Conflict of interest
None declared.
Data availability
Due to US Department of Veterans Affairs (VA) regulations and our ethics agreements, the analytic datasets used for this study are not permitted to leave the VA firewall without a Data Use Agreement. This limitation is consistent with other studies based on VA data. However, VA data are made freely available to researchers with an approved VA study protocol. For more information, please visit https://www.virec.research.va.gov or contact the VA Information Resource Center at https://www.virec.research.va.gov or contact the VA Information Resource Center at https://www.virec.research.va.gov or contact the VA Information Resource Center at [email protected].
References
U.S. Department of Veterans Affairs, Office of Rural Health. VHA and ORH Adopt New System to Define “Rural”.
National Academies of Sciences, Engineering and Medicine; Division of Behavioral and Social Sciences and Education; Board on Human-Systems Integration; Division on Engineering and Physical Sciences; Board on Infrastructure and the Constructed Environment; Committee on Facilities Staffing Requirements for Veterans Health Administration. Facilities Staffing Requirements for the Veterans Health Administration-Resource Planning and Methodology for the Future. Washington (DC): National Academies Press (US);
