


Abstract
Critical care units (CCUs) with extensive use of various monitoring devices generate massive data. To utilize the valuable information of these devices; data are collected and stored using systems like clinical information system and laboratory information management system. These systems are proprietary, allow limited access to their database and, have the vendor-specific clinical implementation. In this study, we focus on developing an open-source web-based meta-data repository for CCU representing stay of the patient with relevant details.
After developing the web-based open-source repository named data dictionary (DD), we analyzed prospective data from 2 sites for 4 months for data quality dimensions (completeness, timeliness, validity, accuracy, and consistency), morbidity, and clinical outcomes. We used a regression model to highlight the significance of practice variations linked with various quality indicators.
DD with 1555 fields (89.6% categorical and 11.4% text fields) is presented to cover the clinical workflow of a CCU. The overall quality of 1795 patient days data with respect to standard quality dimensions is 87%. The data exhibit 88% completeness, 97% accuracy, 91% timeliness, and 94% validity in terms of representing CCU processes. The data scores only 67% in terms of consistency. Furthermore, quality indicators and practice variations are strongly correlated (P < 0.05).
This study documents DD for standardized data collection in CCU. DD provides robust data and insights for audit purposes and pathways for CCU to target practice improvements leading to specific quality improvements.
BACKGROUND AND SIGNIFICANCE
Critical care unit (CCU) is a specialized section of the hospital that provides continuous and comprehensive care for critically ill people. During the past few years, there is a progressive development in CCUs in terms of technology that has helped clinicians to improve the monitoring of patients for critical treatment using bedside medical devices. The clinical decision in these CCUs needs to be made frequently with high accuracy in minutes or even in seconds.1 In such a critical environment, the importance of data for support of decision is essential.2 Therefore, clinicians and hospitals have embraced the value of collecting and storing electronic clinical records. With digitization in CCUs, real-time data from different sources like patient monitors, ventilators, infusion pumps, radiology reports (Picture Archiving and Communication Systems), or laboratory reports are collected by clinical information systems (CISs) such as NEO,3 Philips IntelliSpace Critical Care and Anesthesia system4 or Draeger Innovian.5 Moreover, CIS data are progressively linked with electronic medical record (EMR) data such as Epic,6 AllScript,7 integrated neonatal intensive care unit (iNICU),8 or Centricity.9 The data generated per day in CCUs is an example of Big Data and comprise of physiological data such as respiratory signals, electroencephalograms, electrocardiograms, etc. and care data like body temperature, medicinal dosage or fluid intake.10 The EMR and CIS systems are responsible for aggregating CCU data consist of prescriptions, notes, charts, physiological vital data, laboratory measurements, diagnostic codes, morbidity, and mortality data.11 In most of these systems, the database is proprietary, and it is cost-prohibitive, which limits the access of its data to clinicians and researchers. Many CCU are using different vendor EMR and CIS solutions resulting in storage of clinical data as per vendor database. This proprietary data requires extra effort of critical care providers to share data with networks and compare their clinical outcomes. These systems have limitations that they do not provide access to real-time data. Moreover, they lack citations of clinical definitions used to analyze patient severity. Also, different CCUs manage similar health conditions as per their specific practice guidelines.
There is a need for the open-source repository that can explain the CCU data, and make it accessible to clinicians and researchers, referred to as data dictionary (DD). This DD should contain data representing the stay of a patient in a CCU, its contextual meaning, relationships to other data, clinical definitions, guidelines, origin, usage, validations, and format. One of the biggest examples of the DD in the healthcare system is Observational Health Data Sciences and Informatics (OHDSI). OHDSI is a platform developed by a large team of academicians, industry scientists, health care providers, and regulators. It provides an open-source data analytic solution to a vast network of health databases to improve human health and wellbeing.12 Similar data dictionaries have been used in other domains like National Trauma Data Standard, which provides the standard for submission of trauma registry data to the National Trauma Data Bank, helps in comparative analysis across all the facilities.13 Critical Care Minimum Data Set, a dictionary that provides standard data to support National Tariff Payment System, Healthcare Resource Groups, Resource Management, Commissioning, and national policy analysis.14
The proposed open DD helps to overcome the limitations of present critical care systems. It provides standard definitions with established clinical guidelines and emphasized on quality care with appropriate use of information to support clinical care process as represented in Figure 1. It will allow building accurate and consistent patient records that can be shared across health care organizations. Moreover, the readily available repository of clinical definitions and guidelines can be utilized for practitioners’ training and educational purposes. It is also intended that the DD structure can be easily extended as CCU adopts new modalities in clinical care without losing the integrity of existing definitions. Standard DD will enable the interpretation of available data for generating mathematical models for morbidity and mortality predictions, thereby improving patient care and clinical outcomes.
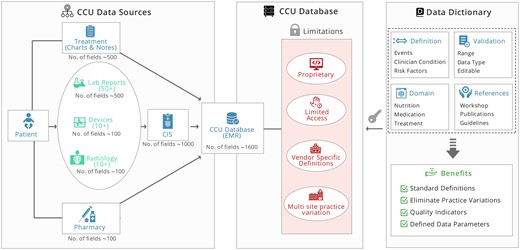
A schematic illustration of developing open data dictionary for CCUs. CCU: critical care unit.
OBJECTIVES
Here we focus on developing open-source DD based on standardized clinical definitions and storing patient stay data in CCU without causing the disparity in underlying EMR and clinical practices. We measure the effectiveness of the DD by analyzing pilot data at 2 neonatal intensive care unit (NICU) sites for quality dimensions, that is, completeness, timeliness, validity, accuracy, and consistency to document any variability in data collection.15,16 We then compared the practice variations among these 2 sites against common DD.
DATA AND METHODS
Setting and study population
Among all CCUs, NICUs have the highest mortality rate at an average global rate of 18 deaths per 1000 live births in 2017.17 The primary reasons are the lack of immunity in patients, underdeveloped organs, and their inability to communicate. To improve the quality of care and clinical outcomes in NICU's, several networks like Vermont Oxford Network (VON), The International Network for Evaluation of Outcomes (iNEO), Neonatal Research Network (NRN), and Korean Neonatal Network18–22 provides a common platform for knowledge exchange. These networks have standardized the operating procedures concerning clinical processes and device usage in participating in NICUs for treating various diseases.23
These networks require admission, outcome, and specific modality data from each participating NICUs. Each NICU follows specific customization of standard guidelines such as ESPGHAN for nutrition, and, NeoFax and LEXICOMP for evidence-based drug information.4,5,24–28 Nevertheless, these networks are unable to capture clinical practice variations such as time and dose of surfactant usage, feeding policies, which are followed in participating NICU due to lack of granularity of shared data. Moreover, there are variations in disease definitions among these NICU's and networks which makes it challenging to compare bedside practices.29
NICU workflow
The DD was developed under the aegis of iNICU platform.8,Figure 2 shows details of patient registration to admission (in NICU), followed by an initial assessment process by the emergency health care provider. Subsequently, doctors and nurses assess record/capture vital parameters, order investigations, and medications in real-time. Daily anthropometry, vital trends, procedures, and medications are captured to generate standard quality indicators.30–35
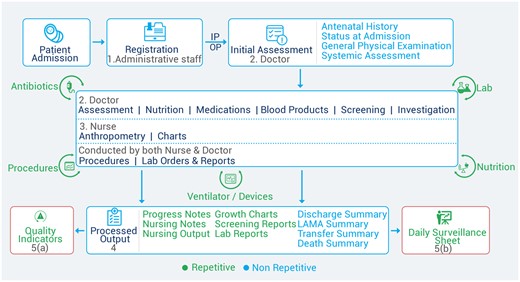
Neonatal intensive care unit workflow and key stakeholders.
DD development
In our study, we implemented the DD using excel-based worksheet (provided in Supplementary Material). Below section explains various steps involved in the development of DD to map NICU workflow.
Critical care stakeholders (role-based workflow management)
The DD was divided into user roles (ie, doctor, nurse, and administrative staff) and generated processed outputs (Supplementary Material I). Each user role has separate worksheet in the dictionary describing its fields and processes.
Buildup: defining process and entities in critical care
The DD contains meta-data consisting of workflow entities, their definition, attributes, and interrelationships to represent the CCU. In the initial phase, the clinical and engineering team worked to document the workflow processes of an NICU according to different user roles. The doctor worksheet of the dictionary contains fields and processes performed by the doctor, such as patient assessment, investigations, and medications (Supplementary Table S3). The nurse worksheet contains entities describing daily anthropometry, vital trend charts, procedures, and medication order execution by the nurses (Supplementary Table S4). Administrator worksheet (Supplementary Table S4) includes fields related to patient registration and administrative processes like room, drug, and device management. The administrator, doctor, and nurse worksheet were combined to generate processed outputs (Supplementary Tables S6 and S7) and standard quality indicators of NICU.30–35 The workflow processes of CCU were carefully abstracted into analyzable fields in the DD. Each field is marked as categorical, numerical, and textual. All categorical and numerical fields were defined with the valid value (or range), associated validation (or relationship with other fields), and applicable citation. The range, validation, and citation are separate columns for each user role in respective worksheets.
This step resulted in the definition of 140 entities (Table 1) presenting various classes of tables with associated table counts.
The data definition sheet consists of 140 entities, and the classes of data available
| Class of data | Description | Number of tables |
|---|---|---|
| Registration | Demographic details, baby details, parent details | 2 |
| Initial assessment | Includes the details of maternal history, records from birth to admission in NICU | 6 |
| Assessments | Different diagnosis and their onset, symptoms, risk factors, treatments given and causes | 14 |
| Nutrition | Enteral feeds and parenteral administered to the baby | 4 |
| Medications | Administration orders of different types of medications like antibiotics, sedatives, inotropes, etc. | 3 |
| Procedures | Procedures performed like central line, exchange transfusion, dialysis, etc. | 11 |
| Lab orders and reports | Microbiology, hematology, cultures orders and their reports | 3 |
| Physiological data | Hourly vital and ventilator parameters through NEO device and nurses | 7 |
| Progress notes and outcomes | Automated Notes of assessments, medication and nutrition orders, discharge summary | 2 |
| Reference | Master tables for the complete set of medications, primary and formula milk, NEOFAX and ESPGHAN recommendations | 88 |
Abbreviation: neonatal intensive care unit.
DD processes interrelationships
After defining the user roles and their corresponding processes, the next step in DD development is to establish interrelationships between processes. The critical care processes are hierarchically interlinked to each other (Figure 3). For example, when a patient gets admitted to an NICU, then the registration process informs the assessment process to initiate the initial assessment.
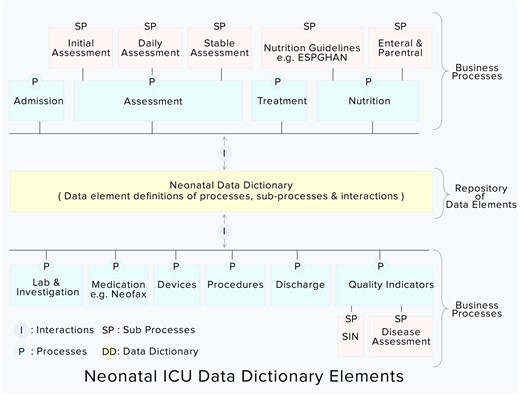
Integrated neonatal intensive care unit data dictionary elements (highlighted in yellow color).
Linking with disparate systems
In critical care, data comprises of vital parameters, medication, and lab investigations from disparate systems like biomedical devices, EMR, laboratory information management system, and pharmacy. Each of these systems can have a different reference of the same patient record that needs to be integrated with the CCU system and modeled in the DD. Based on the Fast Healthcare Interoperability Resources connectors definition,36 we implemented connectors that collect data from the third-party system. These connectors perform the mapping between different systems and normalizing the collected data (with respect to units and separate range) into dictionary-based fields. Each connector takes data (and associated definitions) of the third-party system as input and outputs the data into the DD-based fields. Also, to reduce the data entry effort, the DD-based platform leverages the bedside Internet of Things (IoT) surveillance device known as NEO.3 NEO devices run on single-board computers and capture real-time physiological device data from various medical devices in NICU using a Java-based kernel layer. It integrates data from these medical devices connected with the patient (monitor, ventilator, infusion pump, etc.) in an NICU and links this data with the iNICU platform.
Mapping of quality indicators and processed outputs in critical care
Snapshot of subcategories, for example, the flow of initial assessment is shown in Figure 4. All elements needed for managing these processes (and associated clinical practices) and their interactions are documented. A more detailed analysis of the DD is provided in Supplementary Material I. Supplementary Material II also describes the definition of quality indicators and rules for computing scores from dictionary elements.
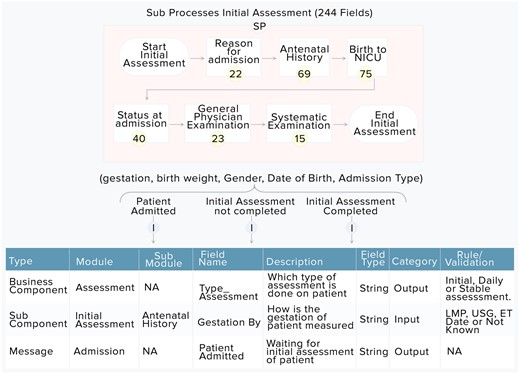
Doctor’s panel: Initial assessment and its sub components.
The processed outputs that are used in CCU include progress notes of assessments, discharge summary by clinicians, and vital parameter charts, nursing notes by nurses for each shift. They are automatically generated after data are stored based on the DD. Moreover, the quality indicators are automatically calculated using processed outputs and other elements of the DD.
Mapping definitions against established guidelines
Every element of the DD implements applicable clinical practices ensuring that all adhering CCU sites are following common and consistent definitions during prospective data entry. The DD integrates standard validated neonatal scores like APGAR, BALLARD, Downe’s, Bells staging, and BIND Score and, HIE scores by Sarnat and Sarnat.37–42 These scores have been incorporated in the web interface to facilitate the health care provider to capture the severity and stages of common neonatal morbidities. The DD also integrates several essential neonatal calculators such as dosing for medication, enteral, total parenteral nutrition intake orders, nutritional intake deficiency, dextrose, calories, osmolarity calculator, and jaundice monitoring charts like National Institute for Health and Care Excellence (NICE) and American Academy of Pediatrics (AAP). The DD also contains fields for warning messages such as for out-of-range values of a dose, frequency, route, diluent type, dilution volume, reconstitution volume for medications, as per NeoFax.26,27 It also includes notifications about the daily energy requirements of the neonate as per the adequacy of ESPGHAN guidelines.24,25 Along with managing the NICU workflow data, the DD also handles longitudinal device data collection. Every event in a patient’s stay, for example, apnea and desaturation, can be linked to the causal relationship with previous events along with data collected on a real-time basis.
De-identification and data security
DD-based web platform developed in this study operates in a highly regulated critical care environment. The patient database adheres to HIPAA (Health Insurance Portability and Accountability Act) with role-based access control and unified error reporting. The device data transmitted from bedside IoT devices is protected by HTTPS (256 bit) secure encryption. For remote open Virtual Private Network access of devices, private keys are generated by PKI (public key infrastructure) and installed on devices before Secure Shell. All data stored on the server database (Cassandra and Postgres) is protected by roles/rights assigned to users (nurses, doctors, and administrators). The demographic data of the patient are de-identified and encrypted. These data are not accessible in human-readable formats for privacy reasons. The hospital database servers are equipped with disaster recovery mechanisms and are protected by firewalls.
DD to database implementation
In the final phase, the excel worksheet was reviewed by a group of neonatologists participating in the study to validate the citations of clinical definitions (such as neonatal scores, medication, and nutritional guidelines). Once the fields, definitions were approved, the excel worksheet was converted into SQL-based data definition language (DDL) structure outlining tables, fields, roles, and rights of stakeholders. The SQL-based DDL was further implemented in Postgres (SQL)- and Cassandra (NoSQL)-based database management system. The dictionary-based database containing clinical processes, their interactions, and associated fields is managed through iNICU-based data collection platform.
Clinical validation
To check the variability in the quality of data collection against the standard dictionary, we performed a case study at 2 NICU sites (1 rural and 1 urban setting). This study was conducted over 4 months from December 2018 to March 2019. Neonates with more than 24 hours of stay with a completed registration, initial, and clinical assessment and nutrition data were enrolled. The study assessed 5 dimensions of quality of data, that is, completeness, timeliness, validity, accuracy, and consistency for the utility of the DD.16 Completeness refers to the coverage of DD fields and their utilization against captured NICU data. Timeliness is calculated as the time gap (in hours) between data entry time and actual assessment time by doctor or nurse. Every field of DD has some validation rules defining permitted values. Numerical fields have a valid range of numbers, whereas categorical data have possible values. The validity of data was legitimized in the database against a defined range of values stored in the DD. Domain experts evaluate the accuracy of the electronic health record data based on how data describes a real patient scenario. We assessed the accuracy of the data by a random audit of 10% of collected data on a weekly basis in consultation with the clinical team and head of the department. Consistency was calculated by ensuring consistent definitions of practices against standard guidelines and comparing variables within and across data sources.43 For example, the transcutaneous bilirubin value for starting and stopping phototherapy was examined with respect to AAP Charts. Downe’s or Silverman score is being used to assess the severity of respiratory distress syndrome (RDS) at both sites. Nutrition intakes were compared against ESPGHAN recommendations, and deficits were calculated. Medication entries were analyzed against standard NeoFax guidelines followed at both sites.
Data captured at 2 CCU sites were stored in Postgres and Cassandra database. The unstructured and rapidly moving device data were stored in Cassandra, whereas well-structured, regularly viewed data on the clinical interface were stored in Postgres. The data were curated using R, Java, and MS Excel.44 The transformers bringing data from biomedical devices were implemented in device vendor-based proprietary formats ranging from American Standard Code for Information Interchange, Serial data input/output, and HL7. The transformers bringing data from the third-party system (Labs, EMR, and pharmacy) were implemented in HL7 using Admit, Discharge, Transfer, Observation Result messages.
Statistical analysis
The group of neonatologists identified practice variations (independent variables) among sites that may have a significant relationship with quality indicators (dependent variables).45 The quality indicator and network’s template of data were further mapped to the requirements of the neonatal network (Supplementary Material III). The relationship between practice variations and quality indicators were designed as a multivariable linear regression model. Each practice variation was checked for its significant relationship with quality indicators, which include time to reach full feeds, antibiotic days, duration of phototherapy, the incidence of RDS, and growth velocity in Very Low Birth Weight infants during NICU stay.
The resulting weights, -static and -values for each practice variation element affecting a quality indicator were calculated. The statistical computations were performed in the R statistical software environment.
The F-test was used to assess whether the predictor variables predict the dependent variable. R-squared was reported and used to determine how much variance in the dependent variable can be accounted for by the predictor variable. The t-test was used to determine the significance of the predictor and beta coefficients was used to determine the magnitude and direction of the relationship. For statistically significant predictor variables, for every 1-unit increase in the predictor, the dependent variable will increase or decrease by the number of unstandardized beta coefficients. The statistical computations were performed in the R statistical software environment.
RESULTS
A total of 1555 fields (353 numerical, 1043 categorical, and 159 text fields) were included in the DD to describe CCU processes. Neonates with more than 24 hours of stay in an NICU with completed registration, clinical assessment at admission and during hospital stay were included in the study. Study sites include 1 corporate-level III NICU urban site (site-1) and 1 private level III NICU rural site (site-2). The distribution of clinical staff and the number of beds are mentioned in Supplementary Table S2. Doctor-related initial assessment and orders associated with clinical assessments; nutrition and treatment constitute 70% of dictionary fields. Nurse-related execution of orders and charts make up 20% of fields. The remaining fields (10%) are related to system administration and branding.
A total of 359 patients were admitted during the study period, and the data were analyzed for 344 patients qualifying the enrollment criteria. The baseline data of patients are shown in Table 2.
Baseline characteristics of the study cohort
| Variable | Site-1 (n = 172) | Site-2 (n = 187) | P-values |
|---|---|---|---|
| Birth weight (g) | |||
| <1499 | 25 (14.5) | 7 (3.8) | 0.000 |
| 1500–1999 | 48 (27.9) | 29 (15.5) | 0.000 |
| 2000–2499 | 39 (22.7) | 55 (29.4) | 0.000 |
| 2500 | 60 (34.9) | 96 (51.3) | 0.000 |
| Gestation (wks) | |||
| <31 | 9 (5.4) | 5 (2.7) | 0.000 |
| 31–34 | 63 (36.6) | 29 (15.5) | 0.000 |
| 34–37 | 60 (34.8) | 43 (23.0) | 0.000 |
| >37 | 40 (23.2) | 110 (58.8) | 0.000 |
| Gender | |||
| Male | 90 (52.3) | 114 (61.0) | 0.000 |
| Female | 82 (47.7) | 73 (39.0) | 0.400 |
| In-out patient status | |||
| Inborn | 136 (79.1) | 78 (41.7) | 0.011 |
| Outborn | 36 (20.9) | 109 (58.3) | 0.000 |
| Pregnancy type | |||
| Single | 90 (52.3) | 174 (93.0) | 0.000 |
| Twins | 82 (47.7) | 13 (7.0) | 0.000 |
| Respiratory distress syndrome | 72 (42.9) | 90 (48.1) | 0.000 |
| Jaundice needing phototherapy | 88 (36.0) | 40 (21.3) | 0.000 |
| Probable sepsisa | 21 (12.2) | 20 (10.7) | 0.177 |
| LONS | 4 (2.3) | 16 (8.5) | 0.000 |
| Asphyxia | 0 (0) | 9 (4.8) | 0.000 |
| Pneumothorax | 2 (1.1) | 4 (2.1) | 0.000 |
| Antenatal steroids (less than 34 wks gestation) | 35 (48.6) | 13 (38) | 0.041 |
| Survival | |||
| Overall | 168 (97.7) | 186 (99.7) | 0.000 |
| <1500 g | 22 (88) | 7 (100) | 0.761 |
| Average length of stay (d) | 8.3 (10.7) | 4.6 (5.5) | 0.000 |
Note: Data expressed as n (%) unless specified, values are given as mean (SD).
aBlood culture negative with more than 5 days of antibiotic usage.
Abbreviations: LONS: late onset sepsis; SD: standard deviation.
The overall quality of captured data in the NICU is 87% with respect to all dimensions (Table 3).
Data quality dimensions (%) across 2 pilot sites (site-1 and site-2)
| Dimension | Site-1 (n = 172) | Site-2 (n = 187) |
|---|---|---|
| Completeness (88%) | ||
| Initial assessment | 171 (87) | 173 (75) |
| Doctor orders | 171 (85) | 173 (70) |
| Nursing execution | 171 (91) | 173 (85) |
| Timeliness (h)a | ||
| Initial assessment | 2.05 (1.1) | 4.76 (1.1) |
| Medication | 7.46 (2.8) | 5.6 (3.9) |
| Nutrition | 1.67 (1.0) | 1.4 (0.6) |
| Consistency (67%) | ||
| Phototherapy (as per NICE/AAP) | 88 (65) | 40 (90) |
| Assessment for severity of RDS | 72 (84) | 90 (0) |
| Nutritional deficit (as per ESPGHAN) | 171 (53) | 173 (55) |
| Medications (as per NeoFax) | 49 (90) | 71 (94) |
Note: Data expressed as number of records (% of quality dimension) unless specified.
Abbreviations: AAP: American Academy of Pediatrics; NICE: National Institute for Health and Care Excellence; RDS: respiratory distress syndrome; SD: standard deviation.
aMean (SD).
The timeliness rate for completion of initial assessment post-patient registration is less than 5 hours. Nurses, on average, execute medication entries after 6 hours at both sites. At both locations, nurses document the nutrition administration data within 2 hours of providing feed to the patient. The consistency to use the AAP/NICE chart to start and stop phototherapy on patients is followed for more than 65% cases in both locations. The Downe’s and Silverman score of the RDS patients at site 2 are not documented.
Table 4 presents the quality indicators and describes various practice variation factors and their weights (or effects) on the statistically significant outcomes.
Relationship between QIs and corresponding practice variation parameters in neonates
| QI Practice variation parameter | ≤34 weeks (N = 95) | Weights | t-static | P-values |
|---|---|---|---|---|
| Age at full feeds in days (150 mL/kg/d) | 5.9 (3.4) | |||
| Birth weight (g) | 1751.2 (425.2) | −0.000 | −1.031 | 0.306 |
| Gestation (wk) | 31.6 (1.8) | −0.480 | −2.201 | 0.031 |
| Age at first feed (h) | 35.5 (25.8) | 0.073 | 5.981 | 0.000 |
| Feed increment (mL/kg/d) | 31.9 (13.7) | −0.053 | −2.405 | 0.019 |
| Growth velocity (g/kg/d) | 18.75 (16.5) | |||
| Gestation (wks) | 30.8 (3.4) | 1.916 | 1.930 | 0.065 |
| Total fluid intake (mL/kg/d) | 149 (31.4) | 0.148 | 1.692 | 0.103 |
| Calorie intake (kcal/kg/d) | 98.6 (50.4) | 0.136 | 2.181 | 0.039 |
| Protein intake (g/kg/d) | 1.5 (0.8) | 11.63 | 4.006 | 0.000 |
| AUR | 18.34% | |||
| Birth weight (g) | 1751.2 (425.2) | −0.003 | −3.067 | 0.003 |
| Parenteral nutrition αa | 25 (78.1) | 4.301 | 3.161 | 0.002 |
| Prophylactic αa | 26 (72.2) | 2.543 | 2.746 | 0.007 |
| Sepsis αa | 10 (27.8) | 2.543 | 2.746 | 0.007 |
| Duration of phototherapy (h) | 12.8 (8.6) | |||
| TcB below guideline βa | 6 (19.3) | 7.605 | 2.997 | 0.003 |
| Loss of weight (%) | 4.2 (6.5) | 0.252 | 1.822 | 0.072 |
| LOS γ | 12.6 (12.4) | |||
| Gestation (wks) | 31.6 (1.8) | −4.774 | −8.998 | 0.000 |
| Birth weight level δ | 6:80:9 | 8.551 | 2.444 | 0.016 |
| Age at first feed (h) | 35.5 (25.8) | 0.122 | 0.034 | 0.000 |
Note: Data expressed as mean (SD) unless specified, α—number of babies, β—TcB below phototherapy threshold as per NICE/AAP, δ—ratio (SGA:AGA:LGA).
Abbreviations: AAP: American Academy of Pediatrics; AGA: Appropriate for Gestation Age; AUR: antibiotic use rate; LGA: Long for Gestation Age; LOS: length of stay; NICE: National Institute for Health and Care Excellence; QI: quality indicator; SGA: Short for Gestation Age; SD: standard deviation; TcB: transcutaneous bilirubin.
an (%)
Day of life at full feeds is significantly dependent on age at first feed (P = 0.00 < 0.05), whereas prophylactic usage of antibiotics is significantly correlated with antibiotic days (P = 0.007 < 0.05). However, most prophylactic usage is limited to patients on parenteral nutrition, and therefore by including parenteral nutrition in the model adjusted R-square of the model is improved. With respect to growth velocity, 32 babies were weighting ≤1500 g, which were used in the analysis.
DISCUSSION
Critically ill patients in a hospital environment are admitted to specific CCUs as per requirement such as pediatric intensive care unit, NICU, cardiac intensive care units, neurological intensive care unit, post-anesthesia care unit, or surgical intensive care unit. These CCUs generates a large amount of data, which can be collected and utilized for research purposes. One such study by Johnson et al,11 have reported MIMIC III (Medical Information Mart for Intensive Care), a single-center, freely accessible, large relational database, which started as an effort to represent Philips CareVue system (2001–2008) and is now replaced with MetaVision data management system to represent the data. It provides de-identified comprehensive data of patients admitted in CCUs of Beth Israel Deaconess Medical Center. The database includes information such as demographics, vital sign measurements made at the bedside with 1 data point per hour, laboratory test results, procedures, medications, caregiver notes, imaging reports, morbidity (International Classification of Diseases 9), and mortality (both in and out of hospital).
There are ongoing efforts to merge MIMIC III data with standardized dictionaries such as LOINC (Logical Observation Identifiers Names and Codes)46 and RxNorm (US-specific medication terminology).47 The dictionary tables of MIMIC are abbreviated with “D_” and they provide a center-specific definition and allow researchers to link the data with a standardized dictionary. The data represented by MIMIC III denotes clinical practices of 1 center only and how it manages patient medication, fluid management, and treatments across morbidities. MIMIC III database does not provide information (citations) on guidelines followed in various CCU's and how compliance with guidelines has any effect on clinical outcomes. MIMIC III extends the linking of its mortality data with Social Security Death Index to map the clinical outcomes with clinical practices.
In the current study, as a part of describing the workflow of CCU, we have presented a comprehensive DD (of 1555 fields) that includes all variables collected in major neonatal networks (VON, iNEO, NRN, and Canadian Neonatal Network). This DD can share real-world (time series) data of patient stay in CCU and various events in treatment management. The DD was designed, keeping in mind different stakeholders (doctors, nurses, administrative, and IT staff). The doctor is responsible for assessing the patient along with nutrition, procedures, and medication orders. The doctor fields contribute to 70% of dictionary fields.
The dictionary-based disease definition can manage CCU-specific morbidities such as RDS, Necrotizing Enterocolitis, and sepsis in a standardized manner. These standard treatment protocols then allow linking of captured data in various morbidities (against common definitions) and their outcomes in a time-series manner. These outcomes can easily be compared across centers with respect to their adoption (or nonadoption) of standard practice treatment guidelines such as ESPGHAN and Lexicomp. Moreover, the data captured in compliance with the DD can automatically generate morbidity data, clinical outcomes, and quality indicators. The DD structure facilitates the expansion of fields for new disease assessments and clinical examinations. These data can be shared among the neonatal networks without any extra step of data preparation for the NICU unit.
The current study shows the significance of separating DD storage from actual technology. The DD acts as a template for capturing medical data in NICU. It can be used as a quick reference for implementing technology, which can be in relational databases, graph databases, or content-based storage. In current study (1) NoSQL (Cassandra) is used for high volume, variability device data; and (2) Postgres (for faster I/O responses) is used for data objects that are used by clinical interface; and (3) protégé48 is used for semantic knowledge representation (guidelines). Data analytics layer then leverage benefits of data representation in each layer (easier to represent guidelines knowledge as a graph database, whereas changing parameters knowledge as a collection in NoSQL and fixed dataset as tables in Postgres) to consolidate the results.
As a case study, we collected prospective data from 2 NICUs over 4 months (longitudinal) during the stay of the patient. These data were captured with respect to dictionary fields leading to a real-time view of patients in CCU. Analysis of quality dimensions substantiates the robustness and granularity of captured data. Data quality (especially completeness) of CCU data is dependent on the count and availability of trained staff. The major highlight of DD completeness is achieved by the integration of bedside surveillance devices with monitor, ventilator, blood gas, and other medical devices. The web-based system also auto fetches data from the lab information management system, ensuring all digital laboratory data is auto-populated. However, devices do not capture the manual data of the charts prepared by nurses having a record of urine output, bowel action, and vomiting. Timeliness of data entry and consistency of staff in assessing and managing similar clinical situations is critical for the quality of data. It was found that both sites do not follow consistent guidelines for timely data entry of nutrition, medication, and systemic assessment of patients and can be an area of improvement in the future. Our data scores are high on completeness, accuracy, and validity. The 9.6% free text fields in the DD were the main source of nonvalidated data.
During the analysis of practice variations with quality indicators, gestation and age at first feed were found to be the most significant variable (with respect to weight at significant P-value) to predict age at full enteral feed (150 mL/kg/day). These results agree with the earlier reported significance of the age of first feed, but more data are required to generalize this inference.49 Protein intake seems to be significantly associated with improved growth velocity, as earlier reported.50 The use of prophylactic antibiotics appears to contribute significantly towards antibiotics usage rate in our study. We observed that the noncompliance of guidelines for initiating phototherapy procedure significantly affect its duration. Multiple studies have reported that birth weight and gestation at the birth of neonate are inversely correlated with the length of stay.51 Linking of practice variation with quality indicators via linear regression models shows the significance of these variations and highlights the need for involving them while comparing data among networks.
Our study data do not fare well on account of consistency in data entry. It is possibly due to higher attrition rates of nursing staff in these settings. Moreover, current data on the dictionary is limited by its data size (4-month study period with 359 patients). Therefore, only practice variations displayed by these 2 units are highlighted. The DD is dynamic and bound to evolve as more NICU adopt the same and utilize it to share data with their respective networks. With ever-increasing medical knowledge base and dynamic nature of disease diagnosis, there will always be new medical terminology, which will get indexed over time in the dictionary. Therefore, DD evolution will depend on the maturity of CCU practices and their digitization.
In the current implementation, data from certain systems are not linked. First, transformers do not link analog biomedical devices such as infusion pumps, weighing machines that are used in the NICU. Their data has to be manually entered by nurses. Second, transformers fetching data from laboratory systems, EMRs, and pharmacy are event-based scheduled processes. Currently, these transformers work on fixed schedules (every 15 min or 30 min as per the configuration of the hospital unit). In some instances, even though the information is available in a third-party system, it is brought into the information system with scheduled delay (such as after 15 min), which is of massive concern to clinical staff. It is proposed that in the future, the data flow will be data trigger-based and not schedule based. Moreover, in the current phase, the data integration with the disparate system is unidirectional. It is assumed that in the future, the DD-based systems will acquire intelligence from collected data (deep learning) and will be able to provide inputs to interacting systems.
In the future, we plan to link the semantic clinical knowledge represented by each field of the DD. It will enable the development of self-learning platforms that can help in choosing the most optimal course of clinical intervention suitable for a given patient. Linking of semantic knowledge of the field with existing clinical rules (ie, apnea, desaturation, and tachycardia) that determine when a patient has a particular disease state can act as navigational milestones when finding data patterns. We have already demonstrated in previous work that physiological data can be used to predict morbidity and mortality in neonates.
We envision that a granular DD based on the clinical workflow process can help generate new insights (supported by data) of quality indicators, which is an indicator of practices followed across NICUs. They will describe how a neonate traverses through healthy, disease onset, and diseased state during the stay in the CCU. It may help in finding new trends that may act as clinical markers for diseases by early intervention.
CONCLUSION
The DD has provided a common platform and improved quality indicators across the NICU. This study will contribute to the ongoing development of database collection and exploration for research purposes, including mathematical modeling for prediction of morbidity and mortality. This DD can help in preventing the practice variations across different CCUs by following a standard dictionary having defined clinical terminologies and data ranges. It is one of the first efforts linking standardize clinical workflow-based data entry in NICU and demonstrating a relationship between practice variations and clinical outcomes (indicators).
FUNDING
This research project is funded privately by support from Child Health Imprints (CHIL) Pte. Ltd., Singapore. HS and RK are co-founders and board members of Child Health Imprints India Private Limited. AKP received a grant from Child Health Imprints India Private Limited for research. The remaining authors have no financial relationships relevant to this article to disclose.
AUTHOR CONTRIBUTIONS
HS, RK, and AKP conceptualized and designed the study, drafted the initial manuscript, and reviewed and revised the manuscript. HS, RK and SG designed the data collection instruments, collected data, carried out the initial analysis, and reviewed and revised the manuscript. HS, RK, and RD have revised the manuscript. HS, AKP, AK, and SJC conceptualized the mathematical model. SS conceptualized and designed the study, coordinated and supervised data analysis. AKP, SJC, JP, PK, GY, and YS critically reviewed the manuscript for important intellectual content. All authors approved the final manuscript as submitted and agree to be accountable for all aspects of the work.
ACKNOWLEDGMENTS
The authors want to thank DST, IBM, KStartup, Oracle, T-Hub, and IIM-A for recognizing the iNICU as an innovative sustainable solution in child healthcare. They also want to acknowledge Harmeet Singh for help in drafting figures, Manoj Gulati in setting up draft for manuscript, Jayant Kalra for reviewing manuscript, and Gurpreet and Shagun Saini in updating the dictionary. They would also like to acknowledge all the iNICU team members and other people that have made this study possible.
CONFLICT OF INTEREST STATEMENT
None declared.
WHAT’S KNOWN ON THIS SUBJECT
CCUs have benefitted using data collaboration with respect to the admission, outcomes and morbidities. But the data collaboration does not reveal relationship between practices and shared data. Therefore, there is a need of open data repository that can result in improvement of quality indicators. These data collection are based on standard templates with respect to specific outcomes. This comparison among CCUs does not reveal relationship between their practices and outcomes.
WHAT THIS STUDY ADDS
This is the first attempt in the literature documenting data dictionary (DD) for the standardized data collection in CCU. DD links clinical practices and quality indicators and provisions for device data. This generates insights for audit leading to quality improvements.
REFERENCES
Jlynch. National Trauma Data Standard Data Dictionary. 2018;1–271. https://www.facs.org/~/media/files/quality%20programs/trauma/ntdb/ntds/data%20dictionaries/ntdb_data_dictionary_2019_revision.ashx. Accessed July 5, 2019.
Critical Care Minimum Data Set Overview. httpswww.datadictionary.nhs.ukdatadictionarymessagessupportingdatasetsdatasetscriticalcareminimumdatasetfr.aspshownav. Accessed July 7, 2019.
Askham N, Cook D, Doyle M, et al. The six primary dimensions for data quality assessment. httpswww.whitepapers.emtech.comwp-contentfilesmfDAMAUKDQDimensionsWhitePaperR.pdf. 2013;432–5.https://www.whitepapers.em360tech.com/wp-content/files_mf/1407250286DAMAUKDQDimensionsWhitePaperR37.pdf. Accessed July 5, 2019.
Global Health Observatory (GHO) data. httpswww.who.intghochildhealthmortalityneonatalinfanttexten. Accessed July 7, 2019.
The Vermont Oxford Network. httpswww.vtoxford.org. Accessed July 7, 2019.
The CNN Abstractor’s Manual. httpwww.canadianneonatalnetwork.org. Accessed July 7, 2019.
Neonatal Research Network Japan. httpnrn.shiga-med.ac.j.p. Accessed July 7, 2019.
Micromedex NeoFax Essentials.
FHIR: Fast Healthcare Interoperability Resources. HL7 Fast Healthcare Interoperability Resources Specification (FHIR®), DSTU Release 1. https://www.hl7.org/implement/standards/product_brief.cfm?product_id=343 Accessed September 10, 2019.
