


Abstract
Geocoding and characterizing geographic, community, and environmental characteristics of study participants is frequently done in epidemiological studies. However, participant addresses are identifiable protected health information (PHI) and geocoding must be conducted in a Health Insurance Portability and Accountability Act–compliant manner. Our objective was to create a software application for this process that addresses limitations in current approaches.
We used a containerization platform to create DeGAUSS (Decentralized Geomarker Assessment for Multi-Site Studies), a software application that facilitates reproducible geocoding and geomarker assessment while maintaining the confidentiality of PHI. To validate the software, 215 350 addresses in Hamilton County, Ohio, were geocoded using DeGAUSS, ArcGIS, Google, and SAS and compared to a gold-standard approach. We distributed the DeGAUSS software to sites in an ongoing multisite study (Electronic Medical Records and Genomics, or eMERGE), and individual sites independently geocoded and assigned median census tract–level income and distance to nearest major roadway to their participants’ addresses, removed associated PHI, and returned deidentified data.
Within a multisite study, 52 244 study participants’ addresses across 5 sites were geocoded with a median distance to roadway of 10 022m and a median census tract income of $57 266, demonstrating the feasibility of DeGAUSS within a multisite study. Compared to other commonly used geocoding platforms, DeGAUSS had similar geocoding and geomarker assessment accuracies.
The open source DeGAUSS software overcomes multiple challenges in the use of address data in multisite studies and also serves as a more general reproducible research tool for geocoding and geomarker assessment.
BACKGROUND AND SIGNIFICANCE
In combination with advances in geoinformatics, geocoding (translating a postal address into a coordinate on the earth’s surface) has greatly facilitated the ability to explore the relationship between health and place. Using geocoded addresses, researchers or physicians can derive environmental and community characteristics that may be related to disease and personalized interventions. Broadly defined as geomarkers, these environmental and community characteristics include contextual or geographic measures that influence or predict the incidence of outcome or disease.1
However, multiple challenges exist when integrating geocoding and geomarkers into research studies and clinical applications. The Health Information Portability and Accountability Act (HIPAA) privacy rule,2 the Health Information Technology for Economic and Clinical Health Act of 2009,3 and the Federal Policy for the Protection of Human Subjects4 have established regulations to safeguard the confidentiality of patients and research subjects, and these regulations define what constitutes identifiable information. Both street address and equivalent geocodes are included on this list of protected health information (PHI). This presents an obstacle in medical research and patient care under circumstances where geocoding is necessary, given that many current geocoding methods require transmitting address information over the World Wide Web to a third party (eg, Google).
Multisite research studies present unique and additional challenges to geocoding and geomarker assessment. One approach to geocoding and integrating geographic data for multisite studies is to use a designated central site or data coordinating center to conduct all geocoding and geomarker assessments. This approach, however, necessitates a succession of approvals by the governing institutional review board (IRB) or ethics committee at each site before identifying information can be distributed to the central site. This may be a lengthy process and may not possible in some cases, depending on the original consent language and approval for each study site. Alternatively, geocoding and geomarker assessment may be performed independently by each site, but this approach requires expertise with geospatial software and methods may differ by study site. Differences in geocoding methods may affect positional accuracy,5,6 resulting in biased associations between geomarkers and health outcomes.7
Thus, there is an urgent need for reproducible, local geocoding and geomarker assessment tools that are HIPAA compliant and abide by differing IRB policies across study sites. This is especially important for multisite studies, because their scale prevents them from being replicated.8 Currently, no commonly used geocoding software is open source, which prevents place-based research from being fully transparent and reproducible. Furthermore, all major geocoders either require expensive software licenses (eg, ArcGIS, SAS) or charge a fee per geocode and limit the number of geocodes available within a given time period (eg, Google).
To address these limitations, we propose a novel decentralized approach capable of geocoding and deriving community- and individual-level environmental characteristics. DeGAUSS (Decentralized Geomarker Assessment for Multi-site Studies) is a standalone and highly versatile software package that allows geocoding and geomarker assessment to be performed in a reproducible and standardized manner across study sites, while preserving the privacy of research participants’ or patients’ address information. Our approach is free, open source, does not require extensive computational resources, and is executable on a local machine without exposing PHI to a third party. This makes it compliant with HIPAA and most institutional restrictions on PHI. These defining features of DeGAUSS are summarized and compared to other common geocoding software inTable 1.
Characteristics of DeGAUSS and other commonly used geocoding platforms
| Characteristic | ArcGIS | SAS | DeGAUSS | |
|---|---|---|---|---|
| Local machine operation | x | x | ||
| Open source | x | |||
| Reproducible results | x | x | ||
| Cost-free | x | |||
| No-limit geocoding | x | x | x | |
| Address range | x | x | ||
| Parcel or address point | x | x |
| Characteristic | ArcGIS | SAS | DeGAUSS | |
|---|---|---|---|---|
| Local machine operation | x | x | ||
| Open source | x | |||
| Reproducible results | x | x | ||
| Cost-free | x | |||
| No-limit geocoding | x | x | x | |
| Address range | x | x | ||
| Parcel or address point | x | x |
The remainder of the manuscript is structured as follows. First, we show that the DeGAUSS geocoder has comparable geocoding accuracy to other commonly used geocoding software, and furthermore, that the resulting geomarkers derived from DeGAUSS geocodes are similar to geomarkers based on geocodes from other software. Second, we establish the feasibility of the decentralized, reproducible, and HIPAA-compliant geocoding and geomarker assessment approach using DeGAUSS within an ongoing multisite study.
MATERIALS AND METHODS
Geocoding software
A custom geocoder9 was developed using TIGER/Line address range files to convert addresses into geographical coordinates. The program is a direct derivative of Geocoder::US 2.0, written by Schuyler Erle (seehttps://github.com/geocommons/geocoder), and is licensed under a GNU Lesser General Public License. Address range geocoding is detailed in depth and compared to address point and parcel geocoding elsewhere.6 Briefly, street names and zip codes are matched to street ranges provided by the US Census Bureau in TIGER/Line files, and house numbers are used to interpolate locations based on the ranges of house numbers corresponding to the matched street range shapefiles.
Containerization is an operating system–level virtualization method used for deploying and running software without using an entire virtual machine. Instead, containers run on a single host and retain the advantages of virtualization, namely, wrapping all of the components needed to run the desired software in a standalone package. Here we used Docker, a containerization platform, to create an image that batch-geocodes addresses (degauss/geocoder).
Geomarker assessment software
DeGAUSS geomarker assessment images containerize R10 code that utilizes geospatial packages such as sp,11 rgeos,12 rgdal,13 and tigris14 to calculate geomarkers based on an input file containing geospatial coordinates resulting from a geocoded address. End users may customize their own installation by creating and containerizing their own R scripts by using the DeGAUSS images as a starting point. Guides for containerizing, including automatic package dependency management and passing command line arguments, can be found in the DeGAUSS documentation (https://github.com/cole-brokamp/DeGAUSS).
As an example of the possible geomarkers that can be derived using DeGAUSS, we created 2 images. The first, “ACS_income,” is based on census tract geography and uses 2015 US Census Bureau tract shapefiles15 to assign census tracts to geocoded locations, and furthermore assigns the corresponding census tract–level median household income in 2015 inflation-adjusted dollars from the 5-year 2015 American Community Survey. The second, “dist_to_major_road,” calculates the distance (in meters) of each point to the nearest primary roadway, defined as a highway within the federal interstate highway system by TIGER/Line files.16 These example geomarkers were selected to demonstrate the ability of DeGAUSS to calculate both census tract–based geomarkers and exact location geomarkers that require geospatial calculations beyond merging with a census-tract dataset.
Comparison to other geocoding methods
All addresses in Hamilton County, Ohio, were obtained from the Cincinnati Area Geographical Information System (CAGIS)17 (accessed October 24, 2016). Residential addresses classified as “dwellings” by the Hamilton County auditor were retained for further analysis. Each CAGIS street address contained parcel-based corresponding latitude and longitude coordinates, considered as the gold standard by which other geocoding methods were compared. All addresses were geocoded using each of the following 4 methods: (1) The DeGAUSS geocoder image (version 2.2) was used to geocode all addresses. Only addresses geocoded with a “precision” of “street” or “range” were considered successfully geocoded. (2) ArcGIS (version 10.4.1) Online World Geocoding Service (accessed on January 18, 2017) was used to geocode all addresses. Only addresses geocoded to the United States and with an “Address_Type” of “Point Address” or “Street Address” were considered successfully geocoded. (3) The Google Geocoding application program interface (API) (accessed January 19–22, 2017) was used to geocode all addresses. The API returns errors for unsuccessful geocodes, so all addresses returned with a geocode were considered successfully geocoded. (4) SAS (version 9.4 M3) was used to geocode using PROC GEOCODE based on prebuilt geocoding data files supplied by SAS based on 2016 TIGER/Line files. Only addresses geocoded with a “_MATCHED_” level of “Street” were considered successfully geocoded.
A geocoding error was calculated as the distance between the coordinates derived using each geocoding approach and the CAGIS-defined locations using the geodesic distance formula based on the WGS84 ellipsoid.18
To identify any influence of inconsistent geocoding results on geomarker assessment, we utilized DeGAUSS images (version 2.2) to derive the census tract in which each geocoded coordinate was located and the corresponding census tract–level median household income and distance to the nearest major roadway. Census tract assignment accuracy was calculated as the percentage agreement for each geocoding method, with census tracts assigned using the CAGIS-defined locations. Pearson’s correlation coefficient was used to compare the median census tract–level household income. Distance to roadway error was defined as the difference between each calculated median distance to a major roadway using the CAGIS-defined locations.
Multisite study application
Five sites in the Electronic Medical Records and Genomics (eMERGE) Network participated in a proof-of-concept study. Study participant addresses were obtained from electronic medical records independently by each study site. Participating sites used DeGAUSS (version 2.2) to geocode the addresses of participants enrolled at their institution. Furthermore, geocoded locations were used in DeGAUSS to ascertain the census tract–level median household income and distance to nearest primary roadway for all study participants. Sites subsequently provided nonidentifiable geomarker data derived for each participant in addition to the precision of each geocoded address. Geomarker and precision data were summarized for all addresses and individually by site. Individuals at each institution that used DeGAUSS were asked to complete a brief user survey inquiring about the usability of the software using a Likert scale with 5 items ranging from “Very Difficult” to “Very Easy.”
Results
DeGAUSS software
DeGAUSS19 was created to address the limitations of current geocoders, with a specific emphasis on reproducible research within multisite studies utilizing place-based data. Using the Docker containerization platform, software is wrapped into a complete file system that contains everything needed to run, such as code, system tools and libraries, geographic data, etc. Containers are based on Docker images and run directly on the system infrastructure rather than relying on a guest operating system or virtual machine. This guarantees that the software will always run the same, regardless of its environment. Docker has been previously used for reproducible research and solves common challenges in reproducible computational science, such as managing evolving software dependencies and versions, maintaining code compatibility with changing computing environments, and overcoming barriers to adoption and implementation by others.20
The magnified panel inFigure 1 diagrams the geocoding and geomarker assessment process with DeGAUSS. Beginning with a list of addresses, DeGAUSS can be used to geocode and append location information, which can be further used with DeGAUSS to add geomarker information. The analyst can then strip away the PHI (address and location coordinates) in order to create a deidentified dataset. When applied to a multisite study (Figure 1), DeGAUSS software is distributed and the geocoding and geomarker assessment process is conducted independently at each study site. The deidentified datasets are then sent to a coordinating center for aggregation and further analysis.
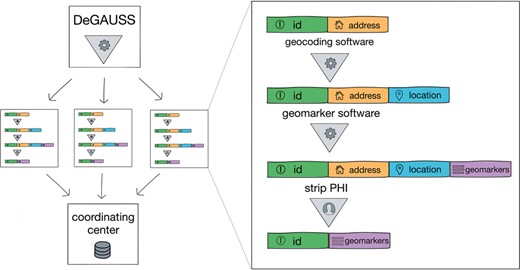
The distributed geomarker assessment process within a multisite study with DeGAUSS
Comparison to other geocoding methods
A total of 345 145 addresses in Hamilton County, Ohio, were downloaded from the CAGIS website, and of these, 215 368 (62%) were identified as residential addresses. These addresses and their corresponding latitude and longitude coordinates were used as the gold standard to compare the geocoding accuracy of DeGAUSS and 3 additional geocoding methods, ArcGIS, Google, and SAS. Geocoding results are presented inTable 2. Of the total 215 368 addresses, ArcGIS failed to geocode 1418 (0.7%), DeGAUSS failed on 121 (0.1%) addresses, Google failed on 519 (0.2%) addresses, and SAS failed on 2,035 (0.9%) addresses. Of the addresses that failed to be geocoded for each of the methods, most were unique to that specific method; for example, of the 1418 addresses that failed to be geocoded by ArcGIS, 1129 failed to be geocoded by only ArcGIS and were successfully geocoded by DeGAUSS, Google, and SAS (Table 2). Only 2 of the addresses failed to be geocoded by all 4 methods, and 41 total addresses failed to be geocoded by 3 of the 4 methods. This suggests that a common reason for erroneous geocodes among the 4 different methods did not exist, but rather it is likely due to methodological differences among the 4 distinct geocoding methods and not problems with the addresses themselves.
Comparison of geocoding and geomarker assessment accuracy based on all 215 368 residential addresses located in Hamilton County, Ohio
| Accuracy Metric | ArcGIS | SAS | DeGAUSS | |
|---|---|---|---|---|
| Failed,N (%) | 1418 (0.7) | 519 (0.2) | 2035 (0.9) | 121 (0.1) |
| Failed uniquely (N) | 1129 | 221 | 1526 | 66 |
| Census tract accuracy (%) | 98.7 | 99.2 | 93.9 | 95.5 |
| Median household income correlation | 1.00 | 1.00 | 0.98 | 0.97 |
| Median distance error (m) | 22 (18, 27) | 7 (4, 12) | 40 (28, 66) | 40 (25, 73) |
| Median distance to roadway error (m) | 0 (−15, 15) | 0 (−4, 4) | 1 (−25, 26) | 1 (−24, 25) |
The median distance errors also contain the 25th and 75th percentiles.
Geocoding error was calculated as the distance between the geocoding method’s resulting coordinate and the true location for all addresses. The median distance of geocoding error is also provided inTable 2. Overall, Google had the best accuracy, with a median error of 7 m, followed by ArcGIS (median error of 22 m), and DeGAUSS and SAS (median error of 40 m). When using the 4 methods’ geocoding results to assign each address to a corresponding census tract, all methods assigned the correct census tract for >90% of the addresses. ArcGIS and Google performed similarly, with census tract assignment accuracies of 98.7% and 99.2%, while DeGAUSS and SAS did not perform as well, with accuracies of 95.5% and 93.9%. Given that socioeconomic characteristics are spatially correlated at the census tract level, we extracted the median household income for each census tract from the American Community Survey and found that the Pearson’s correlation between census tract median household income derived for addresses using each method and median household income derived using the gold standard exceeded 0.97 (Table 2).
Although many geomarkers are assigned using census-level geographies, others are assigned based on exact location. A common example is the estimated exposure to a spatially varying pollutant, which is most often modeled by using features of the surrounding land. A common predictor in these models and a surrogate often used in lieu of estimated air pollution exposure is the distance to the nearest major roadway. The geocoded locations from each method were used to calculate the distance to the nearest major roadway, and the differences in these estimates when compared to the gold standard geocodes are summarized inTable 2. The median error for all methods was near zero, suggesting little overall bias. DeGAUSS and SAS performed similarly, with a 25th and 75th percentile of the roadway errors of (−24, 25) and (−25, 26), respectively. ArcGIS and Google performed better, with a 25th and 75th percentile of the roadway errors of (−15, 15) and (−4, 4), respectively.
Example multisite application
The eMERGE Network is a consortium of centers with either a biobank or study cohort combined with extensive genomic data and clinical data derived from electronic medical records.21 Geocoding was performed on a total of 63 982 unique address using DeGAUSS software across 5 eMERGE Network study sites: Cincinnati Children’s Hospital Medical Center (Cincinnati, OH, USA), Columbia University (New York City, NY, USA), Marshfield Clinic (Marshfield, WI, USA), Mayo Clinic (Rochester, MN, USA), and Vanderbilt University Medical Center (Nashville, TN, USA). The number of addresses per site and a summary of the geocoding results are presented inTable 3. A total of 61 866 geocodes (97% of all addresses) were obtained with a precision of “range” or “street” and used for further extraction of example geomarkers, while 3% of the address were geocoded at a precision of “zip” or “city” and were not used for geomarker assessment. As proof of concept, DeGAUSS was also used to calculate 2 example geomarkers. Over all addresses at the participating study sites, the median distance to the nearest primary roadway was 10 761m and the median census tract–level income was $57 750 (Table 4).
Geocoding results from example application in multisite study
| Site | Total | Range,N (%) | Street,N (%) | Zip,N (%) | City,N (%) |
|---|---|---|---|---|---|
| All | 63 982 | 55 983 (88) | 5883 (9) | 2116 (3) | 10 (0) |
| Cincinnati Children’s | 7233 | 6569 (91) | 449 (6) | 215 (3) | 3 (0) |
| Columbia | 3079 | 2581 (84) | 448 (15) | 50 (1) | 6 (0) |
| Marshfield | 20 751 | 17 504 (84) | 2,304 (11) | 943 (5) | 0 (0) |
| Mayo Clinic | 10 462 | 8508 (81) | 1,114 (11) | 840 (8) | 1 (0) |
| Vanderbilt | 22 457 | 20 821 (93) | 1,568 (7) | 68 (0) | 0 (0) |
The number and percentage of total addresses geocoded at each precision are shown overall and for each participating site.
Geomarker assessment results from example application in multisite study
| Site | N | Median distance (m) | Median income (USD) |
|---|---|---|---|
| All | 61 866 | 10 761 | 57 750 |
| Cincinnati Children’s | 7018 | 3342 | 56 656 |
| Columbia | 3029 | 1200 | 49 750 |
| Marshfield | 19 808 | 39 625 | 64 611 |
| Mayo Clinic | 9622 | 12 116 | 59 743 |
| Vanderbilt | 22 389 | 5210 | 50 143 |
The number of addresses geocoded to the precision level of “range” or “street,” median distance to major roadway, and median census tract–level income are shown overall and for each participating site.
In this initial pilot that applied DeGAUSS to a multisite study, users who completed the geocoding and example geomarker assessment at their individual sites indicated that using the DeGAUSS software was either “Easy” (n = 2) or “Very Easy” (n = 3). It is also notable that some of the users did not have experience with command line programming or GIS-related software, but were still able to easily geocode and estimate geomarkers for their respective cohorts.
DISCUSSION
We have described a new approach, and accompanying software application, to enable geocoding and characterizing of geographic, community, and environmental exposures for multisite studies. In addition to establishing the feasibility of the DeGAUSS approach for multisite studies, we also compared its features and geocoding accuracy to other commonly used geocoding platforms. Our results demonstrate that DeGAUSS is a reproducible method across study sites that provides geocoding and derives geomarkers with similar accuracy to results using ArcGIS, Google, and SAS geocoders.
DeGAUSS offers several improvements over current approaches to geocoding and geomarker assessment by addressing their limitations. A large obstacle in multisite studies is reproducibly analyzing data containing PHI. A main advantage of DeGAUSS is that it satisfies any site-specific IRB or HIPAA concerns because of its decentralized approach, where PHI does not leave the local machine at each individual site. Because DeGAUSS is based on containerization, it runs the same regardless of its computing environment. This makes the geocoding and geomarker assessment process reproducible across study sites. DeGAUSS can be customized to study-specific geomarker needs by the end user. It has been successfully used by researchers unfamiliar with the command line or GIS method. It does not require a lot of computational resources and can be used on Linux-, macOS-, or Windows-based personal computers. As an open source research tool, it is free of cost, unlike most other commonly used geocoding platforms.
When comparing DeGAUSS to other common geocoding platforms, our results generally agree with previous findings that range-based geocoders (eg, SAS, DeGAUSS) have lower geocoding accuracy but a higher geocoding match rate when compared to parcel-based geocoders (eg, Google, ArcGIS).5,6 Using a range-based geocoder instead of a parcel-based geocoder in DeGAUSS allows for a greater fraction of results that are able to be geocoded, but comes with the disadvantage that the increased number of results might not be as accurate as those found with a parcel-based geocoder.
The implications of reduced geocoding accuracy and increased geocoding results vary, depending on the type of geomarker under study. Geomarkers based on census tract or other geographic areas (zip code, county, etc.) are less likely to suffer problems from inaccurate geocoding because of their spatial correlation. When comparing DeGAUSS to a gold standard, we found that 95.5% of test addresses were assigned to the correct census tract, but the correlation of the median household income derived from those assigned census tracts had a correlation of 0.97 with the gold standard. Geomarkers that depend on exact location (eg, distance to the nearest roadway) rather than a containing geography (eg, census tracts) are likely to be more sensitive to small geocoding inaccuracies. When comparing DeGAUSS to a gold standard, we found that the range of median distance to roadway error was larger than when comparing Google to the gold standard; however, the median error was 1 m, suggesting that the misclassification exposure bias is nondifferential, resulting in health associations biased toward the null.22 A previous study found that using spatial interpolation geocoding approaches instead of an individual building matching approach tended to underestimate the negative effects of long-term urban air pollution exposure on lung function.7 The study utilized a fine-scale (10 m × 10 m) dispersion model to assess exposure to air pollution, and the association with lung function was biased toward the null when using range-based geocoders instead of a parcel-based geocoder.
Unlike erroneous geomarker assessment, geocoding status – or whether or not an address can be matched or geocoded – is likely differential due to differences in the characteristics of road networks and the census’s documentation of those road networks in urban vs rural areas. Indeed, others have previously found that excluding nongeocoded addresses can result in selection bias for epidemiological research.23 This study found that living in a rural zip code was highly associated with geocoding status. Furthermore, even among addresses only in urban zip codes, geocoding status was associated with numerous factors, including maternal race, maternal smoking, and having nonprivate insurance. Thus, excluding subjects because of geocoding status is likely differential and would cause biased health associations. The choice between increased address inclusion and decreased geocoding accuracy represents a trade-off between decreased selection bias and decreased exposure assessment bias. This trade-off should be considered in epidemiological studies utilizing addresses and will depend on the characteristics and location of the study population as well as the type of geomarker being studied.
Our application of DeGAUSS in an ongoing multisite study was successful and allowed for simple and reproducible characterization and aggregation of geomarkers without transmission or sharing of PHI. Although 2 specific geomarkers were used here, it is possible for the software to be customized for applications specific to different studies. DeGAUSS could be used in the future to make complex exposure model assessment models more widely available rather than relying on a reduced model, for example, supplying an exact-location and daily PM2.5 exposure assessment model instead of the more commonly used reduction of a model to 1 km × 1 km square grids and weekly averages.
CONCLUSION
Here we have established DeGAUSS, an open source software application for geocoding and geomarker assessment, and shown that it can be used to overcome multiple challenges in the use of address data in multisite studies. Furthermore, DeGAUSS also serves as a more general reproducible research tool for geocoding and geomarker assessment.
COMPETING INTERESTS
The authors declare no competing financial interests.
FUNDING
This work was partially supported by a National Institutes of Health (NIH) Center for Clinical and Translational Science and Training Processes and Methods Award through the University of Cincinnati Academic Health Center, and also by NIH National Human Genome Research Institute awards U01HG008666, U01HG006379, U01HG8701, U01HG008680, and U01HG008672.
ACKNOWLEDGMENTS
The authors would like to acknowledge Ting Sa for performing geocoding with SAS and the following individuals who tried DeGAUSS in its initial multisite study test and provided valuable feedback: Eric Larose (Marshfield), David Fasel (Columbia), Aliya Gifford and Doug Conway (Vanderbilt), Xiao Fan (Mayo Clinic), and Todd Lingren (Cincinnati Children’s).
References
