


Abstract
Birth month and climate impact lifetime disease risk, while the underlying exposures remain largely elusive. We seek to uncover distal risk factors underlying these relationships by probing the relationship between global exposure variance and disease risk variance by birth season.
This study utilizes electronic health record data from 6 sites representing 10.5 million individuals in 3 countries (United States, South Korea, and Taiwan). We obtained birth month–disease risk curves from each site in a case-control manner. Next, we correlated each birth month–disease risk curve with each exposure. A meta-analysis was then performed of correlations across sites. This allowed us to identify the most significant birth month–exposure relationships supported by all 6 sites while adjusting for multiplicity. We also successfully distinguish relative age effects (a cultural effect) from environmental exposures.
Attention deficit hyperactivity disorder was the only identified relative age association. Our methods identified several culprit exposures that correspond well with the literature in the field. These include a link between first-trimester exposure to carbon monoxide and increased risk of depressive disorder (R = 0.725, confidence interval [95% CI], 0.529-0.847), first-trimester exposure to fine air particulates and increased risk of atrial fibrillation (R = 0.564, 95% CI, 0.363-0.715), and decreased exposure to sunlight during the third trimester and increased risk of type 2 diabetes mellitus (R = −0.816, 95% CI, −0.5767, −0.929).
A global study of birth month–disease relationships reveals distal risk factors involved in causal biological pathways that underlie them.
INTRODUCTION
Seasonality and climate play an important role in human health and disease.1 Geography2 and climate3 modulate disease risk and/or severity while also altering our exposure to diverse environmental factors.2 Prenatal or perinatal exposure to many environmental variables has been tied with increased disease risk later in life.4,5 This includes climate factors such as reduced sunlight6 and high humidity.7 Flu or influenza-like illness (ILI) exposure during pregnancy is also tied to increased disease risk in offspring.8 Furthermore, exposure to pollutants during pregnancy can increase risk of disease in offspring. Such pollutants include carbon monoxide,9 nitrogen dioxide,10,11 ozone,12 and sulfur dioxide.13 These exposures are also known to vary seasonally because of changes in the atmospheric boundary layer depth, changes in emission rates, and changes in wind and advection.14 The well-studied relationship between asthma and birth month has been tied to perinatal exposure to dust mites.15 Dust mite prevalence depends heavily on temperature and humidity,16 including indoor air humidity.17 Both humidity and temperature vary seasonally, and seasonal variance depends on climate and geography.18 Therefore, it is reasonable to hypothesize that seasonal variation in either climate or pollutant factors could modulate birth month–disease risk patterns observed in epidemiology studies.
Electronic health records (EHRs) are currently used throughout the world to record and store health information collected during clinical encounters.19 Physicians, nurses, technicians, and other hospital caretakers/staff members enter information about patients’ encounters with the health care system into EHRs. Therefore, EHRs contain a large amount of information pertinent to either billing or caring for patients (ie, collected during clinical encounters). This includes prescriptions, diagnoses, laboratory tests and results, procedures, demographics, radiological reports, social worker reports, various types of clinical imaging, and a large amount of unstructured clinical notes. These EHRs represent a rich data source for high-throughput explorations of birth season–outcome relationships. Previously, we constructed an algorithm, called SeaWAS (for Season-Wide Association Study), to systematically investigate birth month–disease dependencies across all diseases with sufficient prevalence in EHRs,20 where birth month serves as a proxy for seasonal variance at birth. We conducted our initial study using data from New York City (NYC). Novel cardiovascular findings were validated in a separate EHR system, with increased disease risk observed from January through April (winter).21 This EHR was also in NYC, and therefore subjected to similar climate constraints.21 This replication was important in increasing our confidence that the findings were not due to unexplained and unmeasurable EHR biases.20,21 Our previous studies did not identify environmental factors behind the associations, because they were conducted in a single climate. Separately, researchers from northern Russia (northern Kola Peninsula) found that male babies born in the summer and fall had increased elasticity of blood vessels, which could be protective against cardiovascular disease later in life. Additionally, their results point to differences in cardiovascular physiology that have a birth month–season dependency.22 They also found that female patients who died from acute myocardial infarction were found to have a significant birth season relationship in the Sakha Republic, Russia.23
Importantly, 2 different types of effects can manifest themselves in variance in disease risk by birth month. The first is cultural/sociological, related to the timing of school start dates, and the second is related to variance in pollution, climate factors (eg, sunlight) that vary seasonally. These 2 types of birth month effects are important, as both can result in changes in disease risk. For cultural effects of birth month, we investigated relative age effects.24 We define relative age as an individual’s age relative to his or her peers in the same school grade. Relative age in school provides a competitive advantage for certain children with regard to sports performance.24 This can result in changes in disease risk, as children involved in sports are likely to experience more physical trauma (eg, head trauma in football). Also children younger than their peers are more likely to be victims of bullying, which can alter neurological development via direct trauma (eg, concussion) or indirect trauma (eg, depression). By definition, bullying involves a difference in power between the bully and the victim with regard to psychological or physical prowess, both depending on relative age.25 It is important to separate and distinguish these cultural effects from other birth season effects that are due to variance in seasonal environmental exposures (eg, sunlight, pollution).
In this study, we investigate the relationship between developmental stages (first, second, third trimester; perinatal or pregnancy-wide) and seasonal environmental exposures (climate, pollution, flu) for birth month–disease relationships. We also delineate birth month–disease relationships due to differences in school cutoff dates across sites, indicating the effect of relative age on human health and disease. Because of the diversity of diseases associated with birth month or season, different mechanisms and exposures are likely to be involved, depending on the particular disease implicated. We present results obtained using data from 6 distinct institutions, in 3 countries, spanning 5 cities, and with 4 distinct climates. We identify risk factors involved in birth season associations; however, we only refer to “causal risk factors” in instances where our results reveal the distal causal risk factor in an already established biological pathway, as we do not perform causal inference.
METHODS
Data
Clinical data
Birth month–disease risk data were obtained from 6 different hospitals or study sites. Permission was obtained from each institution’s local Institutional Review Board, which conforms to each country’s, and in some cases state’s, laws and guidelines. Our algorithm conforms to the Common Data Model (CDM) adopted by the Observational Health Data Sciences and Informatics (OHDSI) consortium26 and was published on GitHub,27 allowing for broad distribution.28 We ran our SeaWAS at 3 OHDSI collaborator sites using OHDSI-formatted R scripts that were run locally on each site’s EHR databases. Three study sites were not OHDSI participants at the time of the study. Therefore, code was formatted to meet those individual institutions’ data schemas. For non-OHDSI participants, we mapped International Classification of Diseases, Ninth Revision codes to the Systemized Nomenclature for Medicine–Clinical Terms (SNOMED-CT) codes using the schema contained within the CDM.20,26 Therefore, both non-OHDSI participants and OHDSI participants followed the same data-mapping schema. Other changes made to scripts for non-OHDSI participants were mechanical in nature, and consisted of changing table locations based on the local data structure (eg, a Person table vs a Patient Demographics table). No conceptual changes were made between OHDSI and non-OHDSI participants. As in the original algorithm, only the first instance of a diagnosis for each patient was included (for full algorithm details, see Boland et al.).20 Hereafter, we refer to distinct medical SNOMED-CT diagnoses as diseases, realizing that some may be indicative of medical conditions.
First, site characteristics were obtained, including patient demographics, setting (climate, inpatient/outpatient), and CDM version number (if an OHDSI data partner). For climate, we used the Köppen-Geiger climate classification system29,30 to describe the high-level climate of each region.
The SeaWAS algorithm returns birth month–disease risk curves for all diseases with at least 1000 patients at a given site. Those curves were then used as input into the developmental time point–exposure–disease model described below in the Statistical Modeling section.
Exposure data
To study the relationship between exposure and birth season, we required a dataset containing seasonal variance in exposures across a variety of exposure types and locations. We investigated 6 climate variables (mean sunshine hours, minimum temperature, maximum temperature, rainfall in inches, relative humidity, days of precipitation), 5 pollutant variables (fine particulate matter [PM 2.5 μm in diameter], ozone [O3], carbon monoxide [CO], nitrogen dioxide [NO2], and sulfur dioxide [SO2]), and flu/ILI in this study. We chose exposures meeting the following criteria: (1) linked to disease and birth-related outcomes in the literature, and (2) data were available at all 6 sites (including Asian sites).Supplementary Figure S3 illustrates the variation in seasonal exposure for each of the 12 factors (climate, pollution, and influenza) across all sites. Exposure data were assembled from the Centers for Disease Prevention and Control (CDC), the Environmental Protection Agency, and the National Oceanic and Atmospheric Administration. For Taiwanese and Korean data, we used data from the Korean Meteorological Administration, the Taiwanese Central Weather Bureau, and the Korean CDC Virological Surveillance.Supplementary Table S2 contains the sources for the exposures used in our study. When data were unavailable in a freely accessible public dataset, we used published literature to obtain the required seasonality in pollutant or flu exposure information and noted this inSupplementary Table S2.
Statistical modeling
Delineating culture effects from seasonal environmental effects
The first step in modeling the relationship between birth month–disease risk and various exposures was to distinguish birth month effects that were driven by purely cultural elements from those due to exposure to the environment, pollution, or some other factor. For instance, in sports, the age of a child athlete relative to his or her peers determines his or her ability to succeed. This has been demonstrated in multiple cases24,31 and has been characterized as the “relative age effect.” Children who are “older” relative to their peers are more likely to succeed in athletics, whereas children “younger” than their peers are at increased risk of being victims of bullying.32 To study the relative age effect, we collected the public school cutoff dates for each study site; these are listed inSupplementary Table S3. We adjusted data from each institution using the cutoff dates from that region. Therefore, curves ranged from 6 months older than the average child (ie, justafter the cutoff date) to 6 months younger than the average child (ie, justbefore the cutoff date).
A regression model for the relationship between relative age (+6 months vs average…−6 months vs average) and disease risk was used to compute the significance of relative age for each disease at each site. Diseases that were nominally significant across all 6 sites were considered to have significant cultural effects.
Modeling seasonal environmental exposures occurring during development
Twelve seasonally varying environmental exposures were identified as potential factors involved in birth month–disease relationships (Supplementary Figure S4). To model the relationship between exposures and birth month–disease risk, we first modeled the exposure level for each critical developmental time point. The trimester when an exposure occurs is vital in determining the effects on the offspring,33,34 therefore we examined the cumulative exposure for each factor across each of the 3 trimesters. In addition, we investigated pregnancy-wide exposure (cumulative exposure across the entire pregnancy) and perinatal exposure (exposure at birth), as these also represent critical developmental periods.
We obtained the average gestation period in weeks for each country. The mean gestation was 38.5 weeks in Taiwan,35 39.17 weeks in South Korea,36 and 38.6 weeks in the United States, according to the CDC.37 These average gestation periods were used to compute the typical conception month for each birth month.
Next, the cumulative exposure for each developmental stage (eg, first trimester) for each factor (eg, sunlight, rainfall) was calculated for a given birth month. We made these calculations using the midpoints of each month. For example, an October birth month would have a typical first-trimester period from mid-January to mid-April, a typical second-trimester period of mid-April to mid-July, and a typical third-trimester period of mid-July to mid-October. Therefore, first-trimester sunlight exposure for an October birth month would include sunlight exposure from mid-January through mid-April, and so on.
Meta-analysis across all 6 sites using random effects modeling
First, we correlated each exposure–developmental stage (eg, first, second, third trimester) with the disease relative risk by birth month per site. Each disease was compared against each developmental time point for each factor (eg, sunlight, rainfall). Pearson’s correlation was determined for the relationship between the exposure during a certain period (eg, first trimester) and disease risk. For each computation, the environmental exposure and the disease risk birth month curve each consisted of a set of 12 numeric data points. Pearson’s correlation was used because both variables were numeric. They were ordered to reflect the birth month. Because the seasonality of exposures varied across sites, these correlations were performed for each study site.
Next, we employed a meta-analysis approach to harness all data from our diverse sites. We used the DerSimonian-Laird (DSL) random-effect meta-analytical approach38 to determine an overall site-wide correlation coefficient representing the effect of a specific exposure (eg, sunlight) on a given disease (eg, depression) during a specific developmental stage (eg, first trimester). The DSL method transforms each site-specific correlation coefficient to a Fisher Z value, with a standard error determined by the site-specific sample size. This weighs correlations from sites with larger sample sizes for a given disease higher than correlations from sites with lower sample sizes. A summary correlation coefficient can then be computed from these sample-size adjusted correlations. This summary statistic represents the overall correlation obtained from the meta-analysis across the 6 sites. The DSL method was implemented based on Schulze39 and incorporated in the R metacor library,40 with widespread use among the research community.41
Hence, our method determines the correlation between each of 12 exposures across 133 diseases during 5 different developmental stages (ie, 3 trimesters, pregnancy-wide, and perinatal). Therefore, multiple comparisons must be accounted for in the analysis. To remain as stringent as possible and bias ourselves against finding disease-exposure relationships, we used Bonferroni’s method ofP-value correction that adjusts for all comparisons, including all 133 diseases, 12 exposures, and 5 developmental stages (133 × 12 × 5 = 7980 tests). This stringent threshold allows us to state thatexposure X duringstage Y is associated with increased or decreasedrisk of disease Z.Figure 1 illustrates the overall method to find significant exposure-disease relationships for a given developmental stage.
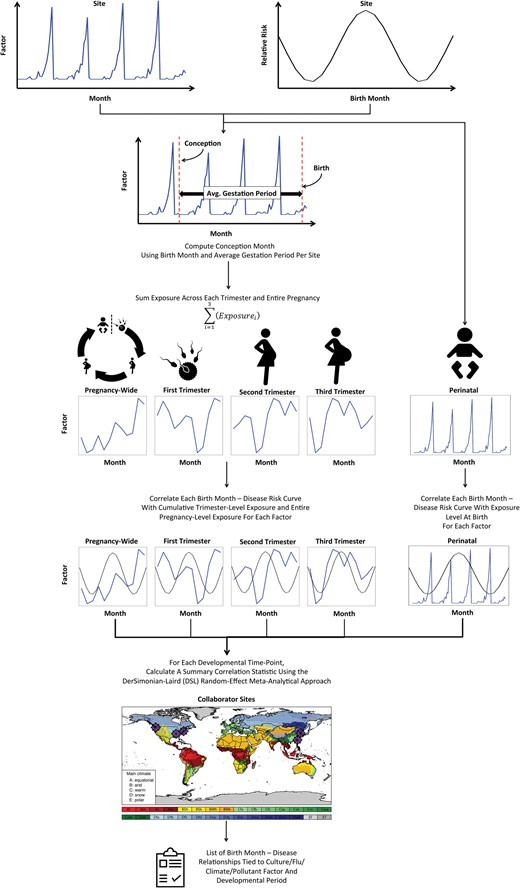
Schema depicting the model that captures the effects of environmental exposure at various developmental time points during prenatal/perinatal development. Results are integrated across multiple sites using the DerSimonian-Laird random effects meta-analytical approach.
RESULTS
Data
We obtained data from 6 study sites: Columbia University and Mount Sinai Hospital in New York City, New York; Vanderbilt University in Nashville, Tennessee; the University of Washington in Seattle, Washington; Ajou University in Suwon, South Korea; and the Taiwan National Health Insurance program, which contains data from each of Taiwan’s 4 geographic regions.Table 1 contains a breakdown of the patient demographics from each study site. Overall, patients were middle-aged, ranging from a median of 35 years old in Taiwan to 53 years old at Mount Sinai Hospital. However, most datasets had a median age in the 40s. Race and ethnicity varied by site due to differences in local populations. Both datasets from Asia did not collect race/ethnicity data, only nationality, with the assumption that the majority of patients were Asian. The percentage of Hispanic patients also varied across sites, with 2–4% at the University of Washington and Vanderbilt University vs 17–21% at both NYC sites.
Demographics of patients included in climate-wide SeaWAS (N = 10 499 887)
| Demographic | Columbia University,N (%) | Mt Sinai,N (%) | Vanderbilt University,N (%) | University of Washington,N (%) | Taipei Medical University,N (%) | Ajou University School of Medicine,N (%) |
|---|---|---|---|---|---|---|
| Location | New York City, NY | New York City, NY | Nashville, TN | Seattle, WA | Taiwan: All areas within Taiwan (99.99% of total population) | Suwon, South Korea |
| Total No. of Patients | 1 749 400 | 1 169 599 | 3 051 997 | 1 770 510 | 909 689 | 1 848 692 |
| Sexa | ||||||
| Female | 956 465 (54.67) | 678 717 (58.03) | 1 558 550 (51.07) | 895 351 (50.57) | 464 576 (51.07) | 892 178 (48.26) |
| Male | 791 534 (45.25) | 490 600 (41.95) | 1 278 939 (41.90) | 874 618 (49.40) | 445 113 (48.93) | 956 514 (51.74) |
| Othera | 1401 (0.08) | 282 (0.02) | 214 508 (7.03) | 541 (0.03) | – | – |
| Race | ||||||
| White | 665 366 (38.03) | 424 803 (36.32) | 1 653 093 (54.16) | 990 209 (55.93) | NA | NA |
| Otherb | 456 185 (26.08) | 165 423 (14.14) | NA | 82 656 (4.67) | NA | NA |
| Unidentified | 386 533 (22.10) | 256 819 (21.96) | 1 123 369 (36.81) | 367 100 (20.73) | NA | NA |
| Black | 189 123 (10.81) | 166 950 (14.27) | 241 978 (7.93) | 110 007 (6.21) | NA | NA |
| Declined | 29 747 (1.70) | NA | 5638 (0.18) | 16 976 (0.96) | NA | NA |
| Asian | 20 746 (1.19) | 45 596 (3.90) | 24 109 (0.79) | 122 839 (6.94) | NA | NA |
| Native American | 1511 (0.09) | 2447 (0.21) | 3074 (0.1) | 16 408 (0.93) | NA | NA |
| Pacific Islander | 189 (0.01) | 1094 (0.09) | 736 (0.02) | 3085 (0.17) | NA | NA |
| Hispanic | (See Ethnicity) | 106 467 (9.10) | (See Ethnicity) | 61 230 (3.46) | NA | NA |
| Korean | NA | NA | NA | NA | NA | 1 848 692 (100) |
| Taiwanese | NA | NA | NA | NA | 909 689 (100) | NA |
| Ethnicity | ||||||
| Non-Hispanic | 590 386 (33.75) | 761 535 (65.11) | 713 853 (23.39) | NA | NA | NA |
| Unidentified | 458 071 (26.18) | 208 899 (17.86) | 2 280 039 (74.71) | NA | NA | NA |
| Hispanic | 361 123 (20.64) | 199 165 (17.03) | 44 527 (1.46) | NA | NA | NA |
| Declined | 339 820 (19.42) | NA | 13 578 (0.44) | NA | NA | NA |
| Other Attributes | Median (first, third quartile) | |||||
| Total SNOMED-CT Codes per Patient | 6 (1–32) | 7 (3–22) | 8 (3–26) | 9 (3–24) | 186 (98–338) | 4 (2–12) |
| Distinct SNOMED-CT Codes per Patient | 3 (1–8) | 5 (2–10) | 5 (2–14) | 4 (2–11) | 49 (33–70) | 4 (2–12) |
| Age (year of service–year of birth) | 38 (22–58) | 53c (36–66) | 44 (25–61) | 48 (34–64) | 35 (20–50) | 42 (28–57) |
| Treatment Year Range | 1985–2013 | 1979–2015 | 1991–2016 | 1993–2016 | 1998–2011 | 1994–2013 |
| Köppen-Geiger Climate | Cfa | Cfa | Cfa | Csb | Aw | Dwa |
| In-/outpatient | Inpatient | Both | Both | Both | Both | Both |
| CDM Version | V.4 | None | None | None | V.5 | V.4 |
aOther (includes individuals of unidentified gender)
bOther (includes Hispanics not otherwise identified)
cComputed in days, age in years = age in days/365.25
NA, not applicable.
We collected the birth month–disease risk curves for each disease with at least 1000 patients at each study site.Supplementary Figure S1 depicts the overlap among all diseases with at least 1000 patients per site across sites. In total, 133 diseases had at least 1000 patients at all 6 sites, and we focused the remainder of our analyses on these diseases. Disease-specific sample sizes varied across sites. Essential hypertension was the most common disease at all 4 US sites. Both Asian sites showed increased prevalence of gastrointestinal issues and lower incidence of cardiovascular disease.Supplementary Table S1 depicts the top 5 diseases from each site.Supplementary Dataset S1 contains the sample size (N) for each condition at each of the 6 sites.
Statistical modeling
We first investigated the relationship between relative age, as determined by school cutoff dates, and birth month vs disease risk. Out of 133 diseases, only 1 disease was significantly associated with relative age across all 6 sites, attention deficit hyperactivity disorder (ADHD). The results both before relative age adjustment (ie, unadjusted birth month) and after are shown inFigure 2. The average difference in ADHD risk due to relative age was 17.97% (average peak of 1.084 vs average trough of 0.904), with children younger than their peers experiencing greater ADHD risk. No other diseases were significantly correlated with relative age.
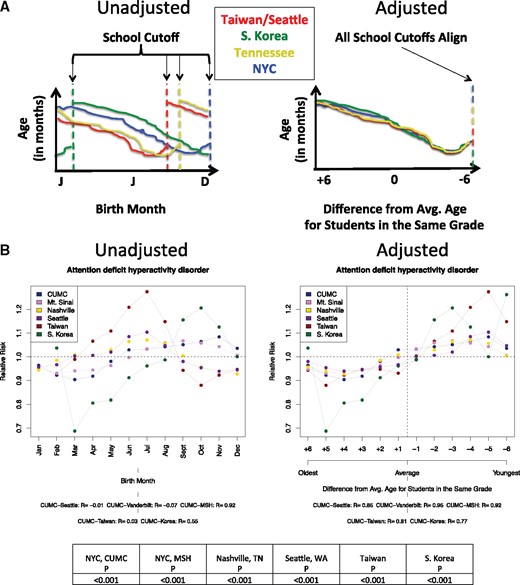
Method to detect the existence of a relative age effect in birth month–disease associations and results. (A) Illustrates the method of adjusting birth month–disease associations by school cutoff dates to calculate the relationship between relative age and disease risk. Taiwan and Seattle, Washington, are grouped together because the school cutoff date is the same at both locations (August 31). (B) Shows the only significantly associated disease found across all 6 sites between relative age and disease risk, attention deficit hyperactivity disorder (ADHD). The average difference in relative risk (RR) by relative age was calculated, resulting in a difference of 17.97% in peak vs trough months. Peak risk was observed in the −5 month and trough (lowest risk) was observed in the +4 month. Average peer age occurred at 0.
Next, we investigated the relationship between exposures at certain developmental stages (eg, a given trimester) and disease risk. Our method, shown inFigure 1, determines the correlation between each of 12 exposures across 133 diseases at 5 different developmental stages. Therefore, multiple comparisons must be accounted for in the analysis.Figure 3 shows the Manhattan plot for each developmental stage. We report results as significant if they pass the Bonferroni correction threshold for multiple comparisons across all analyses (ie, 133 diseases × 12 exposures × 5 time points = 7980 tests).
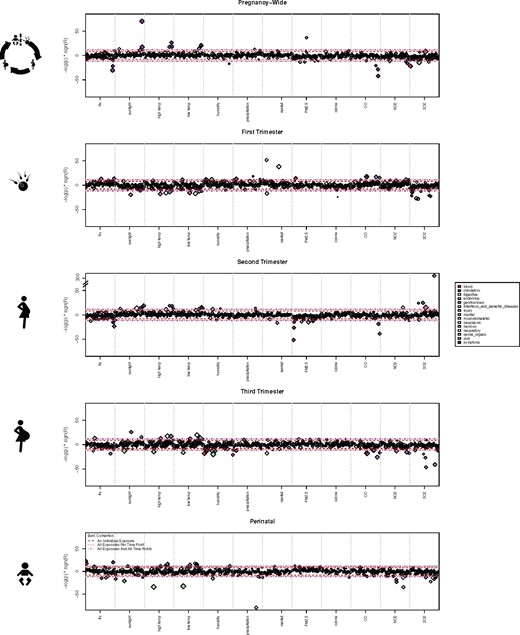
Manhattan plot showing relationship between disease risk and exposures occurring at certain developmental time points. Individual diseases are colored by their respective ICD-9 disease categories. The different Bonferroni-adjusted demarcations are noted. Note that acne is extremely associated with second-trimester sulfur dioxide exposure (−log (P) > 300). We reported results as significant if they passed the most stringent Bonferroni correction threshold (133 diseases × 12 exposures × 5 time points = 7980 tests).
A total of 56 distinct diseases were significantly associated with at least 1 exposure during at least 1 developmental stage. These 56 diseases were involved in 150 distinct disease–exposure–developmental stage tuples. Twenty-seven diseases were significantly associated across multiple exposure stages. This was expected due to the inherent correlation among exposures. One disease, dysuria, was involved in 14 tuples (disease-exposure-stage).Supplementary Dataset 2 contains all significant disease–exposure–developmental stage tuples.
Several first-trimester exposures were significantly correlated or anti-correlated with increased risk of depressive disorder later in life (Figure 4A), including low sunlight and temperature. However, the most significant association was a positive correlation between first-trimester carbon monoxide (CO) exposure (R = 0.725, confidence interval [95% CI], 0.529-0.847) and increased risk of depressive disorder. The relationship is shown inFigure 4B for all 6 individual sites.
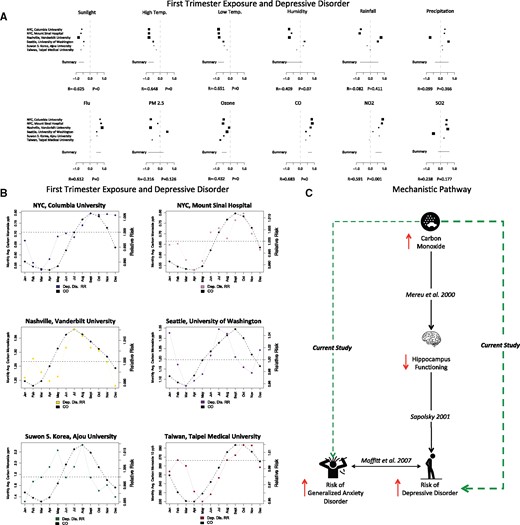
Depressive disorder and first-trimester exposure to carbon monoxide. (A) Depressive disorder and first-trimester exposure to all environmental factors. Larger squares in (A) indicate correlations with larger confidence intervals, which typically occur when the number of patients at a given site is low for a particular disease. (B) Relationship between depressive disorder and first-trimester carbon monoxide exposure at each study site. Each site has its own subplot in (B); the colored line is the relative risk of depressive disorder at that site by birth month. The solid black lines indicate first-trimester exposure to carbon monoxide (CO) at each site. (C) Connecting the literature on first-trimester CO exposure and offspring’s risk of depressive disorder and our current study. Solid black arrow denotes each literature link, with directionality denoted by up or down red arrows. High CO exposure increases the risk of lower hippocampus functioning (Mereu et al55). Reduced hippocampus functioning is a hallmark of depression/depressive disorder.56 The major link in our current study is the link between first-trimester CO exposure and increased risk of depressive disorder (thick dashed green line). Moffitt et al.52 found that for a large group of patients, there is a combined disorder involving generalized anxiety disorder (GAD) and major depressive disorder (MDD). We also found a lower correlation between GAD and first-trimester exposure to CO, suggesting that patients afflicted with both diseases could have been exposed to CO.
Atrial fibrillation was positively correlated with PM 2.5 exposure during the first trimester (Figures 5A and B). Taiwan and South Korea both had fewer patients with atrial fibrillation (10 476 patients in Taiwan and 2241 in South Korea) than US sites (which ranged from 36 837 to 58 771 patients), and the relationship was not as strong in those locations. Further, we found that lack of sunlight during both the third trimester and the perinatal period increased risk of type 2 diabetes mellitus (T2DM) later in life. The correlation between low sunlight and increased risk of T2DM in the offspring was stronger during the third trimester (R = −0.816, 95% CI, −0.5767, −0.929) than during the perinatal period (R = −0.580, 95% CI, −0.420, −0.705) (Supplementary Figure S2). The individual site breakdown of the relationship between exposure and low amounts of sunlight during the third trimester and later risk of T2DM is shown inFigures 5C and D.
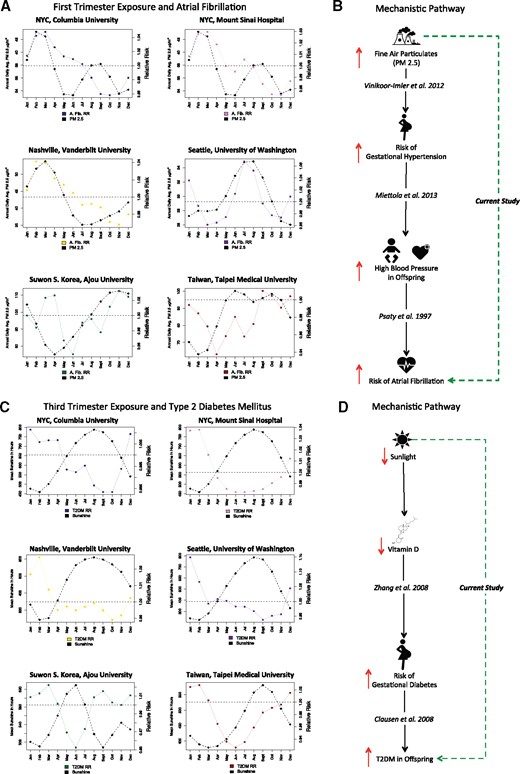
Atrial fibrillation and first-trimester exposure to fine particulate matter (PM 2.5), and type 2 diabetes mellitus and third-trimester exposure to sunlight.(A) Atrial fibrillation and first-trimester exposure to fine particulate matter (PM 2.5) at each study site. The colored line is the relative risk of atrial fibrillation by birth month per site. Solid black lines indicate first-trimester exposure to PM 2.5 per site.(B) First-trimester PM 2.5 exposure and offspring’s risk of atrial fibrillation: the literature and our current study. Solid black arrow denotes each literature link, with increase/decrease in risk depicted by up or down red arrows. Exposure to high PM 2.5 increases the risk of gestational hypertension.63 Gestational hypertension increases the risk of high blood pressure in the offspring.61 High blood pressure is a risk factor for atrial fibrillation.62 We found a distal cause: prenatal exposure to PM 2.5 increases the risk of atrial fibrillation, whereas others report findings of proximal causes in the same causal pathway.(C) Type 2 diabetes mellitus (T2DM) and third-trimester exposure to sunshine at each study site. The colored line is the relative risk of T2DM by birth month per site. Solid black lines indicate third-trimester exposure to mean sunshine hours per site.(D) Third-trimester exposure to sunshine and T2DM: the literature and our current study. Solid black arrow denotes each literature link, with increase/decrease in risk depicted by up or down red arrows. Low sunlight lowers vitamin D levels in the bloodstream. Zhang et al.45 2008 found that low vitamin D levels increased the risk of gestational diabetes in pregnant women. Clausen et al.46 2008 found that gestational diabetes increased the risk of T2DM in offspring exposed in utero. Our current study is denoted by the green dashed arrow, which connects third-trimester sunlight levels with T2DM risk later in life. Note that we are uncovering the distal causal risk factors vs proximal causes.
DISCUSSION
Our study provides a global interpretation of birth month–disease risk relationships and allows us to study a number of different possible mechanisms. We integrate results from more than 10 million unique individuals across 3 countries, 2 continents, and 5 distinct climates. We successfully distinguish birth month–disease relationships driven by relative age (a cultural effect) vs seasonal environmental exposures, including climate factors, pollution, and influenza. We found that ADHD was significantly correlated with relative age, having an average difference in disease risk of 17.97%, with younger children experiencing greater risk than their peers. We also found several exposures occurring during the prenatal period (ie, maternal exposures) that influence risk of disease in the offspring, and also perinatal exposures (ie, direct exposure to the offspring) that influence lifetime disease risk. Importantly, we only refer to causal risk factors in instances where our results reveal the distal causal risk factor in an already established pathway. In other instances, further testing would be required to clearly state whether our findings are causal factors or strongly correlated with another untested causal factor. We discuss our findings below.
Culture effects can induce birth month–disease dependencies: the tale of relative age
The relative age effect is the phenomenon whereby children are preferentially selected based on their age relative to their peers.24,31 This is commonly studied among athletes, for whom the slight advantages due to age, including size, mental agility, and timing of the onset of puberty, provide slightly older children with a distinctive edge over their classmates. Sociologists have also looked into the effect and found that children who are younger relative to their peers are at increased risk of being victims of bullying.32 Each of these relative age effects could alter an individual’s risk of disease later in life. Therefore, we explicitly investigated the relationship between relative age, calculated using birth month distributions, and lifetime disease risk of all diseases in our study. Of the 133 we tested, we found one disease, ADHD, to be significantly correlated with relative age (Figure 2).
A study among Taiwanese children also found a significant relationship between relative age and ADHD.42 This effect was also found in Iceland, where they also describe a relationship between academic performance and relative age.43 Other researchers have also studied the connection between academic performance, ADHD, and relative age, finding increased risk for adverse outcomes among younger children.44
While individual countries and sites have described the relationship between relative age and ADHD, this is the first comprehensive study to investigate relative age and disease across 3 distinct countries, 6 sites, and 4 distinct school cutoff dates. While validating other site-specific studies, our work also increases the need for provider awareness of this issue when diagnosing ADHD.
All prenatal exposures affecting the offspring’s lifetime disease risk are mediated through the fetal-maternal barrier. Therefore, we refer to prenatal exposures as maternal exposures that influence the offspring’s disease risk, and we refer to perinatal exposures as direct exposures to the newborn offspring.
Sunlight during third trimester and risk of type 2 diabetes mellitus in offspring
Sunlight was inversely correlated with T2DM during the third trimester (R = −0.816) and the perinatal period (R = −0.580). Low vitamin D exposure during pregnancy has been linked to increased risk of gestational diabetes,45 which is diabetes of the mother during pregnancy. Gestational diabetes is shown to increase the risk of T2DM among offspring, with a reported odds ratio of 7.76.46 In our current study, we link sunlight during the third trimester of pregnancy to changes in T2DM risk among offspring later in life.
We depict the link between prior work described in the literature and our current findings inFigure 5D. Each of the links details one small piece of the larger puzzle that we are attempting to reconstruct. In causal terms, those prior studies found the proximal causes, whereas we reveal the distal factor that can explain the smaller steps in the proximal pathway.47,48
Mechanistically, our results also fit into the “thrifty phenotype” hypothesis, which states that inadequate early nutrition impairs development of the pancreas, which in turn greatly increases the susceptibility of the offspring to T2DM.49,50 Gestational diabetes is often an indicator of impaired prenatal nutritional status. Our work links a distal factor, low sunlight exposure during the third trimester, to increased risk of T2DM in offspring. By uncovering a distal factor in this mechanism, we have opened the door for evolutionary biologists to delve further into this relationship to find a fitness benefit, if one does in fact exist.
First-trimester exposures and risk of depressive disorder in offspring
Risk of depressive disorder and birth month is an association that is studied often in the literature.51 An Australian study investigated the relationship between birth month in both the Southern and Northern Hemispheres, finding that the timing of the peak of flu was important in explaining the birth season–depression/suicide relationship.51
Figure 4A shows that first-trimester exposure to ILI was a significant factor in depressive disorder, with a slightly lower correlation value (R = 0.612, 95% CI, 0.384-0.770) than CO exposure (R = 0.725, 95% CI, 0.529-0.847). Depressive disorder was also significantly anti-correlated with sunlight (R = −0.625, 95% CI, −0.452 to −0.753) and temperature (high temperature,R = −0.645, 95% CI, −0.462 to −0.779; low temperature,R = −0.651, 95% CI, −0.446 to −0.790), indicating that lack of sunlight during the first trimester also appeared to be related to depressive disorder. Because the strongest factor was CO exposure, we focus on the mechanisms underlying a relationship between first-trimester CO exposure and depressive disorder. Additionally, prior studies investigated a connection between ILI/flu and sunlight with depressive disorder without investigating pollutant variables such as CO that are often correlated with sunlight.
We found generalized anxiety disorder (R = 0.404, 95% CI, 0.264-0.528) to also be significantly associated with first-trimester CO exposure, although the relationship was weaker. Importantly, generalized anxiety disorder was only significantly associated with variance in CO exposure and no other variable (such as flu or sunlight). This further bolstered our hypothesis of a mechanistic link between both depressive disorder and generalized anxiety disorder and first-trimester exposure to CO. Additionally, a study by Moffitt et al.52 found that generalized anxiety disorder (GAD) and major depressive disorder (MDD) often occur together with no apparent sequential pattern, suggesting that GAD + MDD may be a disease of its own. Therefore, finding that GAD and depressive disorder were significantly correlated with first-trimester CO exposure suggests that we may be uncovering a link between them.
Chronic CO poisoning exhibits itself clinically as chronic fatigue, depression, and often a diagnosis of influenza infection (due either to the patient’s weakened immune system or to flu-like symptoms that patients often present with),53 underscoring the importance of CO exposure in depression. Prenatal exposure to CO was shown to cause learning and memory deficits, indicating that maternal exposure to CO crosses both the fetal-maternal and blood-brain barriers.54 First-trimester exposure to CO was shown to cause intrauterine growth retardation12 and disrupt hippocampus functioning.55 Shrinking of the hippocampus is one of the critical hallmarks of depression.56 The link between first-trimester CO exposure and both GAD and depressive disorder may be mediated through a shrinking of the hippocampal structures caused by prenatal CO exposure. We depict the link between these prior studies on prenatal CO exposure and depression from the literature and our current findings inFigure 4C. The major link in our current study is the link between first-trimester CO exposure and increased risk of depressive disorder (thick dashed green line). We also found a lower correlation between GAD and first-trimester exposure to CO, suggesting that it could be patients afflicted with both diseases as described by Moffitt et al.52 who were exposed to CO.
Fine particulate matter during first trimester and risk of atrial fibrillation in offspring
We found a positive correlation between atrial fibrillation and PM 2.5 exposure during the first trimester (R = 0.564, 95% CI, 0.363-0.715). Taiwan and South Korea both had very low incidence of atrial fibrillation, and the relationship was not as strong in those locations, suggesting the possibility that an additional factor may mediate the relationship (Figure 5A). In adults, PM 2.5 exposure has been associated with adverse cardiovascular outcomes, including increased heart failure and mortality.57–59 Exposure to PM 2.5 in adults was also associated with increases in systolic blood pressure.60 Children of mothers with gestational hypertension were found to have higher blood pressure and elevated cholesterol and apolipoprotein B levels.61 High blood pressure is a risk factor for later development of atrial fibrillation.62 Exposure to fine air particulates increased the risk of gestational hypertension in pregnant women.63 We propose a mechanism that connects atrial fibrillation and first-trimester exposure to fine particulate matter by elevating maternal blood pressure and inducing gestational hypertension. We depict the link between the prior literature on this topic and prenatal fine air particulate exposure and increased risk of atrial fibrillation inFigure 5B. We uncovered a link between first-trimester exposure to fine air particulates and increased risk of atrial fibrillation later in life, which is a distal cause, with the proximal causes all outlined together inFigure 5B.
Perinatal exposures and later risk of disease
We also found diseases that were tied to exposures during the perinatal period (ie, the environment the baby is born into). One such relationship is perinatal flu exposure and lifetime risk of anemia (R = 0.660, 95% CI, 0.467-0.793). Some regions, such as NYC and South Korea, illustrated near perfect correlation between flu exposure and lifetime risk of anemia, while other sites had lower correlation. Newborns are at increased risk of developing infections due to influenza or other viruses due to their developing immune systems.64 Anemia often results as part of the body’s innate immune system to fight infections.65 The uncovered link between perinatal flu exposure and anemia may be mediated through an immune pathway.
Limitations
Our method investigates the presence or absence of correlations between exposures during different developmental stages and lifetime disease risk. We used the DSL meta-analysis method to uncover only correlations that were consistent across all study sites (ie, robust). While we probe deeply into how specific exposures can affect lifetime disease risk, there are other exposures (eg, diet) that we were unable to investigate in this study due to lack of available data. Importantly, if a co-varying environmental factor exists that was not included in our analysis and wascorrelated with an exposure or outcome in our analysis, then we may be uncovering an association that is due to this other unmeasured factor. For example, if seasonal smoking (an example of an unmeasured confounding exposure) were correlated with either CO seasonality (measured exposure) or lung cancer (measured outcome), then this would be a confounder. This is not as likely, given the number of sites and the diversity of our sites (Asia vs US). By using the DSL method, we make use of a random effects model, which should reduce the effects of unmeasured confounding.66
Additionally, given our use of EHR data, there are many latent (hidden) factors related to insurance practice and guidelines with regard to coding of diagnoses.67 Using data from different countries helps to minimize these biases, given that insurance coding practices often are country-specific68; however, other latent effects due to use of EHR data may remain, as these are often difficult to assess. Therefore, this remains a limitation of our work. We are confident in our findings that support the literature with regard to specific causal mechanisms. However, the quality of specific publicly available pollution and climate data could affect the meaningfulness of some specific results. We used only freely available data sources for seasonal exposure data. We provide all sources and seasonal information in the Supplement. More robust sources of data may exist in certain research laboratories in the world, but they are not freely available. We strongly support open science and transparency to the extent possible.69
Generalizability
Importantly, our methods can be used to find culprit exposures for birth month effects observed in highly dissimilar countries, eg, in Africa. But the number of potential culprit exposures would likely need to be increased due to their unique exposures and circumstances. Our methods should be highly generalizable across all cultural and climate bounds. However, our results, such as third-trimester sunlight and diabetes, may not generalize to countries with low socioeconomic status, because diabetes is often a disease of the affluent, and therefore some of the specific findings of this study are likely most applicable to countries with similar socioeconomic circumstances, eg, European and Asian countries. We also want to caution readers not to make individual-level assertions from our population-level analysis. Individual-level assertions require a prospective randomized controlled trial to establish. Our work confirms known findings and identifies areas that may be worthy of prospective human studies in the future.
CONCLUSION
In conclusion, this comprehensive study of factors involved in birth month–disease risk used data from more than 10 million patients, 3 countries, 2 continents, and 5 climates. We were able to distinguish the cultural effect of relative age from seasonal environmental exposures that affect birth month–disease dependencies. We were also able to identify both the seasonal environmental exposure and the stage that resulted in increased disease risk. Others in the literature have identified the proximal causes behind these relationships, whereas we identify distal causal risk factors. Several important findings include a link between both depressive disorder and generalized anxiety disorder and first-trimester exposure to carbon monoxide. Lack of sunlight exposure during the third trimester was correlated with increased type 2 diabetes mellitus risk. Finally, increased risk for atrial fibrillation occurred with first-trimester exposure to fine air particulates. By identifying the distal causal risk factors in these disease pathways, we are able to identify areas that may require seasonal dosing of prenatal supplements.
ACKNOWLEDGMENTS
We would like to thank Dr Andrew Gelman, Department of Statistics, Columbia University, for his tremendous help, support, and guidance during this project. Support for this research was provided through the following mechanisms: MRB is supported by generous funding by the Perelman School of Medicine, University of Pennsylvania; was supported by the National Library of Medicine training grant T15 LM00707 from July 2014 to June 2016; and was supported by the National Center for Advancing Translational Sciences, National Institutes of Health, through TL1 TR000082, formerly the NCRR, TL1 RR024158, from July 2016 to June 2017. MRB and NPT were both supported by R01 GM107145. DS was supported by a National Library of Medicine training grant at the University of Washington, T15 LM007442. SM was supported by the National Center for Advancing Translational Sciences, National Institutes of Health, through UL1 TR000423. SCY and RWP were supported by a grant from the Korea Health Technology R&D Project through the Korea Health Industry Development Institute, funded by the Ministry of Health and Welfare, Republic of Korea (grant no. HI16C0992).
CONTRIBUTIONS
Conceived study design: MRB, NPT. Contributed data to study: MRB, LL, RM, RC, UI, AN, MS, SCY, DS, SM, JL, RWP, JD, JTD, GH, NPT. Contributed to climate/statistical analysis: MRB, PP, PG, NPT. Wrote paper: MRB. Reviewed, edited, and approved final manuscript: MRB, PP, LL, RM, RC, UI, AN, MS, SCY, DS, SM, PR, JL, RWP, JD, JTD, GH, PG, NPT.
DISCLOSURES
PR and MS are employees and shareholders of Janssen Research and Development.
SUPPLEMENTARY MATERIAL
Supplementary material is available atJournal of the American Medical Informatics Association online.
REFERENCES
