


Abstract
Case management programs for high-need high-cost patients are spreading rapidly among health systems. PCORNet has substantial potential to support learning health systems in rapidly evaluating these programs, but access to complete patient data on health care utilization is limited as PCORNet is based on electronic health records not health insurance claims data. Because matching cases to comparison patients on baseline utilization is often a critical component of high-quality observational comparative effectiveness research for high-need high-cost patients, limited access to claims may negatively affect the quality of the matching process. We sought to determine whether the evaluation of programs for high-need high-cost patients required claims data to match cases to comparison patients.
A retrospective cohort study design with multiple measures of before-and-after health care utilization for 1935 case management patients and 3833 matched comparison patients aged 18 years and older from 2011 to 2015. EHR and claims data were extracted from 3 health systems participating in PCORNet.
Without matching on claims-based health care utilization, the case management programs at 2 of 3 health systems were associated with fewer hospital admissions and emergency visits over the subsequent 12 months. With matching on claims-based health care utilization, case management was no longer associated with admissions and emergency visits at those 2 programs.
The results of a PCORNet-facilitated evaluation of 3 programs for high-need high-cost patients differed substantially depending on whether claims data were available for matching cases to comparison patients.
Partnering with learning health systems to rapidly evaluate programs for high-need high-cost patients will require that PCORNet facilitates comprehensive and timely access to both electronic health records and health insurance claims data.
INTRODUCTION
Caring for high-need, high-cost patients is an urgent priority within American health care delivery.1 With the national shift to value-based payment, programs to improve quality and reduce costs for patients with complex needs are now spreading rapidly among health systems, even though recent reviews suggest little evidence of overall cost savings.2,3 Because existing models of case management vary widely in the details of design, implementation, and effectiveness,2,4 many health systems have moved forward in implementing these programs without clear guidance. These health systems often customize a program to their local setting and resources and may select only some program components, potentially reducing or eliminating the effectiveness of the original program.2 Given the high cost of case management programs, there is a critical need to evaluate programs adapted within health systems to ensure that effectiveness is maintained. This requires the rapid generation and application of knowledge—in essence, a “rapid-learning health system.”5 Learning health systems access and apply evidence from research while simultaneously learning from their own processes of delivering care. However, there are significant practical challenges to routine evaluation of effectiveness by health systems, including a lack of evaluation capacity and barriers related to data and information technology (IT) infrastructure.6
The capacity to conduct a rigorous evaluation would include having access to complete patient data on both clinical characteristics and high-cost events (eg, hospitalizations), allowing tracking of outcomes over time and matching cases to a comparison group on key baseline characteristics.7,8 Unfortunately, although health systems often have rich clinical information from their electronic health record (EHR), complete information on high-cost events is typically only available from health insurance claims,9 and EHRs are known to inadequately capture high-cost events.10,11 There are substantial barriers to obtaining health insurance claims data, and, even if some claims data are available, data providers may be reluctant to release data on large quantities of patients.12–14 Because matching cases to comparison patients on baseline characteristics is often a critical component of high-quality observational comparative effectiveness research that complements randomized trials,15,16 this limited access to claims data may negatively affect the quality of the matching process. Specifically, evaluators may be required to use only EHR data when matching cases and comparison patients on baseline characteristics, followed by linking to claims data only for the matched cohort. The extent to which EHR data are sufficient for matching patients in these situations is unknown, although there is reason to believe that matches may be poor using EHR data only as EHRs often do not tell a complete patient story.10
National organizations such as PCORI have the opportunity to build the data and IT infrastructure to solve these challenges.17 The PCORI-funded National Patient-Centered Clinical Research Network (PCORNet) contains EHR data on over 100 million Americans from more than 100 health institutions across the country. PCORNet launched a series of health system demonstrations to rapidly address questions of interest to health system leaders including questions about management of high-need high-cost patients.18,19 The PCORNet infrastructure has substantial potential to support local health systems in rapidly evaluating programs for high-need high-cost patients, but claims data are not routinely incorporated into PCORNet data warehouses.
OBJECTIVES
To examine the importance of access to complete claims data in rapidly evaluating care for high-need high-cost patients, we sought to determine whether the evaluation of case management programs required the use of claims data to match cases to comparison patients or whether EHR-based matching was sufficient. Specifically, we used both an EHR-based matching strategy and an EHR/claims-based matching strategy to evaluate the effectiveness of different outpatient case management programs, compared to usual care, in preventing hospital admissions and emergency visits across 3 health systems using PCORNet-facilitated EHR data combined with local claims data. This work was conducted under a 1-year PCORI-funded Health Systems Demonstration project (Principal Investigator: MAS) to examine the feasibility of using PCORNet to support learning health systems.
MATERIALS AND METHODS
Overview
We partnered with 3 academic health systems to obtain PCORNet-facilitated EHR data and local claims data. To determine whether evaluation of case management programs required the use of claims data to match cases to comparison patients, we conducted EHR-based matching for each of the 3 systems and EHR/claims-based matching for 2 of the 3 systems (Figure 1). To create matched cohorts, we created a 1-year baseline episode for each case management patient and then created multiple 1-year baseline episodes for potential comparison patients. After exclusions were applied, we matched the baseline episode for the eligible cases to the best-matched baseline episodes for ∼2 comparison patients. Once these 5 matched cohorts were created (3 EHR-based cohorts and 2 EHR/claims-based cohorts), we used a retrospective cohort study design with multiple before-and-after measures of the outcome for each case management patient and their matched comparison patients.20–22
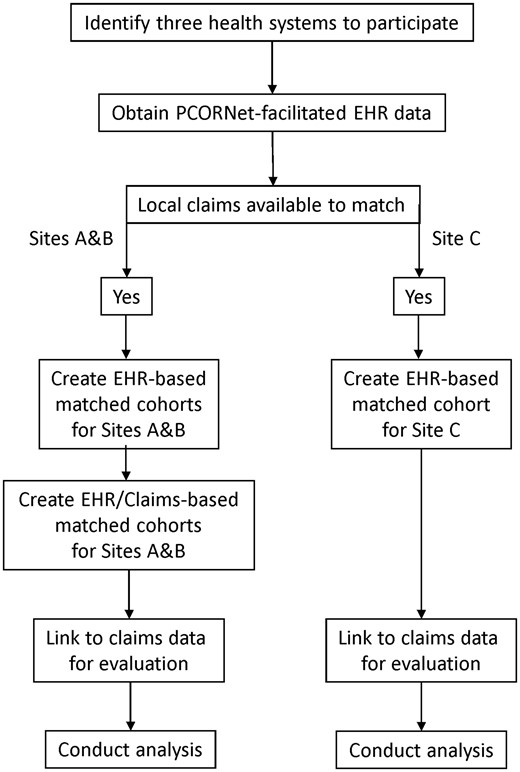
Overview of study design.
Study design and setting
Of the three academic health systems with case management programs that were included in this study, 2 were midwestern and 1 was eastern. These 3 systems participated in 2 PCORNet clinical data research networks: the Greater Plains Collaborative and the Accessible Research Commons for Health (formerly the Scalable Collaborative Infrastructure for a Learning Health System).
Data
Our data sources included information extracted from each site’s PCORNet Common Data Model v3 (hereafter EHR) data and linked locally to Medicare claims data. Each participating health system is a Medicare Accountable Care Organization (ACO) with the capability to link Medicare claims data to the PCORNet EHR data for evaluation. We used the EHR data to characterize patients during a 1-year baseline period for patients for Sites A (N = 44 026), B (N = 20 198), and C (N = 30 717). Similar EHR data were available from each of the 3 sites with 1 exception; at Site B, 72% of patients were missing information on tobacco use. We used Medicare claims data to obtain a complete record of all paid hospital admissions and emergency visits, including dates of service. Data were available from January 1, 2011 through September 30, 2015, with the first possible follow-up period (ie, case management enrollment date) occurring January 1, 2012. Claims data were processed using established standards (https://www.hipxchange.org/ClaimsData). Data on the case management programs were collected from case management program leadership at each site, facilitated by PCORNet.
For 2 sites (A and B), the PCORNet EHR data could be linked to local Medicare claims prior to matching, allowing development of 2 matched cohorts for each site (one cohort matched using the EHR data only and 1 cohort matched using the linked EHR and claims data). At site C, due to data restrictions, the PCORNet EHR data could only be linked to local Medicare claims data after the EHR-only matched cohort was developed. All 3 health systems allowed the use of the local claims data for evaluation purposes (ie, to obtain information on hospital admissions and emergency visits for the matched cohorts, but Site C did not allow the use of local claims data for matching purposes). Specifically, the Medicare ACO at Site C was unable to release claims data on their entire ACO population for matching purposes, but was able to release the ACO claims for linkage to the EHR-matched cohort.
Case management patients
Each case management patient was followed retrospectively for 12 months prior to enrollment (ie, “baseline period”), and monthly after enrollment up to 12 months or until death or censoring due to lack of data (ie, “follow-up period”). We used an intent-to-treat approach, in which individuals who disenrolled from the program were not censored and continued to be treated as enrolled for the purposes of measuring outcomes. We included only patients ages 18 years and older who were enrolled in case management for >1 month and who met the following criteria: (a) continuous Medicare claims data available for at least 1 year prior to enrollment in case management; (b) assigned to the Medicare ACO during the baseline and follow-up periods; and (c) at least 1 month of continuous Medicare claims data during the follow-up period. Patients were excluded if they were: enrolled in hospice, on dialysis, or had end-stage renal disease during the baseline time period; or not enrolled in Medicare Part A or Part B throughout the baseline and follow-up period. The final sample of case management patients meeting these criteria was 1935, including Site A (N = 139), Site B (N = 718), and Site C (N = 1078).
Variables
Our outcome measure was a count of event-days from the Medicare claims, defined as the number of days spent in the hospital or at an emergency department visit. To construct repeated measures of our outcome, we created a data set with 1 observation per patient per month. The first month was 12 months prior to the enrollment/match date and continued for a minimum of 1 month and a maximum of 12 months after the enrollment/match date, unless the patient died or was otherwise censored due to lack of data. This approach provided both baseline utilization and follow- up outcome utilization measures from the Medicare claims.
Patient characteristics were measured from EHR during the baseline year for each patient. Sociodemographics included age (continuous), gender, race (White/non-White), ethnicity (Hispanic/non-Hispanic), and tobacco use (ever smoked). Chronic conditions were measured from the diagnosis codes associated with medical encounters in the EHR data and included 28 medical conditions defined by Elixhauser et al using International Classification of Diseases, 9th rev., Clinical Modification (ICD-9-CM) diagnosis codes along with a count of the conditions and an indicator for 3 or more of these conditions.23 Additional variables included the hierarchical condition category (HCC) score and 78 indicators for the HCC chronic conditions.24 Baseline utilization from EHR (for matching purposes only) included annual counts of unique ambulatory visit providers and ambulatory visits, as well as annual and monthly counts of hospitalizations, hospital days, emergency visits, and a combined event-days measure (defined above).
Matched comparison patients
Our design took advantage of the extended roll-out of the case management program at each site to identify eligible comparison patients who were not enrolled in the case management program (i.e., controls who received usual care) but who had comparable patient characteristics at the time of the matched case patient’s enrollment in case management. Our first cohort (the “EHR-matched” cohort) matched case management patients to comparison patients using baseline characteristics and utilization from only the EHR data for Sites A, B, and C. Because enrollment in case management was staggered over time, we constructed multiple possible baseline 1-year time periods meeting criteria above using the EHR data for each potential comparison patient age 18 years and older. From this large pool of possible matches, we matched each case management patient to ∼2 control patients. Eligible control patients could not have been enrolled in case management for the year following their matching date. Our second cohort (the “EHR/claims-matched” cohort) matched the case management patients to a potentially different set of comparison patients using baseline characteristics from the EHR data and baseline utilization from the Medicare claims for Sites A and B.
We used a combination of exact matching and, within exact match strata, we selected controls using propensity-score based nearest neighbor matching without replacement (i.e., controls were matched to no more than 1 case patient).25,26 Exact match variables differed slightly at each site, but variables used for all 3 sites included: baseline count of hospital events (coded as 0, 1, 2, 3 or more); any event in month 12 of the baseline year; HCC score (four categories); age (six categories); indicators for chronic obstructive pulmonary disease, Stage IV chronic kidney disease, and congestive heart failure; and an indicator for 3 or more Elixhauser comorbidities. If any of the more than 100 baseline variables had greater than 25% standardized mean difference between cases and matched comparison patients, we added that variable to the exact match, continuing until no variables had greater than 25% standardized mean difference (Supplementary Appendices 1–3).27 The propensity score model for nearest neighbor matching was based on a logistic regression predicting participation in the case management program with a lasso penalty for variable selection; 6 to 11 variables were selected across sites, including HCC score, medication and comorbidity counts, and indicators for chronic conditions.
The date at which a comparison patient had a close match to a case management patient with respect to baseline characteristics was the “match date” and treated identically to the case management “enrollment date” in all subsequent analyses. The final sample of comparison patients meeting these criteria in the EHR-matched cohort was 3833, including Site A (N = 275), Site B (N = 1417), and Site C (N = 2141). The final sample of comparison patients meeting these criteria in the EHR/claims-matched cohort was 1336, including Site A (N = 226) and Site B (N = 1140).
Statistical analysis
Descriptive analyses compared means and proportions for baseline patient characteristics between case and comparison patients at each site, as well as average baseline and annualized follow-up counts of event-days from Medicare claims. We conducted longitudinal zero-inflated poisson regression modeling of the risk-adjusted difference in monthly event-day count trajectories between the case and control patients using patient-month data, with inverse propensity score weights. Models included terms for the preintervention trend, change in level, and postintervention trend in our monthly events for both cases and controls. Because baseline events were not completely balanced for intervention and control patients, and because there was evidence of increased utilization towards the end of the baseline year among cases, models included additional statistical adjustment for any event in month 12 of the baseline year, a count of events in months 10 and 11 of the baseline year, and a count of events in months 1–9 of the baseline year. To improve interpretation, results were transformed into the predicted number of event-days prevented for 100 patients enrolled in case management programs over 1 year. Bootstrapped confidence intervals were calculated using 100 replications. Analyses were carried out at each site using SAS software (SAS Institute, Inc., Cary, North Carolina). This analysis was deemed exempt by the Institutional Review Board at each institution.
RESULTS
Case management programs
The outpatient case management programs at each of the 3 sites had substantial similarities and some differences (Table 1). Each program was designed to address high-cost utilization, including emergency department and inpatient days. All programs used risk scores for case finding, in addition to other case finding methods. The case managers at each site included nurses and social workers.
Case management program characteristics
| Site A | Site B | Site C | |
|---|---|---|---|
| Enrolled patients (#) | ∼500 | ∼1000 | ∼2500 |
| Case finding process | |||
| Risk score | Yes | Yes | Yes |
| Other process | Referral | High use, quality gaps | Referral |
| Case manager | |||
| Profession | RN+SW Dyad | RN or SW | RN+SW Dyad |
| Training | CCMC certification | CCMC certification | Internal |
| Intervention intensity | |||
| Contacts (#) | 2 per month | 2 per month | 2 per month |
| Duration | Avg. 160 days | As needed | Avg. 26 months |
| Caseload | 20–25 prime; 40–50 secondary | 80–100 | 150–180 |
| Care integration | |||
| Physician collaboration | Yes | Yes | Yes |
| Mode of contact | Telephone; in person | Telephone; in person | Telephone; in person |
| Program location | Central | Central | PCP clinic |
Abbreviations: CCMC, Commission for Case Manager Certification; RN, registered nurse; SW, social worker.
Formal training was required at Sites A and B using the Commission for Case Manager Certification program, while Site C developed and used an internal training program. All 3 sites had similar intervention intensity averaging 2 contacts per month per patient, and caseloads varied across the sites with the largest caseloads at Site C. While all 3 programs used primarily telephonic and some in person contacts with the patient and involved collaboration with the patient’s primary care physician, case managers were located within primary care clinics only at Site C. For Sites A and B, the case managers were located centrally within the organization and not at the primary care clinics.
Patient sociodemographic and chronic conditions
The 3 sites had similarities in the characteristics of patients enrolled in their case management programs for both the EHR-matched and EHR/claims-matched cohorts (Tables 2 and 3, see columns labeled “Case”). Patients were approximately 70 years of age at Sites A and B, but slightly older at Site C. Patients at Site B had slightly lower risk scores, as evidenced by an average HCC score of 1.9 versus 2.3 at both Sites A and C. Across all 3 sites, case management patients tended to be female and White. Patients at Site C visited almost twice the number of unique ambulatory care providers in the baseline year and had higher rates of smoking. Patients at Site C had higher rates of congestive heart failure, anemia, peripheral vascular disease, and valvular disease, while Site A had lower rates of diabetes without chronic complications. Within sites, demographic and clinical characteristics of case management and matched comparison patients were similar with respect to EHR variables (Tables 2 and 3).
Patient characteristics for case management and matched comparison patients (EHR-matched cohort)a
| Site A | Site B | Site C | ||||
|---|---|---|---|---|---|---|
| Case(n = 139) | Comparison(n = 275) | Case(n = 718) | Comparison(n = 1417) | Case(n = 1078) | Comparison(n = 2141) | |
| Age, mean (SD) | 69 (14) | 70 (14) | 71 (13) | 70 (14) | 74 (12) | 73 (13) |
| Female | 58 | 64 | 55 | 58 | 58 | 57 |
| White | 81 | 81 | 92 | 94 | 86 | 86 |
| Hispanic | 2 | 1 | 2 | 2 | 1 | 2 |
| Ever smokedb | 40 | 41 | 52 | 54 | 76 | 80 |
| HCC score, mean (SD) | 2.3 (1.2) | 2.3 (1.2) | 1.9 (0.9) | 1.9 (0.9) | 2.3 (1.1) | 2.3 (1.0) |
| Ambulatory provider count, mean (SD) | 5.2 (3.7) | 5.0 (3.7) | 6.9 (4.7) | 6.3 (4.1) | 13.0 (10.0) | 13.0 (8.9) |
| 3 or more chronic conditions | 94 | 93 | 90 | 90 | 98 | 98 |
| Congestive heart failure | 25 | 25 | 20 | 20 | 38 | 38 |
| COPD | 47 | 47 | 42 | 41 | 49 | 49 |
| Chronic kidney disease, severe | 2 | 2 | 1 | 1 | 1 | 1 |
| Deficiency anemia | 50 | 43 | 43 | 47 | 58 | 58 |
| Rheumatoid arthritis/vasculitis | 9 | 11 | 14 | 18 | 18 | 13 |
| Coagulopathy | 9 | 7 | 12 | 12 | 21 | 20 |
| Depression | 51 | 50 | 44 | 47 | 49 | 49 |
| Diabetes with chronic complications | 27 | 27 | 18 | 16 | 27 | 21 |
| Diabetes w/o chronic complications | 6 | 5 | 25 | 22 | 17 | 17 |
| Hypertension | 82 | 83 | 87 | 81 | 93 | 89 |
| Hypothyroidism | 34 | 32 | 27 | 32 | 31 | 31 |
| Liver disease | 4 | 3 | 12 | 13 | 14 | 15 |
| Lymphoma | 3 | 4 | 3 | 4 | 5 | 4 |
| Fluid/electrolyte disorders | 44 | 44 | 52 | 50 | 54 | 52 |
| Metastatic cancer | 5 | 6 | 7 | 8 | 11 | 10 |
| Other neurological disorders | 38 | 28 | 33 | 31 | 36 | 34 |
| Obesity | 29 | 25 | 35 | 35 | 31 | 31 |
| Paralysis | 3 | 6 | 7 | 6 | 11 | 10 |
| Pulmonary circulation disease | 18 | 16 | 12 | 12 | 19 | 16 |
| Psychosis | 27 | 24 | 25 | 28 | 32 | 31 |
| Peripheral vascular disease | 23 | 23 | 28 | 23 | 39 | 38 |
| Renal failure | 35 | 27 | 23 | 20 | 35 | 34 |
| Solid tumor w/o metastasis | 15 | 14 | 19 | 21 | 26 | 23 |
| Valvular disease | 14 | 13 | 23 | 24 | 53 | 54 |
| Weight loss | 22 | 18 | 18 | 21 | 24 | 25 |
Abbreviation: SD, standard deviation.
Values were based on EHR data and represent % unless otherwise indicated.
At Site B, 72% of patients had missing information on smoking, percents are for patients with nonmissing values.
Patient characteristics for case management and matched comparison patients (EHR/claims-matched cohort)a
| Site A | Site B | |||
|---|---|---|---|---|
| Case (n = 119) | Comparison (n = 226) | Case (n = 610) | Comparison (n = 1140) | |
| Age, mean (SD) | 71 (14) | 70 (15) | 70 (13) | 69 (14) |
| Female | 60 | 63 | 54 | 54 |
| White | 80 | 88 | 92 | 92 |
| Hispanic | 3 | 0 | 1 | 1 |
| Ever smokedb | 37 | 35 | 25 | 21 |
| HCC score, mean (SD) | 2.1 (1) | 2.0 (1) | 1.8 (1) | 1.8 (1) |
| Ambulatory provider count, mean (SD) | 4.8 (3.2) | 4.6 (4.2) | 6.2 (4.2) | 5.9 (3.8) |
| 3 or more chronic conditions | 93 | 93 | 89 | 89 |
| Congestive heart failure | 23 | 22 | 17 | 15 |
| COPD | 44 | 42 | 38 | 37 |
| Chronic kidney disease, severe | 2 | 2 | 1 | 1 |
| Deficiency anemia | 46 | 47 | 40 | 41 |
| Rheumatoid arthritis/vasculitis | 10 | 10 | 13 | 12 |
| Coagulopathy | 8 | 8 | 10 | 11 |
| Depression | 51 | 46 | 42 | 44 |
| Diabetes with chronic complications | 25 | 24 | 17 | 16 |
| Diabetes w/o chronic complications | 7 | 3 | 27 | 23 |
| Hypertension | 83 | 82 | 86 | 79 |
| Hypothyroidism | 36 | 33 | 26 | 29 |
| Liver disease | 6 | 6 | 11 | 11 |
| Lymphoma | 4 | 4 | 2 | 3 |
| Fluid/electrolyte disorders | 42 | 33 | 48 | 44 |
| Metastatic cancer | 5 | 5 | 7 | 7 |
| Other neurological disorders | 35 | 27 | 30 | 30 |
| Obesity | 27 | 24 | 35 | 33 |
| Paralysis | 3 | 3 | 8 | 7 |
| Pulmonary circulation disease | 16 | 15 | 10 | 10 |
| Psychosis | 24 | 20 | 23 | 28 |
| Peripheral vascular disease | 19 | 19 | 26 | 21 |
| Renal failure | 34 | 33 | 20 | 20 |
| Solid tumor w/o metastasis | 14 | 17 | 19 | 19 |
| Valvular disease | 12 | 16 | 22 | 18 |
| Weight loss | 16 | 16 | 17 | 19 |
Abbreviation: SD, standard deviation.
Values were based on EHR data and represent % unless otherwise indicated.
At Site B, 72% of patients had missing information on smoking, percents are for patients with nonmissing values.
Relationship between case management and event-days
In the EHR-matched cohort, there were differences in unadjusted baseline event-days between cases and controls within Sites A and B based on the Medicare claims data (Table 4), although there were not baseline differences at Site C. Both Site A and Site B case management patients had approximately double the unadjusted event-days of matched controls at baseline based on Medicare claims data. In the EHR/claims-matched cohort, the baseline differences in event-days between cases and controls were substantially reduced.
Unadjusted average event-days for case management and matched comparison patients and adjusted predicted number of event-days prevented with case management
| Site A | Site B | Site C | |||||
|---|---|---|---|---|---|---|---|
| Unadjusted Average Annual Baseline and Followup Event-Daysa,b | |||||||
| Baseline | Followup | Baseline | Followup | Baseline | Followup | ||
| EHR-matched | |||||||
| Case | 11.2 (16.5) | 10.6 (15.9) | 7.1 (15.5) | 6.6 (18.2) | 5.2 (10.2) | 6.1 (13.9) | |
| Comparison | 6 (8.9) | 9.1 (16.6) | 4.3 (10.7) | 5.7 (16.8) | 4.6 (9.8) | 4.3 (11.3) | |
| EHR/claims-matched | |||||||
| Case | 9.6 (14.1) | 9.1 (14.7) | 5.5 (12.6) | 5.4 (17) | – | – | |
| Comparison | 7.1 (12.2) | 10.7 (18.8) | 5 (11) | 7.9 (22.4) | – | – | |
| Adjusted Predicted Number of Event-Days Preventedc | |||||||
| Prediction | 95% CI | Prediction | 95% CI | Prediction | 95% CI | ||
| EHR-matched | 814 | (299, 1604) | 376 | (164, 575) | −80 | (-286, 102) | |
| EHR/claims-matched | 180 | (-495, 752) | −118 | (-362, 96) | – | – | |
Abbreviation: CI, confidence interval.
Event-days is defined as the number of days spent in the hospital or at an emergency department visit, identified from Medicare claims data.
Values represent means and standard deviations.
Values represent adjusted predicted number of event-days prevented per 100 patients enrolled in case management for 1 year and 95% CI. Risk adjustment was achieved through exact and propensity score matching, propensity score weighting, and additional statistical adjustment for any event in month 12 of the baseline year, a count of events in months 10 and 11 of the baseline year, and a count of events in months 1–9 of the baseline year.
In the EHR-matched cohort, enrollment in the case management programs at both Site A and Site B was associated with a significant decline in event-days versus the comparison patients (Figure 2 and Table 4). Specifically, for Site A, we estimated 814 fewer event-days for every 100 patients who were followed for 12 months. For Site B, we estimated 376 fewer event-days for every 100 patients who were followed for 12 months. For Site C, enrollment in the case management program was not associated with a change in event-days over time. In the EHR/claims-matched cohort, these statistically significant differences at Site A and Site B disappeared. In the EHR/claims-matched cohort, enrollment in the case management program was not associated with a change in event-days over time at either Site A or Site B.
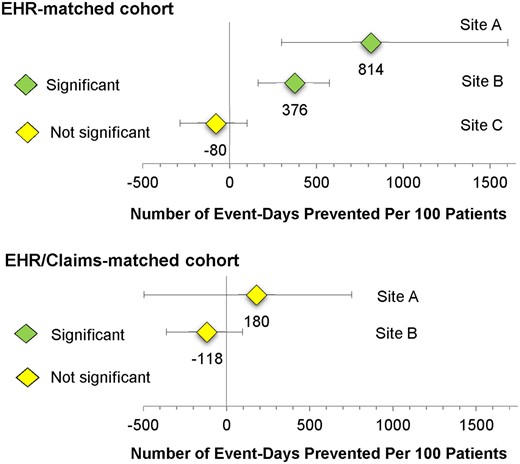
Adjusted predicted number of event-days prevented per 100 patients enrolled in case management for 1 year.
DISCUSSION
The results of a PCORNet-facilitated evaluation of case management programs at 3 different sites differed substantially depending on whether health care claims data were available for matching cases to comparison patients. Using an EHR-based matching strategy, we found that enrollment into the outpatient case management programs at 2 of 3 participating health systems was associated with fewer hospital admissions and emergency visits over the subsequent 12 months. In contrast, using the EHR/claims-based matching strategy, enrollment in the case management program was not associated with a change in event-days over time at either of these 2 sites.
As expected, our EHR data was incomplete with respect to hospital admissions and emergency visits,28,29 and the completeness of data varied across the 3 sites. This differential data availability was evident in our findings that results differed between EHR-based and EHR/claims-based matching strategies for the 2 sites that had both strategies implemented. This suggests that for some sites, concerted effort will be required to improve the completeness and reliability of EHR data through mechanisms such as participation in health information exchanges.10 As suggested by Hersh et al, these efforts would be complemented by policies “calling for, mandating, or providing incentives for universal adoption of standards-based, interoperable health care data, captured seamlessly across the diverse sites where patients receive care.”10 At the third site, which used only the EHR-based matching strategy, enrollment in the case management program was not associated with a change in outcomes. At this site, it appeared that the results of EHR-based matching were similar to the results of the EHR/claims-based matching strategies, suggesting that the matching process may not always be influenced by the addition of claims data.
To conduct high-quality observational comparative effectiveness research that complements randomized trials,15 our results suggest that claims data may be required not only for accurate outcomes assessment but also for matching of cases to comparison patients on baseline characteristics. For our EHR-based matching strategy, supplemental risk-adjustment of baseline differences in claims-based utilization and propensity score weighting were insufficient to fully adjust for differences between case management and comparison patients at 2 sites. In contrast, for our EHR/claims-based matching strategy, the addition of matching on claims-based measures of baseline utilization allowed us to reduce dependence on regression-based statistical adjustment. This claims-enhanced matching on baseline outcome measures improved performance, consistent with previous literature.16 Matching is often considered a superior approach because it does not require the strict assumptions necessary for statistical adjustment.26,27,30
Established case management programs are often complex and difficult to implement as a whole,1 and health systems often select only some program components which could potentially compromise program effectiveness.2 All 3 programs had some features recommended in the literature,2,31–33 but there was variation across sites in characteristics such as caseloads and case manager training. A recent review suggested that more intensive interventions (eg, more patient contacts, in person visits) and case manager training with use of protocols may result in better outcomes.2 However, our study of only 3 sites suggested that, on average, none of the case management programs were related to outcomes within the subsequent 12 months, even among programs that had multiple features recommended in the literature. Our evaluations allow each health system to learn from its own processes of delivering care5 and supports each health system in making changes to ensure the effectiveness of its programs.
Our findings also suggest that comparative effectiveness studies using observational data may be an important complement to existing smaller randomized studies of individual case management programs.15 Studies of individual case management interventions typically evaluate only a single program compared to usual care and often lack details about key elements of the intervention.2 Comparisons are limited due to program differences, inconsistent documentation, and lack of standardized evaluation. It is difficult to envision a large randomized study sufficiently powered to examine all possible combinations of relevant key factors. For interventions such as case management programs that are spreading rapidly despite a paucity of evidence, rigorous observational studies may be able to contribute more rapidly to the knowledge base.15,34 In this study, we were able to develop a standardized matching and analytic approach to evaluate case management programs at 2 of 3 sites; applying such an approach more broadly, coupled with data on program characteristics, would provide important information on the characteristics of successful programs. This future work could be enhanced through innovations, such as indices of fidelity to possible intervention core components, to identify the active ingredients of programs.35 In addition, rather than focusing on average effects, future research should consider evaluating heterogeneity in treatment effects36 that would accommodate different responsiveness to case management within population subgroups.
Our study has additional limitations. We only followed outcomes for 1 year after enrollment into the case management program. It has been suggested that it takes time to realize positive outcomes from case management in primary care, and that 12 months is too short to draw conclusions.32 In 1 study, negative results with respect to emergency visits at 12 months turned into positive results at 24 months.37 In addition, we were limited to evaluating case management programs in large health systems affiliated with academic medical centers. Academic medical centers may serve a different population than community practices, but each of our health systems participated in the Medicare ACO program, indicating that they had a strong base of primary care patients and sizable, employed primary care physician groups.38
CONCLUSION
In conclusion, we determined that the rapid evaluation of programs for high-need high-cost patients required the use of claims data to match cases to comparison patients. Observational studies of programs for high-need high-cost patients that do not use claims-based utilization in the matching process will face challenges in identifying appropriate comparison patients and in identifying the most appropriate baseline time period for the matched comparison patient. Partnering with learning health systems to understand and enhance care for high-need high-cost patients will require that PCORNet facilitate comprehensive and timely access to both EHR and health care claims data.
FUNDING
Research reported in this article was partially funded through a Patient-Centered Outcomes Research Institute (PCORI) Award (HSD-1603-35039; Principal Investigator: MAS). The views in this publication are solely the responsibility of the authors and do not necessarily represent the views of the PCORI, its Board of Governors or Methodology Committee. This project was also supported by the University of Wisconsin-Madison (UW) Health Innovation Program through the UW School of Medicine and Public Health Wisconsin Partnership Program, and the Community-Academic Partnerships core of the UW Institute for Clinical and Translational Research (ICTR) through the National Center for Advancing Translational Sciences (NCATS), grant UL1TR000427.
The funding sources had no role in the design and conduct of the study; collection, management, analysis and interpretation of the data; preparation, review, or approval of the manuscript; or the decision to submit the manuscript for publication.
AUTHOR CONTRIBUTIONS
Study concept and design: MAS, MSV, MY. Statistical analysis: MY, XW. Funding; administrative, technical, or material support; and study supervision: MAS. All authors contributed to: acquisition, analysis, or interpretation of data; drafting of manuscript; and critical revision of the manuscript for important intellectual content.
SUPPLEMENTARY MATERIAL
Supplementary material is available at Journal of the American Medical Informatics Association online.
ACKNOWLEDGMENTS
This work benefitted from the advice and comment of patient stakeholder partners Mari Pat Berry, MA, Nancy Davin and Aliaa Barakat, PhD.
Conflict of interest statement
None declared.
