


Abstract
To investigate the function and probable mechanism of Clostridium butyricum in the development of choledocholithiasis.
The lithogenic diet group and the lithogenic diet + C. butyricum group were used to develop the choledocholithiasis model. During the experiment, C. butyricum suspension was administered to the rats in the lithogenic diet + C. butyricum group. The findings demonstrated that the C. butyricum intervention decreased the Firmicutes/Bacteroidetes ratio in the colon of experimental animals given a lithogenic diet. The relative levels of Desulfovibrio (0.93%) and Streptococcus (0.38%) fell, whereas Lactobacillus (22.36%), Prevotella (14.09%), and bacteria that produce short-chain fatty acids increased. Finally, 68 distinct metabolic products were found based on nontargeted metabonomics, and 42 metabolic pathways associated to the various metabolites were enriched.
We found that C. butyricum decreased the development of choledocholithiasis. It keeps the equilibrium of the rat’s gut microbiome intact and lowers the danger of bacterial infections of the gastrointestinal and biliary systems. It is hypothesized that by controlling lipid metabolism, it may also have an impact on the development of cholelithiasis.
In the future, cholelithiasis could be successfully treated using Clostridium butyricum.
Introduction
Currently, cholelithiasis is a prevalent disease that poses a threat to human health. According to a survey, ∼20% of adults worldwide suffer from gallstones; in the United States, ∼20–25 million people suffer from cholelithiasis, accounting for 10%–15% of the adult population (Weerakoon et al. 2022). With the accelerated development of China’s economy and residents’ living standards, the incidence rate of cholelithiasis in China has also shown a year-by-year upward trend. The prevalence rate among those over 70 years of age is 11.2%, which is substantially higher than that of younger individuals (Zeng et al. 2012, Su et al. 2020). Generally, stones that form in the common bile duct are referred to collectively as primary choledocholithiasis. The origin of gallstone formation is extremely complicated. Gallstones can be caused by any factor that alters the concentration ratio of cholesterol, bile acid, and phospholipids and causes bile stasis. In addition to the abnormal anatomical structure of the biliary system, infection of the biliary system, foreign bodies in the biliary tract, slow gastrointestinal peristalsis, and metabolic diseases contribute to the formation of primary choledocholithiasis (Cai et al. 2017; Zhang and Ling 2021).
The intestinal microecology is one of the human body’s relatively large microecosystems. According to Jiang et al. (2015), the intestinal microflora is a relatively concentrated microbial community with complex biological diversity that plays a crucial role in human health. The intestinal flora and the immune system of the organism exist in a state of symbiosis from birth and are influenced by a number of complex factors, including genetics, environment, diet, and lifestyle. The intestinal flora and the organism form a reciprocal relationship in which each party influences the formation and development of the other (Nicholson et al. 2012). In recent years, numerous studies based on high-throughput sequencing technology (Wu et al. 2013, Shen et al. 2015, Kose et al. 2018) have not only confirmed the potential relationship between the intestinal flora and biliary flora but also provided strong evidence for the conclusion that bacteria play a major role in the formation of gallstones, ushering in a new phase in the study of the gallstone formation mechanism.
In previous research (Lyu et al. 2021), we discovered that the bacteria that produce short-chain fatty acids (SCFAs), such as Clostridium, Butyrivibrio, and Rothia, were substantially less prevalent in the bile samples of patients with choledocholithiasis compared to the control group. Wu et al. (2013) presented a similar perspective. Therefore, we infer that variations in the composition and abundance of bacteria that produce SCFAs in the human body may have a significant effect on the development of primary choledocholithiasis.
Clostridium butyricum is implicated in antibiotic-associated diarrhea (Ling et al. 2015), ulcerative colitis (Yasueda et al. 2016), irritable bowel syndrome (Zhao et al. 2019), and colorectal malignancies (Xiao et al. 2017). In the past, Japanese researchers have investigated the effect of C. butyricum on the formation of gallbladder stones (Hosomi et al. 1982, Takeda et al. 1983), revealing that C. butyricum promotes the secretion of bile acid and reduces the formation of gallstones in mice, although its precise mechanism has not been clarified. Few studies have been conducted on C. butyricum in the development of primary choledocholithiasis, and its effect on the development of choledocholithiasis is unclear.
In conclusion, we investigated the role and potential mechanism of C. butyricum in the development of primary choledocholithiasis and revealed a novel strategy to prevent and treat primary choledocholithiasis. Due to the distinct physiological and anatomical structure of rats (which lack gallbladders), we chose Sprague–Dawley rats as the experimental subjects. It is well known that the intestinal flora is closely related to the health of the host and can reflect the health of the host to some degree. In addition, the metabolites of microorganisms may be the determining factor in enhancing the health of the host. Therefore, we collected and studied the composition of the flora and the characteristics of the metabolome in fecal samples from experimental animals and provided strong evidence of the mechanism by which microbes influence the physiology and pathogenesis of the host for reference.
Materials and methods
Experimental animals
Beijing HFK Biotechnology Co., Ltd. (Beijing, China) was contacted to acquire SD female rodents. The rodents (15 in total) were between 7 and 8 weeks old, of SPF quality, and weighed ∼210 g.
Diet for the experimental animals
The Animal Experiment Center at the Second Hospital of Hebei Medical University supplied the standard, normal food. It was bought from Beijing Keao Xieli Feed Co., Ltd. (Beijing, China), and its basic materials include maize, soybean meal, fish meal, wheat flour, bran, salt, dicalcium phosphate, stone powder, different trace elements, amino acids, and other ingredients.
Beijing HFK Biotechnology Co., Ltd. (Beijing, China) provided the high-sugar, low-protein lithogenic diet (LD) for modeling. The following is the particular formula (Jin et al. 2021): maize flour 209.4, soybean flour, wheat flour 90.7, fish meal 63.6, bran 506.5, salt 10.0, yeast powder 10.0, lard 20.0, sucrose 30.0, cellulose 20.0, cholesterol 1.0, cholic acid 0.4, and casein 20.0 g kg−1.
Preparation of the C. butyricum suspension
The C. butyricum strain was obtained from the guangdong provincial microbial strain preservation center, GDMCC No.
1.676.
Instruments and equipment
A −80°C ultralow temperature freezer (Haier Company), biosafety cabinet (Shanghai Boxun Industrial Co., Ltd. Medical Equipment Factory), automatic high-pressure steam sterilizer (Japan ALP Company), precision analytical balance (Japan A&D Company), biochemical incubator (Shanghai Yuejin Medical Equipment Co., Ltd.), anaerobic culture system (Guangzhou Youde Company), Multiskan FC enzyme marker (Shanghai Thermo Fisher Instruments Co., Ltd.), turbidimeter (French Bio-merier Company), and high-speed freezing centrifuge (Thermo Company of the United States).
Preparation of bacterial suspension
Clostridium butyricum was retrieved from the −80°C refrigerator and inoculated onto an enhanced Brucella Agar plate. The anaerobic culture was conducted at 37°C for 48 hours. A single colony was selected and inoculated into 20 mL of BHI liquid medium. The culture was incubated under anaerobic conditions at a constant temperature of 37°C for 10 hours until the logarithmic phase of growth with a bacterial density of 0.5 at OD620. The culture was then centrifuged at 8873 × g for 3 minutes to collect the bacterial precipitates. The precipitates were washed with physiological saline and resuspended. The concentration of the experimental bacterial solution was adjusted to 1 × 10⁹ CFU mL−1 and placed on ice for later use.
Grouping and treatment of experimental animals
Fifteen SD rats were randomly split into three groups, with three animals per big cage assigned to the normal control group (NC), six animals to the LD modeling group, and six animals to the LD + C. butyricum suspension group (LD-CB). The Second Hospital of Hebei Medical University’s Scientific Research Ethics Committee approved the feeding procedures used on the animals. All of the animals in the experiments were housed in cages for the duration of the 12-hour light/dark cycle. The environment was kept at a comfortable 22°C and 65% relative humidity.
For two weeks, all of the experimental rats were given standard, normal food to help them adjust to their new surroundings. The experimental animal model was developed in week three of the experiment. For the LD and LD-CB groups, the usual food was swapped out for a LD that was heavy in sugar and low in protein. The rats in three groups were gavaged daily at the same time, beginning in the third week of the trial and continuing until the completion of the experiment. Two milliliters (mL) of a C. butyricum suspension (the bacterial suspension for gavage was made by fresh culture every day) was gavaged to the LD-CB group, whereas two milliliters (mL) of normal saline were gavaged to the other two groups. The experimental animals were given full access to water and fed either a regular diet or a high-sugar, low-protein LD during the modeling period. Over the course of 11 weeks, researchers monitored the animals’ weight, fur glossiness, activity levels, and deaths.
At the conclusion of the experiment, in the 13th week, new fecal samples were taken from all experimental rats, placed in a frozen tube, and frozen at −80°C before being analyzed. After being sedated with Zoletil 50, the rats were killed by exsanguination.
Analysis of the diversity composition spectrum of the microbial community
To summarize, an Omega Soil DNA Kit (D5625-01) (Omega Bio-Tek, Norcross, GA, USA) was used to first extract nucleic acids. Primers 338F (5′-barcode + ACTCCTACGGGGAGGCAGCA-3′) and 806R (5′-GACTACHVGGGTWTCTAAT-3′) were chosen as bacterial 16S rDNA V3-V4 region-specific primers for PCR amplification. In this case, we utilized Illumina’s TruSeq Nano DNA LT Library Prep Kit to assemble our sequencing library. Then, 2 × 250 bp double-ended sequencing was performed on an Illumina NovaSeq machine using the NovaSeq 6000 SP Reagent Kit (500 cycles). Each ASV feature sequence was compared and annotated using the Greengenes database, and the DADA2 approach was utilized to ensure the quality of the raw data. The NCBI Sequence Reading Archive (SRA) now has all the raw data from this investigation.
In order to determine the alpha diversity index, QIIME2 (2019.4) was used. Both the Kruskal–Wallis rank sum test and Duncan’s t test confirmed the statistical significance of the observed differences. To test for statistically significant differences across sets of data, we utilized a nonparametric test called ANOSIM (analysis of similarities) in conjunction with a nonparametric multidimensional scaling analysis based on the Bray–Curtis distance matrix.
Metabolomic analysis based on ultrahigh-performance liquid chromatography‒mass spectrometry (LC‒MS)
Personal Biotechnology Co., Ltd. (Shanghai, China) performed an untargeted metabolomics study. An UHPLC system (Vanquish, Thermo Fisher Scientific, USA) was used for the LC analysis. Separation was achieved using a 40°C column temperature and a 0.25 mL/min−1 flow rate with an ACQUITY UPLC® HSS T3 (150 × 2.1 mm, 1.8 m) (Waters, Milford, MA, USA). Each sample was injected with a volume of 2 μL (Zelena et al. 2009). Metabolites were identified using ESI ion source MS on a Q Exactive HF-X (Thermo Fisher Scientific, USA) (Want et al. 2013). Metabolite compositional heterogeneity is shown via orthogonal partial least squares discriminant analysis (OPLS-DA). Metabolites are confirmed by cross-referencing public databases. The selected differential metabolites’ functional pathways were enriched using MetaboAnalyst (www.metaboanalyst.ca).
Statistical analysis
SPSS 23 statistical software was used to conduct the statistical analysis of the data pertaining to the weight change in the experimental animals. The numerical values for the measurements were calculated as the mean + standard deviation. When comparing three or more groups, we used one-way analysis of variance, whereas when comparing two groups, we used the unpaired t test. Determine, using Fisher’s exact test, whether there is a significant difference in stone formation between the two groups. The significance level was set at P < 0.05.
Results
General condition of the experimental animals
The experimental rats in each group survived for the duration of the experiment. The LD and LD-CB groups of rats were much thinner; their hair was lustrous and readily shed; their activity level was normal; and their reflexes were somewhat slower. There were no noticeable differences in fur brightness, response speed, or activity level in the NC group.
Weight change
The weight of the experimental animals in each group rose at a comparable pace in the two weeks before the experiment. After the third week, experimental animals in the NC group gained weight much quicker than those in the other two groups, while experimental animals in the LD group gained weight faster than those in the LD-CB group (Fig. 1a). The body weight of experimental animals in the NC group was statistically significant after 13 weeks of feeding compared to the other two groups (Fig. 1b).
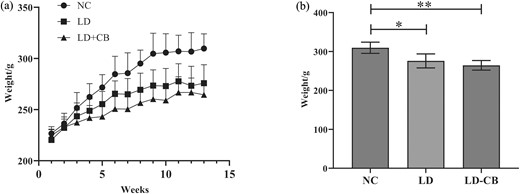
Rats used in experiments had weight fluctuations. (a) Variations in body weight among the experimental rats in each group over time. (b) After 13 weeks, the body weight of the experimental rats in each group (* P value < 0.05, * * P value < 0.01).
Stone formation in experimental animals
To detect stone development in the experimental animals in each group, we employed a color Doppler ultrasonography diagnostic tool. According to ultrasound scanning, there was obvious mass hyperechogenicity or point hyperechogenicity in the common bile duct in 4 rats in the LD group (Fig. 2a and b), with a stone formation rate of 66.67%. The other two groups of experimental animals had adequate sound transmission in the common bile duct, and no evident abnormalities were seen in the scans (Fig. 2c and d). However, no statistically significant difference in stone formation was seen between the LD and LD-CB groups (P value = 0.06 > 0.05).
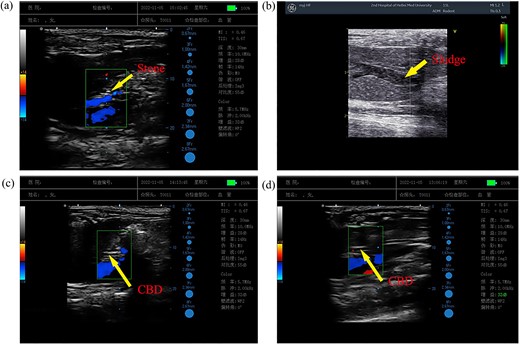
Lithogenesis in each group of experimentally raised rats. The arrow points to the powerful echo in the common bile duct (a). The arrow in (b) points to sporadic, dot-like, loud echoes in the common bile duct. (c, d) The common bile duct has good ultrasound transmission.
Butyricum changed the intestinal microbial composition of rats fed a LD
A total of 1 373 120 readings were produced from the feces of all experimental animals. After quality inspection, noise reduction, splicing, and chimaerism removal using the DADA2 approach, 791 046 high-quality sequences remained (see Table 1). The species makeup of the top 10 species in each experimental group was analyzed using stacked histograms at various taxonomic levels. The intestinal microbial community of rats in the NC group was mostly made up of Firmicutes (58.25%), Bacteroidetes (39.22%), and Proteobacteria (0.90%), according to Fig. 3a at the phylum level. The percentage of Firmicutes in the LD group rose from 58.25% to 63.87% in comparison to the NC group. With C. butyricum intervention, the percentage of Firmicutes in the LD-CB group was 58.15%. Additionally, the percentage of Bacteroidetes fell to 30.01% and 37.01%, respectively, in the LD group and LD-CB group of rats. The ratio of Firmicutes to Bacteroidetes (F/B) was then examined between each group, and it was discovered that the F/B ratio in the LD group was larger than that in the NC group, while the C. butyricum intervention decreased this difference (Fig. 3b). Lactobacillus made up a significant amount of the community composition in each of the three groups at the genus level (Fig. 3c), accounting for 17.69% in the NC group, 11.66% in the LD group, and 22.36% in the LD-CB group. Rats from the LD group had a comparatively low prevalence of the Prevotella community (12.19%) as compared to the other two groups. We observed that the percentage of Desulfovibrio in the LD group rose from 0.13% to 3.33% as compared to that in the NC group. Its abundance dropped to 0.93% after the C. butyricum intervention. The experiment’s findings also revealed that the C. butyricum intervention considerably reduced the quantity of Streptococcus in the colon of experimental rats in the LD-CB group (0.38%) as compared to that in the other two groups. Furthermore, as compared to the LD group, C. butyricum raised the relative abundances of bacteria that produce SCFAs, such as Clostridium, Phascolarctobacterium, and Coprococcus, while decreasing the abundance of Ruminococcus.
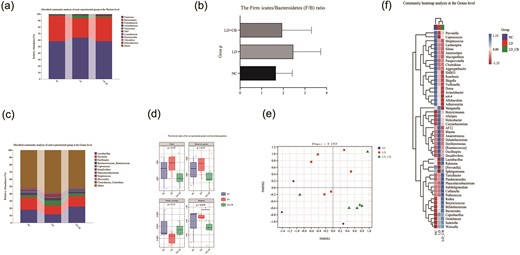
(a) Stacked histogram of the phylum-level microbial community analysis (see Supplementary data 3 for a complete statistical table of phylum-level microbial taxonomic units). (b) Evaluation of each group’s Firmicutes/Bacteroidetes (F/B) ratio. (c) Stacked histogram of the genus-level microbial community analysis (see Supplementary data 4 for a complete statistical table of microbial taxonomic units at the genus level). (d) The diversity index of the rat experimental group’s stool microbial population. (e) The distribution features of each set of samples are described using nonmetric multidimensional scaling analysis (NMDS). (f) Species composition analysis utilizing the heatmap.
Statistical table of the number of sequencing fecal samples from each experimental rat.
| Sample ID | Input | Filtered | Denoised | Merged | Nonchimaeric | Nonsingleton |
|---|---|---|---|---|---|---|
| NC1 | 98 015 | 88 286 | 85 528 | 76 652 | 54 307 | 53 187 |
| NC2 | 77 458 | 68 594 | 66 803 | 60 983 | 43 587 | 42 955 |
| NC3 | 89 676 | 80 971 | 77 845 | 66 251 | 50 205 | 48 960 |
| LD1 | 93 574 | 83 291 | 80 724 | 70 757 | 53 708 | 52 615 |
| LD2 | 95 251 | 86 221 | 83 411 | 72 884 | 54 959 | 53 942 |
| LD3 | 95 349 | 86 351 | 83 839 | 74 091 | 55 714 | 54 842 |
| LD4 | 96 052 | 86 558 | 83 825 | 72 717 | 56 079 | 54 975 |
| LD5 | 89 373 | 79 905 | 77 797 | 70 139 | 53 499 | 52 678 |
| LD6 | 89 313 | 80 511 | 77 796 | 67 681 | 49 094 | 48 034 |
| LD_CB1 | 96 610 | 85 643 | 83 619 | 77 032 | 54 670 | 53 677 |
| LD_CB2 | 91 770 | 81 175 | 79 276 | 72 606 | 55 905 | 55 197 |
| LD_CB3 | 96 128 | 84 092 | 82 292 | 76 041 | 60 274 | 59 547 |
| LD_CB4 | 92 630 | 83 102 | 80 358 | 70 484 | 51 329 | 50 166 |
| LD_CB5 | 81 960 | 71 052 | 69 018 | 62 314 | 48 620 | 47 819 |
| LD_CB6 | 89 961 | 77 046 | 74 949 | 67 525 | 49 096 | 48 024 |
Figure 3d displays the diversity index of the microbial communities found in the feces of the three groups of experimental rats. The sequencing data are enough for this research since Good's coverage index for the three groups is near or >99%. The calculated Chao1 index and the observed species index did not significantly vary across the various groups, suggesting that the three groups did not differ significantly in terms of the abundance of intestinal microbial communities. In experimental rats fed a LD, the Simpson diversity index of the LD-CB group was significantly lower than that of the LD group (* P value < 0.05), indicating that C. butyricum has a significant influence on the composition of the intestinal microbial community. Additionally, the abundance of the flora associated with C. butyricum has increased.
The two-dimensional sequencing plot (Fig. 3e) illustrates how the three groups’ microbial communities vary from one another. The three groups of microbial communities were statistically verified using ANOSIM, and the findings revealed that there were substantial differences between the groups (Table 2). The heatmap (Fig. 3f) displays the average abundance of the top 50 genera in each of the three groups of fecal microbial communities. We can plainly observe that the LD group has a high concentration of potentially hazardous bacteria, including Helicobacter, Corynebacterium, and Desulfovibrio, whereas the LD-CB group has a high concentration of probiotics strongly associated with host health. Most bacteria can also create SCFAs.
Intergroup differences obtained by performing statistical analysis.
| Group 1 | Group 2 | Sample size | Permutations | R | P value | q value |
|---|---|---|---|---|---|---|
| all | - | 15 | 999 | 0.456 229 | 0.003 | - |
| NC | LD | 9 | 999 | 0.62 963 | 0.014 | 0.027 |
| NC | LD_CB | 9 | 999 | 0.54 321 | 0.032 | 0.032 |
| LD | LD_CB | 12 | 999 | 0.403 704 | 0.018 | 0.027 |
Effect of Clostridium butyricum on the intestinal metabolic group of rats fed a LD
The difference in fecal metabolite composition between the LD and LD-CB groups of experimental animals was identified using OPLS-DA analysis (Fig. 4a and b). According to the figure, C. butyricum has a significant impact on the intestinal metabolites of rats fed a LD because the metabolites in each sample from the two groups are relatively aggregated (almost all within the 95% confidence ellipse), while the metabolites of the samples between the two groups are significantly different. The differential metabolites were further screened in accordance with the predetermined VIP threshold (>1) and P value (0.05) in the statistical test, and the heatmaps in Fig. 4c and d show the results of the hierarchical clustering analysis of the first-level differential metabolites screened. Finally, 68 metabolites with significant variations were found in the feces of the experimental animals in the LD and LD-CB groups. These metabolites largely included amino acids, fatty acids, organic acids, carboxylic acid derivatives, lipids, and certain medicinal ingredients. In Supplementary data 1, a total of 68 substantially altered metabolites are noted.
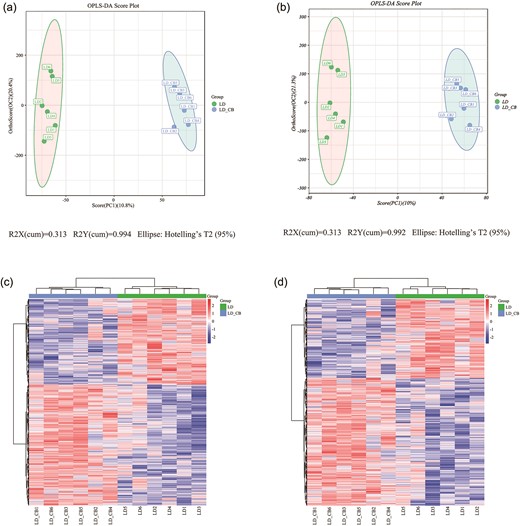
(a, b) A graph showing the OPLS-DA score in the positive (a) and negative (b) ionization modes. (c, d) The heatmap produced by hierarchical clustering of several metabolites in the positive (c) and negative (d) ionization modes.
The related metabolic pathways of the various compounds found in the feces of the LD and LD-CB groups were further examined using the MetPA database. The bubble diagram in Fig. 5 displays the 42 metabolic pathways that were enriched and connected to the various metabolites in the two groups, including steroid biosynthesis, taurine and hypotaurine metabolism, and cholesterol metabolism (details of the 42 enriched metabolic pathways are listed in Supplementary data 2).
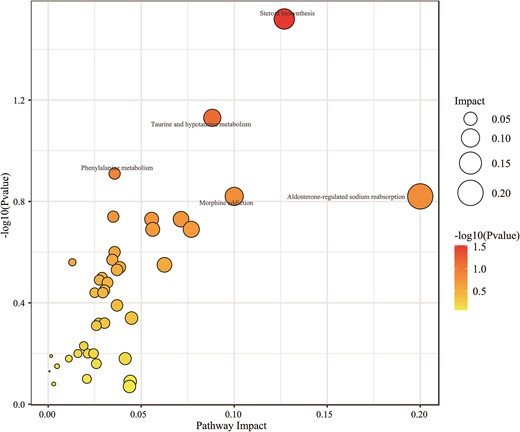
A bubble diagram illustrating the metabolic pathway-influencing variables.
Discussion
One of the most prevalent and often occurring illnesses of the digestive tract in clinical practice, cholelithiasis, is a widespread issue. Researchers from all around the globe have been paying attention to basic and clinical studies on its genesis. There is mounting evidence that bacteria are critically crucial in the development of gallstones. While there has been relatively little study on the origins of common bile duct stones, previous studies have mostly explored the pathophysiology of gallbladder stones. The findings of this research demonstrated that in experimental rats given a LD, C. butyricum decreased the development of choledocholithiasis. To investigate its probable mechanism, we focused on C. butyricum’s impact on the metabolome and gut microbiota of experimental animals.
A low-protein diet can cause pathological injury to the liver of rodents, reduce the ability of the biliary system to recuperate, and diminish the liver's ability to use cholesterol to synthesize bile acid, leading to an aberrant bile acid metabolism. At this time, the biliary system is more vulnerable to infection by pathogenic bacteria, and excessive consumption of exogenous cholesterol, fat, cholic acid, and sugar increases the burden on the liver and promotes gallstone formation. We confirmed that feeding rats a high-sugar and low-protein LD can successfully generate an animal model of primary choledocholithiasis; however, in this experiment, the lithogenic rate of experimental rats in the LD group (66.67%) is somewhat lower than in previous studies (70%–85%) (Jin et al. 2021). We believe that the limited number of experimental animals in the group is the primary cause of this phenomenon; this is also a limitation of our current investigation. After 13 weeks of feeding, we discovered that the body weight changes of experimental rats in the NC group were significantly different from those of the other two groups (Fig. 1), indicating that the low-protein LD had a significant effect on the nutritional status of experimental animals in the LD and LD-CB groups. In addition, the weight of animals in the LD-CB group was typically lower than that of animals in the LD group. Previous research (Shang et al. 2016) has demonstrated that C. butyricum can substantially reduce adiposity and insulin resistance in rodents fed a high-fat diet. This effect of C. butyricum appears to be an adequate explanation for this occurrence.
Rats employed in experiments had their feces sampled, and the makeup of the microbial community was examined using 16S rRNA gene sequencing techniques. The findings demonstrated that in rats given a LD, C. butyricum had a significant impact on the composition of intestinal bacteria. We discovered that the LD group had a larger F/B ratio than the NC group did. In earlier investigations (Islam et al. 2011, Zheng et al. 2017), experimental animals given a high-fat diet had comparable intestinal microbial features to those of the rats in the LD group. According to earlier research (Ley et al. 2006, Gomes et al. 2018), the prevalence of these two bacteria in the gut may have a connection to obesity. Additionally, the C. butyricum intervention boosted the proportions of Lactobacillus and Prevotella while decreasing the relative abundances of Desulfovibrio and Streptococcus in the gut. The gut flora’s equilibrium is maintained by Lactobacillus, which also boosts the body’s resilience and immunity. According to earlier research (Wang et al. 2012), feeding experimental rats a diet containing Lactobacilli enhanced the relative content of SCFAs like propionic acid and butyric acid in their feces and lowered the level of blood cholesterol. According to Tett et al. (2021), Prevotella is often regarded as a kind of bacteria that is connected to a plant-based diet and functions as a “probiotic” in the human body. Desulfovibrio may cause gallstone development in gallstone-resistant mice (AKR/J) by interfering with the metabolism of bile acid and cholesterol, according to recent research on human fecal microbiota transplantation (HuFMT) (Hu et al. 2022). A significant zoonotic pathogen is Streptococcus. Streptococcus infection in humans may result in meningitis, septicemia, and even fatalities (Lannes-Costa et al. 2021). Similar to this, C. butyricum boosted the relative amounts of the majority of bacteria that produce SCFAs. SCFAs have a significant influence on human health (Yao et al. 2022). Butyric acid, a SCFA, has also been shown to affect blood cholesterol content and bile acid metabolism (Ye et al. 2021). According to research, gut bacteria entering the biliary system are the primary cause of biliary tract infections (Ye et al. 2016). In general, in rats given a LD, C. butyricum preserved the equilibrium of the intestinal microecology. These changes in the gut microbiota have a significant and beneficial impact on preventing the development of gallstones by lowering the risk of bacterial infections in the biliary and intestinal systems.
Using a metabonomic approach based on nontargeted LC–MS, fecal samples from the LD and LD-CB groups of experimental animals were analyzed to further elucidate the particular intestinal alterations in experimental rats brought on by C. butyricum. The findings demonstrated that experimental rats’ fecal metabolites had less 7-dehydrocholesterol as a consequence of C. butyricum. The biosynthetic precursor of both cholesterol and vitamin D3, 7-dehydrocholesterol, was reduced, preventing the continued production of cholesterol. The relative concentrations of lanosterin and 4a-carboxy-4b-methyl-5a-cholesterol-8,24-diene-3b-ol in fecal metabolites were also elevated by C. butyricum. They are zymosterol’s synthetic precursors. Sterol may contribute to lower blood cholesterol levels, according to studies (Blanco-Morales et al. 2022). Similar to this, C. butyricum raised the relative amount of taurocholic acid, which was enriched in a number of metabolic pathways, including cholesterol metabolism, taurine and hypotaurine metabolism, bile secretion, and primary bile acid biosynthesis. As a conjugated bile acid, taurocholic acid possesses anti-inflammatory and lipid metabolism-regulating properties. According to the rise in its concentration, C. butyricum encourages bile acid excretion in the colon of experimental rats, which has an impact on the metabolism of cholesterol. Therefore, we hypothesize that by controlling lipid metabolism, C. butyricum may also influence the development of choledocholithiasis in experimental rats. In the intestinal metabolites of experimental rats, C. butyricum raised the relative concentration of eicosapentaenoic acid(EPA)-d5. One of the numerous omega-3 fatty acids often used by the human body is EPA. According to studies (Zhang et al. 2019; von Schacky 2021), EPA serves a beneficial physiological effect in controlling blood cholesterol levels, avoiding cardiovascular and cerebrovascular illnesses, and enhancing brain function.
The following are some additional limitations of this research, in addition to the limited number of samples in each group of experimental animals: (1) because all of the experimental animals we utilized were female, it cannot be ruled out that gender had any impact on the outcomes of the experiment. (2) There are certain restrictions on the use of ultrasonic diagnostic tools to assess the stone development in each group of experimental animals, and this approach is somewhat influenced by the operator’s subjective considerations. (3) We attempted to remove stones from rats’ common bile ducts for analysis, but we were unsuccessful, so we were unable to do so. Future research needs to make improvements in these areas.
In conclusion, our study’s findings demonstrate that C. butyricum lowers the risk of bacterial infections in the biliary and intestinal tracts as well as the development of choledocholithiasis in experimental rats fed a LD. Although the precise mechanism of C. butyricum is still unknown, it is hypothesized that it may influence the development of choledocholithiasis by regulating lipid metabolism. Future treatments for gallstones may be successful when using C. butyricum.
Abbreviations
NC: normal control; LD: lithogenic diet; CB: Clostridium butyricum; LC‒MS: liquid chromatography‒mass spectrometry; OPLS-DA: orthogonal partial least squares discriminant analysis; ANOSIM: analysis of similarities; HuFMT: human fecal microbiota transplantation; NMDS: nonmetric multidimensional scale analysis.
Acknowledgement
This work was supported by the Health Innovation Project of Hebei Provincial Science and Technology Department (22377734D).
Conflict of interest
No conflict of interest declared.
Author contributions
Guofu Li (Methodology, Writing—original draft), Tingting Yu (Methodology), Haiming Du (Methodology), Lichao Zhang (Methodology), Xiaoxuan Liu (Methodology), and Senlin Hou (Project administration, Writing—review & editing).
Ethics approval and consent to participate
Ethical approval for this study was obtained from the Research Ethics Committee of the Second Hospital of Hebei Medical University (Approval Letter No.: 2022-AE260). All experiments were performed in accordance with relevant guidelines and regulations. All methods are reported in accordance with ARRIVE guidelines (https://arriveguidelines.org) for the reporting of animal experiments.
Consent for publication
All authors have read and approved the final manuscript. We further confirm that the order of authors listed in the manuscript has been approved by all of us.
Data Availability
Raw sequences are available from Sequence Read Archive (SRA) with the Bioproject accession number PRJNA925122 (https://www.ncbi.nlm.nih.gov/sra/PRJNA925122). The data used and/or analyzed during the current study are available from the corresponding author upon reasonable request.
