


Abstract
To develop a method that is able to determine the microbial reduction in different dishwasher cleaning cycles and differentiate between different program parameters used.
Stainless steel biomonitors were contaminated with Micrococcus luteus or Entereococcus faecium and cleaned in a specially programmed household dishwasher with different cleaning temperatures and durations. No detergent, bleach‐free detergent or detergent containing activated oxygen bleach was used. The logarithmic reduction (LR) was determined. The microbial reduction depended on the cleaning temperature, the duration of the cleaning cycles and the detergent type used. LR increased with higher temperatures, longer cleaning cycles and use of detergent.
The factors cleaning cycle temperature, cleaning cycle duration, final rinsing temperature and the use of detergent all contributed to the reduction of test‐strains in dishwasher cycles. A combination of longer dishwashing cycles and increased temperatures resulted in LRmax of the microbial load.
Cycles in domestic appliances are very diverse; therefore a standardized method to determine their ability to reduce the microbial load is of great use. The method described here is able to demonstrate the reductions achieved by dishwashing cycles with different parameters and might help to find the necessary balance between energy saving and an acceptable level of hygiene.
Introduction
The number of German households that own a dishwasher has risen from 44·1% in 1998 to 71·9% in 2018 (Statistisches Bundesamt 36). Dishwashers are efficient in the removal of soil (Peart and Johnston 26), bacteria and food particles (Ward and Dack 39; Rahman 28). Automated dishwashing has been proven to be more efficient than manual dishwashing (Blackmore et al. 3; Stamminger 34; Richter 30; Vivian et al. 38) and consumers would like to use energy‐saving dishwasher cycles, but do not use cycles with durations of more than 2 h regularly (Hook et al. 19; Stamminger et al. 35).
There have been reports on the survival of micro‐organisms in automated dishwashing (Johansson et al. 21; Wernersson et al. 40) and reports of microbial communities in dishwashers for household use (Zalar et al. 41; Babič et al. 1; Nix et al. 24; Raghupathi et al. 27; Zupančič et al. 42), but so far, no cases of infection via dishwashers have been reported. It is also known, that hygiene measures like high temperature cycles help to reduce the microbial count in the sump water of dishwashers (Brands and Bockmühl 4).
There are standards to determine the cleaning performance and energy use of dishwashers, for example, IEC 60436 (International Electrotechnical Commission 20) and national standards exist that regulate the minimum logarithmic reduction of 5 in commercial use dishwashers, for example, DIN 10512 (Deutsches Institut für Normung e. V. 10). The American National Standards Institute has recently released NSF/ANSI 184‐2019 (“Dishwashers ‐ NSF International,” 15; “NSF/ANSI 184‐25–Residential Dishwashers,” 2019), which contains sanitation requirements for residential dishwashers if they want to be certified as special sanitizing equipment that can be used by, for example, immunocompromised persons. This standard requires a logarithmic reduction of 5 for the microbial load and a final rinsing temperature of 150°F (or 65°C) to be certified.
However, this standard is not a requirement to pass for each appliance und until now, there is no European standard for the microbial reduction in appliances for household use.
The current study tries to deliver a method to measure the reduction achieved by a certain dishwasher cycle or dishwasher rather than fixing a certain minimum microbiological reduction for household dishwashers. Thus, it will provide a possibility to directly compare the hygienic performance of certain cleaning cycles and to identify possibly critical cycles. As a consequence, the findings can be used to find a balance between the needs for lower energy and water consumptions and the necessity for a certain level of hygiene.
Material and methods
Artificially contaminated biomonitors were cleaned together with a dishwasher load according to IEC 60436 Ed.4 (International Electrotechnical Commission 20) to determine the influence of different factors in the microbial reduction in dishwashers. The load was modified as follows to give extra space for the biomonitors and holders used: the number of melamine plates as well as the number of soup plates was reduced from six to three. For the detailed load see Figs S1–S3. The load was not contaminated according to IEC60436, instead, 100 g frozen ballast soil, which was placed inside a mug, was used. The ballast soil was prepared from the soiling agents defined in DIN EN 50242 (Deutsches Institut für Normung e. V. 13) except for tea and milk. Those are normally burnt into the tableware to test the cleaning performance of the device. As in our study the ballast is not burnt into the tableware, tea and milk would add extra volume to the ballast load. This could influence the log‐reduction and thus, tea and milk were omitted.
For each cleaning cycle, either no detergent (ND), 18·2 g reference detergent D without bleaching activity (DT) or 20 g of reference detergent D containing activated oxygen bleach (AOB), rinse aid III and salt according to IEC 60436 (International Electrotechnical Commission 20) were used. Rinse aid and salt were automatically dosed by the machine.
The biomonitors were placed on holders made of stainless steel, which were attached to dinner plates (see Fig. S4). They were cleaned together with the load using different cleaning temperatures (45, 50, 55, 60, 65 and 75°C) and different durations of the main cleaning cycle (5, 10, 15, 45 and 90 min).
The temperature profile of each run was recorded using two independent temperature loggers (TELID®311; Microsensys GmbH, Erfurt, Germany) placed in the cutlery rack (see Fig. S1). Additionally, the water consumption in each run was recorded.
The microbial load of the biomonitors before and after the cleaning cycle was determined and used to evaluate the microbial effectiveness of the cleaning process.
Dishwasher and cleaning cycles
Tests were performed in an automated dishwasher (GSL‐2, Miele & Cie. KG, Gütersloh), which was specially programmed for the tests by the manufacturer. All cycles contained a main cleaning phase followed by an intermediate and a final rinsing cycle. Depending on the experiments, either the temperature in the final rinsing cycle was set to 50 °C with varying temperature settings in the main cleaning cycle (45–75°C) or the main cleaning cycle temperature of 45 or 55°C was combined with final rinsing cycle temperatures of 35, 50 or 70°C. The temperature ranges were chosen, as different dishwasher cycles from appliances on the market are run with these temperatures. Figure 1 shows the temperature profile for a cleaning cycle with the main cleaning duration set to 15 min, the cleaning temperature set to 65 °C and the final rinsing temperature set to 50°C. The water temperature is measured by the dishwasher and controlled by temperature loggers placed in the cutlery drawer of the appliance.

Temperature profile of a cleaning program showing the different phases from water inlet (a), heating phase (b), main cleaning cycle (c), water intake (d), first rinsing cycle (e), water intake (f), heating phase for final rinse (g), final rinsing cycle (h) and drying period (i).
Preparation of biomonitors
Stainless steel biomonitors according to DIN EN 10088‐3 (Deutsches Institut für Normung e. V. 12) and DIN 10512 (Deutsches Institut für Normung e. V. 10) as shown in Fig. 2 were used.
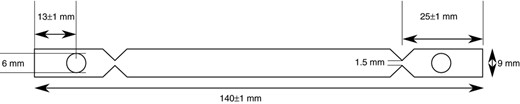
Overview of the biomonitor made from austenitic steel (1·4301). The front has unilateral longitudinal grain with granulation 80.
The biomonitors were cleaned in an ultrasound bath (USC900TH; VWR, Darmstadt, Germany), dried and sterilized in an autoclave (Systec VX‐65; Systec GmbH, Linden, Germany). The middle section was inoculated with 100 µl inoculation solution containing different bacteria on the grained side reaching an initial count of 109 colony forming units (CFU) per biomonitor. The solution was spread evenly on the surface using a sterile inoculation loop (Sarstedt, Nümbrecht, Germany). The biomonitors were dried at 22°C and 70% relative humidity for 4 h in a constant climate chamber (HPP110, Memmert GmbH+Co. KG, Schwabach, Germany). After drying, the biomonitors were individually stored in closed test tubes and kept at 5 °C until use. Pre‐tests have shown that the initial microbial counts remain stable for at least 3 weeks after preparation when stored at 5 °C and all biomonitors have been used during this period.
Preparation of bacterial cultures
Lyophilized seed cultures of Micrococcus luteus DSM 1790, M. luteus DSM 20030 and Enterococcus faecium DSM 2146 were obtained from the German Collection of Micro‐organisms (DSMZ; Braunschweig, Germany). They were rehydrated for 30 min in 0·5 ml tryptic soy broth (TSB, Merck KGaA, Darmstadt, Germany). For M. luteus DSM 28269, an actively growing culture on tryptic soy agar (TSA, Merck KGaA) was received from the University of Bonn, who first isolated the micro‐organism from dishwashers (Berger et al. 2).
The rehydrated seed culture was split: 100 µl were transferred to a 100 ml Erlenmeyer flask containing 10 ml TSB and 100 µl were transferred onto a TSA plate. The liquid culture was incubated for 24 h at 37°C in an incubated shaker (Thermo Scientific MaxQ* 8000) set to 150 rev min−1. From this overnight culture, portions of 250 µl were mixed with 250 µl of 80% glycerol in screw‐cap tubes (Sarstedt) and stored at −80 °C.
From the surface culture on TSA, second and third subcultures were prepared by transferring a bacterial colony to a new agar plate with a sterile inoculation loop. The third subculture was used for the preparation of biomonitors. In most tests, M. luteus DSM 1790 and E. faecium were used. Only for the influence of the final rinsing temperature, the three different strains of M. luteus were used.
Preparation of the soil matrix BAMS
To evaluate the microbial reduction in the dishwasher, bacteria were embedded in a soil matrix containing 0·6% bovine serum albumin (BSA, A1391.0100; AppliChem GmbH, Darmstadt, Germany), 1% mucin (8494.1, Carl Roth GmbH+Co. KG, Karlsruhe, Germany) and 3% corn starch (9444·1, Carl Roth GmbH+Co. KG), used in DIN 10512 (Deutsches Institut für Normung e. V. 10), which will be referred to as BAMS. According to DIN ISO/TS 15883‐5:2006 (Deutsches Institut für Normung e. V. 8), for 30 ml BAMS, 0·3 g mucin were dissolved in 20 ml sterile water and heated to 50–60°C under continuous stirring. To this end, 0·18 g BSA was added. The solution was cooled to room temperature under continuous stirring. At the same time, 8 ml sterile water was heated to the boiling point. Corn starch (0·9 g) was dissolved in 2 ml sterile water and mixed with the boiling water. The solution was heated and stirred until it became visibly more viscous. The heat was then reduced and the solution was cooled to room temperature under continuous stirring. When both solutions had reached room temperature, they were mixed for a total of 30 ml BAMS.
Preparation of the inoculation solution
Three TSA plates containing the third bacterial subculture were rinsed each with 10 ml sterile 0·9% NaCl‐solution. The suspension was centrifuged for 5 min at 4696 g. The supernatant was discarded and the pellet was resuspended in 10 ml BAMS. Each of the prepared biomonitors contained a single strain of bacteria embedded in the soil matrix.
Microbial reduction
The microbial reduction was determined by comparison of the microbial load of the biomonitors before and after cleaning in the dishwasher.
All shown temperature–time combinations were tested in three independent runs and three biomonitors for each bacterial strain were included in each run. The means and SDs were calculated.
The logarithmic reductions presented in this paper have been normalized to compensate for subtle differences in the initial counts as this would have resulted in an uneven representation of complete reductions. For this normalization, the measured reductions have been multiplied with a factor that equals the factor between the actual initial count in each tested cycle and the mean initial count.
Statistical analysis
After acquisition of the data, the results were submitted to Kruskal–Wallis tests to detect possible differences in the medians of the tested groups (Kruskal and Wallis 23) as most of the data were not normally distributed. In case one or more significant differences were found amongst the groups, Dunn's multiple comparisons test (Dunn 16) was performed to identify which of the groups differed from the rest. Two‐way anova was used to detect differences among the medians of the tested groups when the data followed Gaussian distribution. In these cases, either Sidak's multiple comparisons test (Šidák 32) or Tukey's multiple comparisons test (Tukey 37) was performed to identify the differences between the single groups. When all groups' means were compared, Tukey's test was used, if not all groups' means were compared, Sidak's multiple comparison test was used.
Four parameter logistic regression
As simple models of linear regression might not be adequate for biological systems, the four parameter logistic regression (4PL) model was used instead. This model is commonly used for dose–response assays, but as the different temperatures can be viewed as different doses of the parameter temperature, this model should fit well (Dinse 14).
Linear regression
Results
Prior to the actual tests, the effect of the soil matrix on the extraction as well as the reproducibility of the test results was determined. To achieve this aim, different preliminary test to identify the best soil matrix and the ideal extraction parameters have been performed. The achieved results with the chosen setting have been significantly higher compared to the other tested settings (data not shown). The parameters described in the materials and methods section have proven to give the best recovery of the micro‐organisms from the biomonitors during the extraction.
Initial microbial load of the biomonitors
On each experimental day, biomonitors for each bacterial strain were tested for their initial microbial load as described under "Microbial reduction". The initial counts for all tested biomonitors were within the same logarithmic step for the individual bacterial strain, reaching 109 CFU per biomonitors for both E. faecium and the M. luteus strains and remained constant during storage of the biomonitors.
Influence of the main cleaning cycle temperature on the microbial reduction
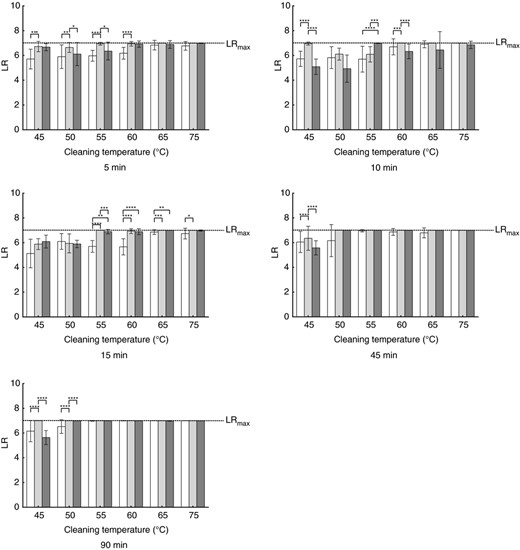
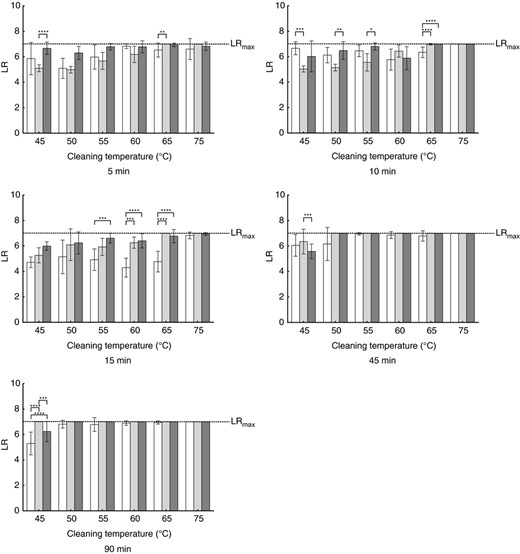
The logarithmic reductions (LR) achieved in the different experimental settings can be seen in Fig. 3 for E. faecium and in Fig. 4 for M. luteus DSM 1790. In general, for both micro‐organisms, the log‐reduction increases with higher cleaning temperatures, independent of the detergent used. For the shorter cycles of 5 and 10 min, the reduction becomes higher at 60°C or above. Detailed P‐values are given in Table S1 for E. faecium and in Table S2 for M. luteus DSM 1790.
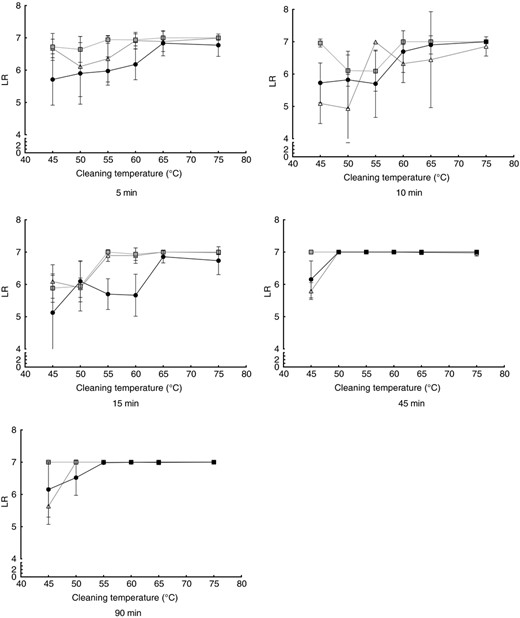
Influence of the cleaning temperature in the microbial reduction of Enterococcus faecium. Cleaning cycles without detergent (black dots), with bleach‐free detergent (grey squares) and AOB‐containing detergent (white triangles) are shown for cleaning durations of 5–90 min. All data points are means from nine independent biomonitors. Lines are for visualization only.
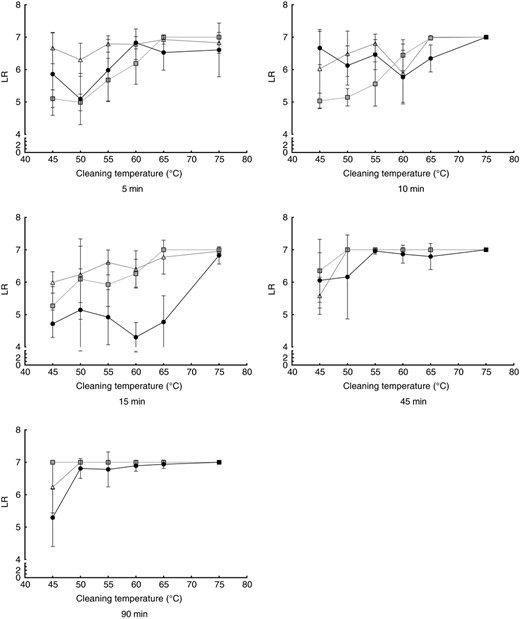
Influence of the cleaning temperature in the microbial reduction of Micrococcus luteus DSM 1790. Cleaning cycles without detergent (black dots), with bleach‐free detergent (grey squares) and AOB‐containing detergent (white triangles) are shown for cleaning durations of 5–90 min. All data points are means from nine independent biomonitors. Lines are for visualization only.
Influence of the main cleaning cycle duration on the microbial reduction
The data shown in Figs 3 and 4 have been reorganized. This is essential to focus on the duration of the cleaning cycle rather than the cleaning temperature as before.
Results for E. faecium are presented in Fig. 5, those for M. luteus DSM 1790 in Fig. 6 and within the figure are sorted according to the detergent type used.
Influence of the cleaning cycle duration on the microbial reduction of Enterococcus faecium. Each bar represents the mean with standard deviation calculated from nine biomonitors. Values are shown for 45°C (white bars), 50°C (horizontally striped bars), 55°C (light grey bars), 60°C (white bars with black dots), 65°C (dark grey bars) and 75°C (diagonally striped bars).
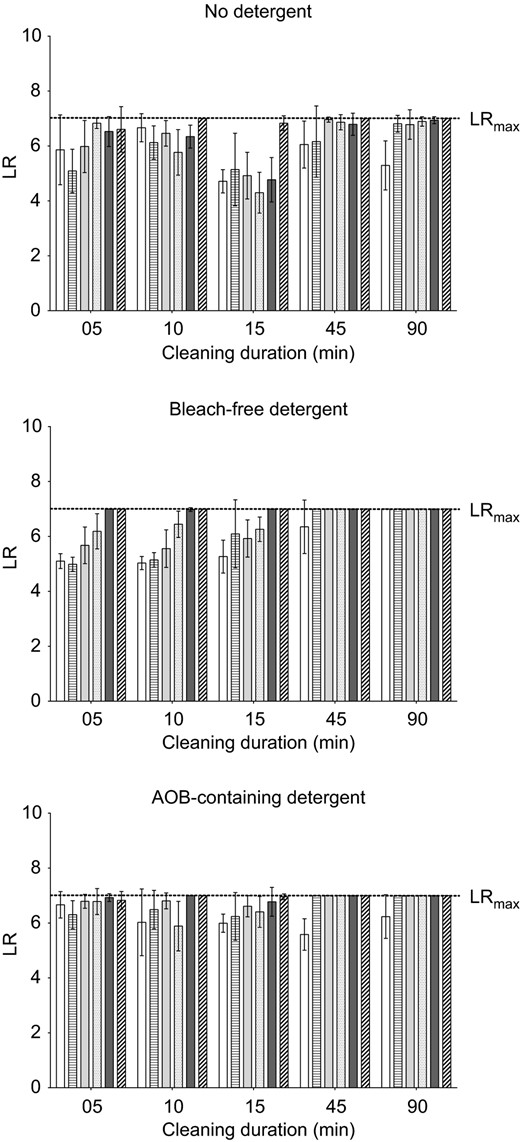
Influence of the cleaning cycle duration on the microbial reduction of Micrococcus luteus DSM 1790. Each bar represents the mean with SD calculated from nine biomonitors. Values are shown for 45°C (white bars), 50°C (horizontally striped bars), 55°C (light grey bars), 60°C (white bars with black dots), 65°C (dark grey bars) and 75°C (diagonally striped bars).
Detailed significance levels are given in Table S3 for E. faecium and Table S4 for M. luteus DSM 1790.
In runs without detergent, the duration of the cleaning cycle has little effect on the log‐reduction until 15 min for both micro‐organisms. Only when the cleaning cycles are extended to 45 or 90 min, the log‐reduction increases. For E. faecium it reaches LRmax for the highest temperatures, while the log‐reductions of M. luteus DSM 1790 rise, but do only reach LRmax at the highest tested temperature of 75°C.
When bleach‐free detergent is used, E. faecium reaches LRmax with all tested temperatures when cycles durations of 45 and 90 min are used. In the shorter cycles, of 5, 10 and 15 min, LRmax is reached for the higher temperatures of 65 and 75°C and nearly reached for 60°C. The influence of the duration becomes clearly visible for the temperature of 55°C. While the log‐reduction shows values of 6·9 for 5 min and 6·1 for 10 min with high SDs for both temperatures, LRmax is reached when the duration of the cleaning cycle is extended to 15 min. For the lowest tested temperatures of 45 and 50 C extension of the cleaning duration does not result in higher log‐reductions.
For M. luteus DSM 1790, the use of bleach‐free detergent does increase the log‐reductions in cycles with durations of 45 and 90 min to reach LRmax, except for a cleaning temperature of 45 °C. For the remaining cleaning temperatures, the increase of the duration from 5 to 10 min or 15 min does not result in an increase of the logarithmic reduction in cycles with bleach‐free detergent.
When AOB‐containing detergent is used, the log‐reduction of E. faecium is increased in runs with a cleaning temperature of 50°C when the duration is increased to 45 or 90 min. This increase shows no effect with a cleaning temperature of 45°C. For M. luteus DSM 1790, the log‐reduction increases for all temperatures except 45°C when the duration of the cleaning cycle is increased from 15 to 45 min.
Influence of the detergent on the microbial reduction
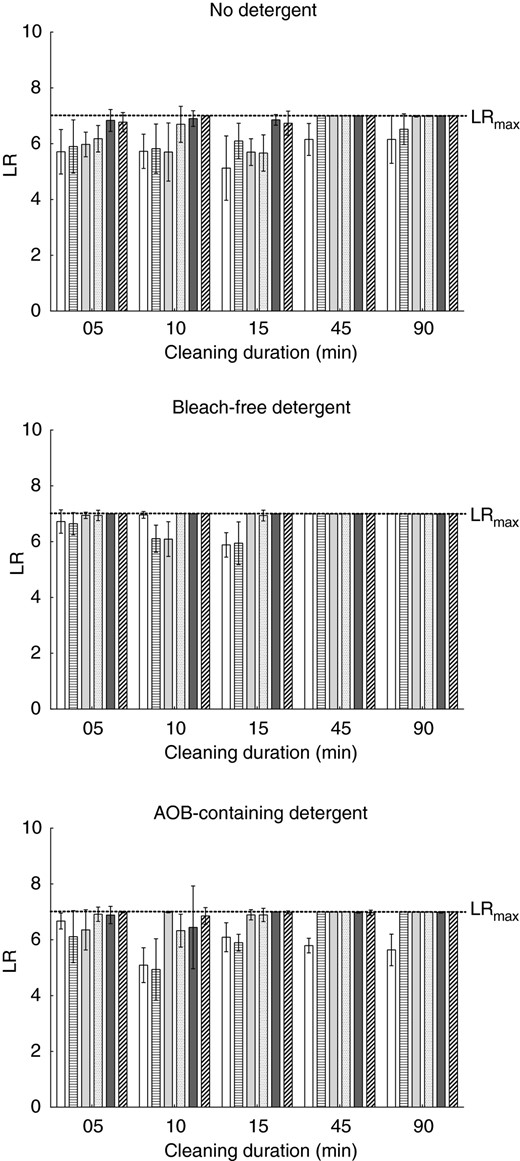
The data presented before have again been rearranged to directly visualize the influence of the detergent type on the microbial reduction. Data for E. faecium are shown in Fig. 7, those for M. luteus DSM 1790 in Fig. 8. Both figures show data for cycles without detergent (white bars), cycles with bleach‐free detergent (light grey bars) and cycles with AOB‐containing detergent (dark grey bars). Detailed significance levels are given in Table S5 for E. faecium and Table S6 for M. luteus DSM 1790.
Influence of the detergent on the microbial reduction of Enterococcus faecium. Each bar represents the mean with SD calculated from nine biomonitors. Values are shown for no detergent (white bars), bleach‐free detergent (light grey bars) and AOB‐containing detergent (dark grey bars) for the different cleaning durations and cleaning temperatures. Statistically significant differences are marked with asterisks (*P ≤ 0·05, **P ≤ 0·01, ***P ≤ 0·001, ****P ≤ 0·0001). Detailed P‐values are given in Table S5.
Influence of the detergent on the microbial reduction of Micrococcus luteus DSM 1790. Each bar represents the mean with SD calculated from nine biomonitors. Values are shown for no detergent (white bars), bleach‐free detergent (light grey bars) and AOB‐containing detergent (dark grey bars) for the different cleaning durations and cleaning temperatures. Statistically significant differences are marked with asterisks (*P ≤ 0·05, **P ≤ 0·01, ***P ≤ 0·001, ****P ≤ 0·0001). Detailed P‐values are given in Table S6.
For E. faecium the use of bleach‐free detergent leads to statistically significant higher log‐reductions in cycles with a duration of 5 min, when compared to the cycles without detergent except for the temperatures of 65 and 75°C (see Table S5). With these two temperatures the reductions are very close to the maximum reduction without detergent, so that the observable difference is no longer statistically significant. The use of AOB‐containing detergent does not further increase the log‐reduction. On the contrary, there are conditions in which the log‐reduction is higher with bleach‐free detergent than with AOB‐containing detergent (e.g. 55°C and 5 min duration or 60°C and 10 min duration). With a cleaning duration of 15 min, the log‐reductions at 55, 60 and 65°C do are statistically significant higher, when any type of detergent is used compared to the runs without detergent.
For M. luteus DSM 1790, the detergent type used shows influences at low temperatures with longer durations (e.g. 45°C and 90 min). The bleach‐free detergent shows the highest log‐reduction, followed by the AOB‐containing detergent. The cycles without detergent show the lowest log‐reduction.
In the cycles with a duration of 15 min and temperatures from 55 to 65°C, the addition of AOB to the detergent results in increased log‐reductions compared to runs without detergent. At 60 and 65°C, the log‐reduction increases from runs without detergent to runs with bleach‐free detergent and runs with AOB‐containing detergent.
Influence of the final rinsing temperature on the microbial reduction
Figure 9 shows the logarithmic reductions for three different strains of Micrococcus luteus. For M. luteus DSM 1790, the increase of the final rinsing temperature does lead to significant higher log‐reductions when a cleaning temperature of 45 °C is used. With a higher main cleaning temperature of 55°C, the log‐reduction is significantly higher with the higher final rinsing temperatures compared to 35°C final rinsing temperature. However, when the two final rinsing temperatures of 50 and 70°C are compared, the maximum reduction is reached with both combinations, thus not resulting in significant differences.
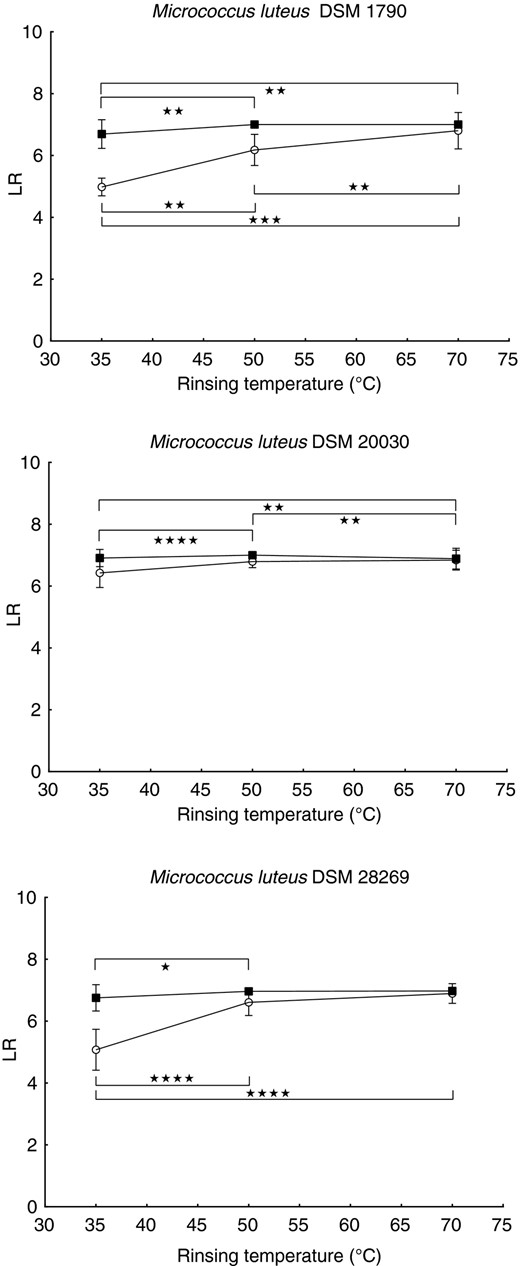
Logarithmic reduction of different Micrococcus luteus strains in dishwasher cycles with a cleaning duration of 15 min, cleaning temperatures of 45°C (white dots) and 55°C (black squares) and rinsing temperatures of 35, 50 or 70 °C. All points represent means ± SD received from 3 independent runs with 3 biomonitors each. Lines are for visualization only. Significant statistical differences are marked with asterisks (*P ≤ 0·05, **P ≤ 0·01, ***P ≤ 0·001, ****P ≤ 0·0001). Detailed P‐values are given in Table S7.
For M. luteus DSM 20030, increased final rinsing temperatures do not lead to significantly higher log‐reductions with a cleaning temperature of 45°C. With a cleaning temperature of 55°C, the highest log‐reduction is detected with a final rinsing temperature of 50°C with the log‐reductions of the two remaining final rinsing temperature being significantly lower.
For M. luteus DSM 28269 at a cleaning temperature of 45°C, the log‐reduction for the lowest tested final rinsing temperature of 35°C is significantly lower than for the other two temperatures. Although a difference between final rinsing temperatures of 50 and 70°C is visible with a main cleaning temperature of 45°C, this difference is not significant. With a cleaning temperature of 55°C, the final rinsing temperature of 35°C results in a significantly lower log‐reduction, compared to the final rinsing temperature of 50°C.
Regression analysis
Four parameter logistic regression
Data analysis reveals that several conditions result in log‐reductions that do follow the rules of 4‐parameter logistic regression. The four‐parameter logistic equation curve is defined by the parameters upper (d) and lower (a) asymptote, the point of inflection of the curve (c) and the Hill's slope (b) given in Table 1. The respective correlation coefficients for these parameters are given in the bottom line.
Results for the four parameter logistic regression of different treatments of Entereococcus faecium and Micrococcus luteus DSM 1790
| Parameter | Entereococcus faecium | Micrococcus luteus DSM 1790 | |||||||
|---|---|---|---|---|---|---|---|---|---|
| Treatment | Treatment | ||||||||
| 05 min AOB | 10 min ND | 15 min AOB | 90 min ND | 05 min ND | 05 min DT | 10 min DT | 15 min DT | 15 min AOB | |
| d | 8·444 | 8·676 | 8·53 | 9·011 | 7·249 | 9·141 | 9·109 | 9·024 | 8·437 |
| a | 6·653 | 5·781 | 5·909 | 6·269 | 5·831 | 5·143 | 5·103 | 5·909 | 4·76 |
| c | 58·34 | 60·38 | 55·3 | 54·83 | 57·56 | 60·32 | 60·15 | 61·31 | 52·31 |
| b | 0·2121 | 0·2186 | 0·1986 | 0·159 | 0·3576 | 0·2218 | 0·169 | 0·4883 | 0·0431 |
| R 2 | 0·3149 | 0·5958 | 0·6791 | 0·6793 | 0·1959 | 0·8475 | 0·8135 | 0·6903 | 0·3175 |
Linear regression
The linear regression of the investigated rinsing temperatures combined with the main cleaning cycle temperatures of 45 or 55°C was analysed. The values for slope and vertical intercept for the single treatments are given in Table 2.
Overview of the parameters obtained from linear regression analysis. For each Micrococcus luteus strain, tested at the main cleaning temperature of 45 or 55°C, the regression for the three different rinsing temperature (35, 50 and 70°C) was analysed
| Main cleaning temperature (TC in C) | 45°C | 55°C | ||||
|---|---|---|---|---|---|---|
| Micrococcus luteus strain | 1790 | 20030 | 28269 | 1790 | 20030 | 28269 |
| Slope (e in °C−1) | 0·09255 | 0·01183 | 0·07847 | 0·03045 | 0·004655 | 0·009369 |
| Vertical intercept (f) | 1·670 | 6·674 | 2·635 | 6·738 | 7·797 | 7·305 |
| R 2 | 0·7672 | 0·02769 | 0·6365 | 0·1974 | 0·01327 | 0·03187 |
Discussion
Up to now, the only standard dealing with the hygiene in domestic dishwashers is NSF/ANSI 184‐2019 (“Dishwashers ‐ NSF International,” 15; “NSF/ANSI 184‐25: Residential Dishwashers,” 2019). This standard provides regulations for an extra certification for domestic dishwashers if the appliance manufacturers want to have their appliance certified as sanitizing. This might be a plus for a certain group of buyers (immunocompromised people), but does not fix regulations for general requirements. Additionally, this standard handles the requirements that are also set for dishwashers for commercial use (Deutsches Institut für Normung e. V. 10), but are not generally required for household appliances and not valid outside the United States.
The current study aimed to provide a method to determine the microbial reduction reached by a single dishwasher or cleaning cycle and to compare the reductions achieved by different program parameters.
The combination of established components as the soil matrix (Deutsches Institut für Normung e. V. 9) and the biomonitors (Deutsches Institut für Normung e. V. 10) with an optimized extraction method, herein using a well‐established extraction‐liquid (Brands and Bockmühl 4; Honisch et al. 18) led to high recovery of the micro‐organisms from the biomonitors.
As this method has not been used before, there are no data available as whether comparable results have been obtained by other groups, but the results achieved in two different laboratories in Bonn and Kleve are comparable.
Next to E. faecium, a bacterium that is currently used in dishwasher testing (Deutsches Institut für Normung e. V. 9, 10, 11), different strains of M. luteus were used in the testing. This organism was recently described as an alternative test organism in commercial dishwashers (Klapper et al. 22). This micro‐organism shows good differentiation and has the advantage that it is classified into a lower biosafety‐level (Bundesanstalt für Arbeitsschutz und Arbeitsmedizin 6, 7) so that it can be handled in all laboratories with basic microbiological equipment.
Test for the influence of the final rinsing temperature show that the different strains of M. luteus produce different results. Two of the tested strains, DSM 20030 and 28269 did not differentiate well between the rinsing temperatures. This is most likely due to the fact that these strains are more easily inactivated compared to DSM 1790.
So, the described method can detect the combined effects of the parameters time, temperature, mechanics and detergent, which have been shown to be the four components affecting the cleaning performance according to Sinner's circle (Sinner 33). Although an isolated effect of one of the parameters time, temperature, mechanics and detergent can hardly be quantified as there is always an interaction of the different parameters, the setup of this study makes it possible to directly compare the influence when one parameter is changed.
As the cycles in commercially available present‐day dishwashers are very diverse, no general conclusion about the antimicrobial action of domestic automated dishwashing can be drawn. Thus, more tests with different dishwashers have to be performed and the behaviour of more test micro‐organisms should be evaluated in future to give a picture of the current situation. Nevertheless, numerous studies in different household appliances have shown that the hygiene status of household dishwashers must be considered quite good in general (Brands and Bockmühl 4; Brands et al. 5), biofilms have been detected (Zalar et al. 41; Babič et al. 1; Nix et al. 24; Savage et al. 31; Egert 17; Rehberg et al. 29; Raghupathi et al. 27; Zupančič et al. 42). However, dishwashing hygiene must be constantly observed since some micro‐organisms might be able to survive dishwashing cycles, should future developments in water and energy saving lead to a shift in the parameters.
In summary, the factors cleaning cycle temperature, cleaning cycle duration, final rinsing temperature and the type of detergent used all contribute to the reduction of test strains in dishwasher cycles.
Increased temperatures as well as increased durations of the main cleaning cycle lead to increased reductions of the microbial load during the dishwashing process. The addition of detergent was able to increase hygiene efficacy in shorter cycles or in cycles with lower temperatures. Even in shorter cycles or with lower tested temperatures, the microbial reduction was high in our test setting. As specially programmed dishwashers were used, no direct conclusions can be drawn for current household appliances.
As cycles in domestic appliances are very diverse, a standardized method to determine their ability to reduce the microbial load is of great use. If the trend towards saving water and energy continues, for example, due to stricter eco‐design regulations, this might cause a further reduction in temperatures (as most energy is used for heating up the water) of the dishwashing cycle and thus facilitate the survival of pathogenic micro‐organisms. The method described here is able to demonstrate the reductions achieved by dishwashing cycles with different parameters and might help to find the necessary balance between energy saving and an acceptable level of hygiene.
Acknowledgements
The authors thank Arcelik A.S., Henkel AG & Co. KGaA, LG Electronics Deutschland GmbH, Miele & Cie. KG, P&G, RB Reckitt Benckiser Produktions GmbH, Unilever N.V., BSH Hausgeräte GmbH, ASKO Appliances AB and MIDEA Kitchen Appliances for funding this study, Miele & Cie. KG for providing the dishwashers in which the tests were carried out as well as for programming of different program parameters and Henkel AG & Co. KGaA for providing reference detergent D.
Conflict of Interest
There is no conflict of interest.
