


Abstract
In this study, bacteria isolated from companion animals in China were taxonomically identified and assessed for antimicrobial susceptibility to evaluate the prevalence of antimicrobial resistance (AMR) in pets.
From October 2022 to October 2023, 5468 samples were collected from pets, predominantly from cats and dogs, in China, of which 5253 bacterial strains were identified (>98%). Antimicrobial susceptibility was assessed using the VITEK 2 COMPACT system and the Kirby–Bauer disc diffusion method.
The most common bacterial species were Escherichia coli (14.5%) and Staphylococcus pseudintermedius (13.6%). E. coli exhibited high resistance to ampicillin and cefpodoxime (56.8%–73.2%) but moderate resistance to doxycycline, trimethoprim-sulfamethoxazole, enrofloxacin, gentamicin, and amoxicillin-clavulanate (18.1%–38.5%). Klebsiella spp. and Enterobacter spp. were resistance to several antimicrobials (32.2%–57.7%). High susceptibility to imipenem was noted in Proteus spp., Pseudomonas spp., and Acinetobacter spp. (91.7%–94.1%). Coagulase-positive Staphylococcus spp. demonstrated higher resistance than coagulase-negative strains. Enterococcus faecium showed greater resistance to some antimicrobials compared with E. faecalis. Streptococcus spp. exhibited low resistance to enrofloxacin (1.6%) and penicillin (1.1%).
The study demonstrates that AMR is widespread in companion animals in China, emphasizing the need for continuous surveillance. The accumulation of commercial antimicrobial susceptibility data can improve understanding of AMR and promote more effective antimicrobial stewardship and clinical practices in veterinary medicine.
Introduction
As a hotspot of frequent antimicrobial administration and high patient density, pet hospitals are now considered a high-risk environment for the spread of antibacterial resistance, which causes resistant bacterial growth and infection control problems as currently experienced in human hospitals.1 For example, extended-spectrum beta-lactamase (ESBL)–producing Escherichia coli are widely distributed in dogs and cats across all continents.2 Sequence analysis of Staphylococcus pseudintermedius collected from dogs in a US study revealed that 32.3% (191/592) of isolates carried mecA, a gene for methicillin resistance, indicating that methicillin-resistant S. pseudintermedius (MRSP) are prevalent in the wild.3 Numerous studies have shown that drug-resistant bacteria or drug resistance genes can be transmitted between pets and humans.4–8 Some studies report that strict supervision of antimicrobial drug prescriptions and surveillance of drug resistance in companion animals can effectively minimize the development of bacterial resistance in pets, as well as in humans.9,10
In 2015, the Global Action Plan was adopted by the Food and Agriculture Organization of the United Nations, the World Organization for Animal Health and the World Health Organization to ensure that the global community has the capacity to control and prevent antibiotic-resistant bacterial diseases. These organizations have since worked towards establishing an integrated monitoring system platform called the Global Antimicrobial Resistance and Use Surveillance System to collect and compile human, animal, food, and environmental health data reported by countries.11 Some developed countries are also establishing detection networks for animal bacterial drug resistance. In 2020, the European Union launched the European Antimicrobial Resistance Surveillance Network for Veterinary Medicine to understand the current situation of antimicrobial resistance (AMR) in veterinary medicine in European counrties.12 The Veterinary Laboratory Investigation and Response Network established by the USA was created to conduct antimicrobial susceptibility testing and whole-genome sequencing for specific veterinary pathogens (E. coli, S. pseudintermedius and Salmonella enterica from any animal species), and the latest data currently available in 2021 were released in August 2024.13 Finland, Sweden and Japan have been conducting surveillance of veterinary AMR, including in infected companion animals (cats and dogs).14–16 These surveillance efforts contribute to enhancing current understanding of AMR dynamics and inform strategies for combating this global threat.
Surveillance of animal-origin bacterial resistance has been performed for a long time in China; however, most data have been collected from commercial livestock, e.g. swine and chicken.17 Data on the distribution of resistant bacteria and drug resistance in pets in China had not been collected until the China Antimicrobial Resistance Surveillance Network for Pets (CARPet), which aimed to collect data from Chinese companion animal hospitals, was established in 2021.18 CARPet has accumulated AMR data on more than 4000 isolates from dogs and cats from 2018 to 2021 in 25 Chinese provinces/municipalities. However, more than 90% of data have been collected in Beijing and thus have limited geographic coverage.18 In this study, we identified and determined drug resistance in bacterial isolates collected from pet hospitals in 30 provinces in China from October 2022 to 2023 to enhance our understanding of the current AMR status across pet populations in China.
Materials and methods
Sample source
In total, 5468 non-duplicate clinical samples were collected from animals presenting with clinical symptoms (e.g. pyothorax, frequent micturition, dysuria, pyoderma, etc.) in 1069 pet hospitals from October 2022 to October 2023. The samples were submitted to Zoetis Reference Laboratory (ZRL), a nationwide commercial diagnostic laboratory in China, for bacteriological and antimicrobial susceptibility testing. The clinical specimens were collected from cats (54.1%, n = 2957), dogs (44.9%, n = 2455), small mammals (rabbits and guinea pigs; 0.5%, n = 26), birds (0.1%, n = 5), reptiles (0.1%, n = 3) and unknown species (0.4%, n = 22). The samples were collected from the urinary tract (35.3%, n = 1932), respiratory tract (21.0%, n = 1150), skin (20.3%, n = 1109), ear tract (9.8%, n = 537), sterile cavity fluid (8.8%, n = 481) and other sites (4.7%, n = 259). Geographically, the samples were collected from regions north and south of the Qinling Mountains–Huaihe River Line, which serves as the boundary between northern and southern China.
Bacterial isolation and identification
To ensure timely testing, samples collected from the north were tested by the Beijing laboratory (n = 991), while samples collected from the south were tested by the Shanghai laboratory (n = 4477). Both laboratories adhered to the same procedures, including the use of identical reagents, consumables and protocols, to ensure consistent test results.
Columbia blood agar medium and thioglycolate agar medium (containing 5% sheep blood), MacConkey agar and chocolate agar were inoculated according to the sample types and specimens submitted for testing. Since clinical infections may involve co-infection of two or more types of bacteria, up to two isolates of suspected pathogens were selected from each sample. The selection was based on the type of specimen, microscopic examination of the original smear and bacterial growth on the medium.
Bacterial strains were primarily identified by matrix-assisted laser desorption/ionization mass spectrometry (MALDI-TOF MS; Bio Mérieux, France) using E. coli ATCC8739 for quality control. For bacteria that could not be identified by MALDI-TOF MS, 16S rDNA gene sequencing methods were performed as a supplement.
Antibiotic susceptibility testing
All bacterial isolates were tested for antibiotic sensitivity, except for Nocardia spp., Actinomyces spp. and Mycobacterium spp. The minimum inhibitory concentration (MIC) values were measured using the VITEK 2 COMPACT system (Bio Mérieux) using the GN-97 and GP-80 cards designed for veterinary in vitro diagnostics. Regarding the MIC values, 145 and 280 μL colony suspensions equivalent to the 0.5 McFarland standard were added to 3 mL of 0.45% NaCl solution in a clear plastic test tube for identifying Gram-negative bacilli and Gram-positive cocci, respectively. The VITEK 2 COMPACT system was used for incubation, detection and interpretation. Disc diffusions were performed as supplementary tests for some antimicrobial susceptibility tests that were beyond the scope of the VITEK 2 COMPACT. Bacterial suspensions equivalent to the 0.5 McFarland standard were inoculated on agar plates required by the Clinical and Laboratory Standards Institute (CLSI). A maximum of 12 discs were tested on a 150 mm plate and no more than 6 discs on a 100 mm plate. Carbapenem-resistant Enterobacterales (CRE) and methicillin-resistant Staphylococcus (MRS) were identified by their susceptibility to imipenem and oxacillin, respectively. CRE susceptibility was determined using the Kirby–Bauer method, while MRS susceptibility was assessed via MIC testing. Inducible clindamycin resistance was also evaluated in Staphylococcus spp. and Streptococcus spp. (β-haemolytic group). Disc diffusion was performed to test for ESBL in Klebsiella pneumoniae, K. oxytoca, E. coli, and Proteus mirabilis according to the CLSI M100-Ed32 and CLSI VET 01S-Ed5 guidelines.
The selection of drugs was based on the A–E group drugs in the CLSI VET01S-Ed5 guidelines and important antibiotics in human and animal medicine. Data on the drug resistance of the bacteria tested are presented in Table S1 (available as Supplementary data at JAC-AMR Online). Drug sensitivity was established according to the breakpoints of the CLSI VET01S-Ed5 and M100-Ed32 guidelines.19,20 The zone diameter and MIC breakpoints used in this article are shown in supplementary data. The strains used for quality control were Enterococcus faecalis ATCC29212; S. aureus ATCC29213, ATCC BAA-976, ATCC BAA-977, and ATCC BAA-1026; E. coli ATCC35218 and ATCC25922; Pseudomonas aeruginosa ATCC27853 and K. pneumoniae ATCC700603. All the results of the quality control strains were within the ranges determined by the CLSI.
Statistical analysis
The associations among geographical distribution, species, sample source and resistance rates of isolates from dogs and cats were analysed using the chi-square and Fisher’s exact tests. AMR data were compared with those on the CARPet and CHINET networks in China using the same statistical methods. A P value <0.05 was considered significant. Multiple drug resistance (MDR) was defined as an isolate that is resistant to at least one agent in three antimicrobial categories, as described previously.21
Results
Distribution of pet clinical samples
Of the 5468 samples, 3733 (68.3%), which were collected from 906 pet hospitals in 30 provinces and municipalities, were positive on bacterial culture testing (Figure 1). Of the positive samples, 799 (21.4%) were from the north, with a positive rate of 67.8%, while 2934 (78.6%) were from the south with a positive rate of 68.4%. There was no significant difference in the positive rate between the southern and northern regions (P > 0.05).
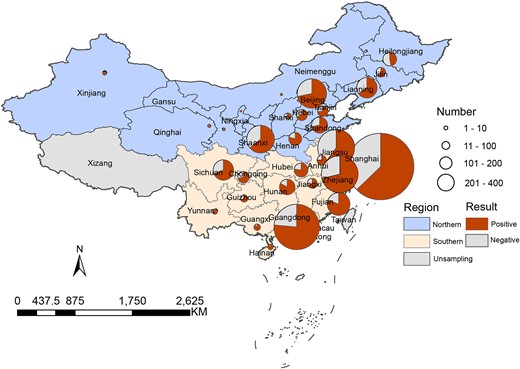
Distribution of positive samples from pets by geographical location.
Of the 3733 positive samples, 1935 (51.8%) were from cats, with a 65.4% positive rate; 1750 (46.9%) were from dogs, with a 71.3% positive rate and 48 (1.3%) were from other animals, including small mammals, reptiles, birds and unknown species, with an 85.7% positive rate (Table S2). Although the total number of samples was similar between cats and dogs, the positive rate in dogs was significantly higher (P < 0.05). The top three types of positive samples were from the urinary tract (n = 1127; 30.2%), respiratory tract (n = 952; 25.5%) and skin (n = 846; 22.7%), which accounted for 78.4% of all positive samples (Figure 2). The remaining 21.6% of positive samples included those from the ear tract, cavity fluid, tissue, uterus and faeces.
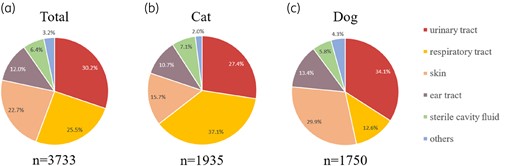
Distribution of samples from (a) all species, (b) cats, and (c) dogs. ‘Others’ represents tissue (organs tissue from surgery), faces and uterus.
Distribution of pet clinical isolates
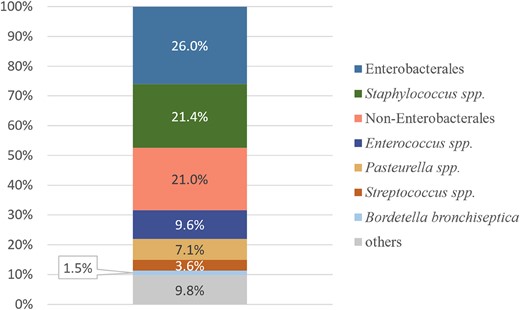
In total, 5253 bacterial strains were isolated from the 3733 positive samples, with the proportion of Gram-negative bacteria (n = 3131; 59.6%) being slightly higher than that of Gram-positive bacteria (n = 2122; 40.4%). Isolates from dogs and cats accounted for 46.7% (n = 2454) and 52.0% (n = 2729), respectively. The remaining 70 (1.3%) isolates were obtained from other species (Table 1). Most isolates were from southern China (77.8%, n = 4086), while the rest (22.2%, n = 1167) were from northern China. The most common clinical isolates from cats and dogs were Enterobacterales (26.0%, n = 1368), Staphylococcus spp. (21.4%, n = 1126), non-Enterobacterales (21.0%, n = 1102), Enterococcus spp. (9.6%, n = 502), Pasteurella spp. (7.1%, n = 372), Streptococcus spp. (3.6%, n = 189) and Bordetella bronchiseptica (1.5%, n = 80) (Figure 3). Furthermore, 514 (9.8%) isolates were from other uncommon bacterial species, such as Corynebacterium spp. (n = 61), Bacteroides spp. (n = 50) and Actinomyces spp. (n = 49). Specimen analysis revealed E. coli as the most frequently isolated species in 26.3% of urinary tract samples. Pasteurella multocida and S. pseudintermedius were the predominant isolates in the respiratory tract (16.4%) and skin (22.1%), respectively. Although E. coli was predominant in canine and feline urinary tracts, the bacterial species in the respiratory tract and skin samples differed between the two species. Furthermore, respiratory tract samples from dogs and skin samples from cats exhibited a complex population of bacterial species (Table S3).
Distribution of clinical isolates from all species.
The species of 5253 isolates from pets
| Category | Organism | Total (n = 5253) | Dog (n = 2454) | Cat (n = 2729) | Others (n = 70) | ||||
|---|---|---|---|---|---|---|---|---|---|
| No. of isolates | Proportion within group (%) | No. of isolates | Proportion within group (%) | No. of isolates | Proportion within group (%) | No. of isolates | Proportion within group (%) | ||
| Gram-negative bacteria | Enterobacterales | 1368 | 26.0 | 771 | 31.4 | 581 | 21.3 | 16 | 22.9 |
| Non-Enterobacterales | 1102 | 21.0 | 441 | 18.0 | 645 | 23.6 | 16 | 22.9 | |
| Pasteurella spp. | 372 | 7.1 | 35 | 1.4 | 334 | 12.2 | 3 | 4.3 | |
| B. bronchiseptica | 80 | 1.5 | 21 | 0.9 | 57 | 2.1 | 2 | 2.9 | |
| Others | 209 | 4.0 | 67 | 2.7 | 135 | 4.9 | 7 | 10.0 | |
| Σ | 3131 | 59.6 | 1335 | 54.4 | 1752 | 64.2 | 44 | 62.9 | |
| Gram-positive bacteria | Staphylococcus spp. | 1126 | 21.4 | 705 | 28.7 | 412 | 15.1 | 9 | 12.9 |
| Enterococcus spp. | 502 | 9.6 | 206 | 8.4 | 293 | 10.7 | 3 | 4.3 | |
| Streptococcus spp. | 189 | 3.6 | 70 | 2.9 | 116 | 4.3 | 3 | 4.3 | |
| Others | 305 | 5.8 | 138 | 5.6 | 156 | 5.7 | 11 | 15.7 | |
| Σ | 2122 | 40.4 | 1119 | 45.6 | 977 | 35.8 | 26 | 37.1 | |
| Σ | 5253 | 2454 | — | 2729 | — | 70 | — | ||
In total, 1368 Enterobacterales strains were isolated, with E. coli having the highest percentage (55.7%) (Figure 4a; Table S4). Of the 1126 strains of Staphylococcus isolated, coagulase-positive Staphylococcus (CoPS) accounted for 76.0% (n = 856), including S. pseudintermedius, S. aureus, S. schleiferi and S. delphini. Notably, S. pseudintermedius was the most prevalent CoPS at 83.3% (n = 713) and was mainly isolated from dogs (84.7%, n = 604). Coagulase-negative Staphylococcus (CoNS) accounted for 24.0% (n = 270) of all Staphylococcus isolates, of which S. felis was the most common at 53.3% (n = 144) (Figure 4b; Table S5). Among the isolates of non-Enterobacterales, Pseudomonas spp. was the most dominant genus (57.5%, n = 634), followed by Acinetobacter spp. at 29.5% (n = 325) (Figure 4c; Table S6). E. faecalis (49.8%, n = 250) and E. faecium (41.4%, n = 208) were the most common Enterococcus spp. isolated (Figure 4d; Table S7). P. multocida (89.8%, n = 334) was the dominant Pasteurella sp. isolated, mainly from cats (95.2%, n = 318) (Figure 4e; Table S8). Streptococcus canis was the main Streptococcus sp. isolated. (61.4%, n = 116) (Figure 4f; Table S9).
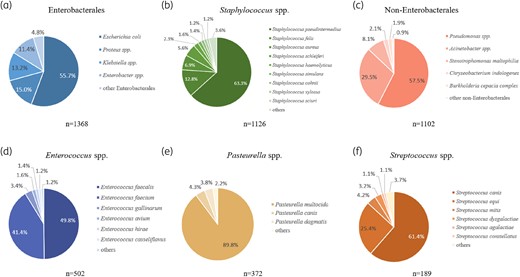
Distribution of top six bacterial genus. Pie graphs of detected species are shown for (a) Enterobacterales., (b) Staphylococcus spp., (c) non-Enterobacterales., (d) Enterococcus spp., (e) Pasteurella spp., (f) Streptococcus spp.
Drug sensitivity analysis
Resistance of Gram-negative isolates to antimicrobial agents
The MIC distribution (Table 2) indicates that E. coli had the highest resistance to ampicillin at 73.2%. Resistance to third-generation cephalosporins and doxycycline was also observed at 56.8% and 38.5%, respectively. Interestingly, E. coli exhibited relatively low resistance to amoxicillin/clavulanate (18.1%), amikacin (8.5%) and carbapenems (7.1%) (Figure 5a; Table S10). Notably, 7.1% of E. coli isolates were identified as CRE, while 45.1% of were ESBL producers. Compared with E. coli, Klebsiella spp. demonstrated a lower resistance to third-generation cephalosporins (47.8%) but a higher resistance to doxycycline (47.2%) (Figure 5b; Table S11). Approximately 6.7% of Klebsiella spp. isolates were CRE, while 37.8% were ESBL producers. Proteus spp. exhibited the highest resistance to ampicillin (72.7%), similar with E. coli. Proteus spp. also exhibited a higher resistance to trimethoprim-sulfamethoxazole (57.6%) compared with other Enterobacterales (Figure 5c; Table S12). Furthermore, 5.9% of Proteus spp. isolates were identified as CRE, while 9.3% were ESBL producers. The resistance rates for third-generation cephalosporins, gentamicin, sulfamethoxazole, enrofloxacin and doxycycline in Enterobacter spp. ranged from 36.5% to 57.7%. The genus also showed the highest resistance rate for carbapenems (10.9%) among the Enterobacterales (Figure 5d; Table S13). Approximately 10.9% of Enterobacter spp. isolates were identified as CRE.
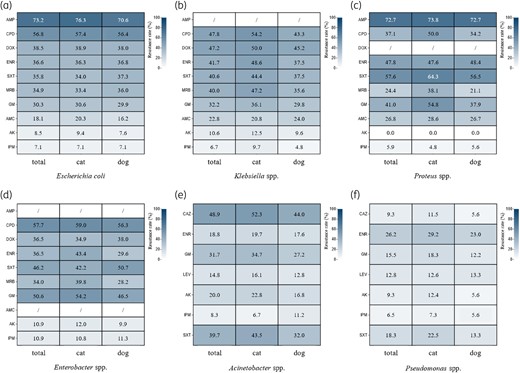
The resistance rates of Gram-negative isolates. Heatmaps are shown for (a) E. coli, (b) Klebsiella spp., (c) Proteus spp., (d) Enterobacter spp., (e) Acinetobacter spp., (f) Pseudomonas spp. AK, amikacin; AMC, amoxicillin-clavulanic acid; AMP, ampicillin; CAZ, ceftazidime; CPD, cefpodoxime; DOX, doxycycline; ENR, enrofloxacin; GM, gentamicin; IPM, imipenem; LEV, levofloxacin; MRB, marbofloxacin; SXT, trimethoprim/sulfamethoxazole.
The MIC distribution of 762 E. coli isolates from pets
| Antimicrobial agents | MIC (mg/L) | ||||||||||||||||||||||||
|---|---|---|---|---|---|---|---|---|---|---|---|---|---|---|---|---|---|---|---|---|---|---|---|---|---|
| ≤0.12 | ≤0.25 | 0.25 | ≤0.5 | 0.5 | ≤1 | 1 | ≤2 | 2 | 4 | ≥4 | 6 | 8 | ≥8 | 16 | ≥16 | ≤20 | 32 | ≥32 | 40 | 64 | ≥64 | 80 | 160 | ≥320 | |
| Gentamicin | 520 | 5 | 1 | 1 | 4 | 231 | |||||||||||||||||||
| Amikacin | 643 | 31 | 5 | 13 | 5 | 65 | |||||||||||||||||||
| Enrofloxacin | 187 | 19 | 151 | 118 | 8 | 279 | |||||||||||||||||||
| Marbofloxacin | 397 | 86 | 13 | 266 | |||||||||||||||||||||
| Trimethoprim-sulfamethoxazole | 488 | 1 | 2 | 2 | 269 | ||||||||||||||||||||
| Cefpodoxime | 206 | 85 | 22 | 15 | 1 | 433 | |||||||||||||||||||
| Ampicillin | 78 | 52 | 65 | 9 | 558 | ||||||||||||||||||||
| Amoxicillin-clavulanic | 167 | 162 | 195 | 100 | 138 | ||||||||||||||||||||
| Doxycycline | 52 | 247 | 53 | 25 | 92 | 293 | |||||||||||||||||||
The resistance rate for gentamicin among Acinetobacter spp. was >30%, while resistance rates for enrofloxacin, amikacin, levofloxacin and carbapenems were all under 20% (Figure 5e; Table S14). The resistance rates among Pseudomonas spp. for gentamicin, levofloxacin, amikacin and imipenem were low (all <20%), whereas resistance to enrofloxacin was at 26.2%, (Figure 5f; Table S15).
Resistance of Gram-positive isolates to antimicrobial agents
The resistance rates among the 856 CoPS isolates exceeded those observed among the 270 CoNS isolates for most drugs, except for rifampicin and vancomycin (Figure 6a and b; Tables S16 and S17). Specifically, CoPS demonstrated resistance rates >50% for doxycycline, erythromycin, clindamycin, oxacillin, third-generation cephalosporins, trimethoprim/sulfamethoxazole and enrofloxacin. Overall, 45.7% of isolates were MRS, with CoPS exhibiting a significantly higher MRS rate than CoNS (50.7% versus 30.0%, respectively; P < 0.05).
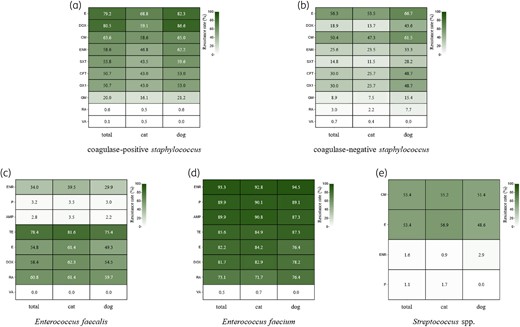
The resistance rate of Gram-positive isolates. Heatmaps are shown for (a) CoPS, (b) CoNS, (c) E. faecalis, (d) E. faecium, (e) Streptococcus spp. AMP, ampicillin; CFT, ceftiofur; CM, clindamycin; DOX, doxycycline; E, erythromycin; ENR, enrofloxacin; GM, gentamicin; OX1, oxacillin; P, benzylpenicillin; RA, rifampicin; SXT, trimethoprim/sulfamethoxazole; TE, tetracycline; VA, vancomycin.
E. faecium exhibited a higher overall resistance rate than E. faecalis. Specifically, E. faecium showed substantial resistance to penicillin (89.9%), ampicillin (89.9%) and enrofloxacin (93.3%), whereas the resistance rates of E. faecalis for these drugs were 3.2%, 2.8% and 34.0%, respectively (Figure 6c and d; Tables S18 and S19). Streptococcus had a resistance rate of 53.4% for both erythromycin and clindamycin only. Resistance to both drugs was slightly higher in cats than in dogs. Resistance to enrofloxacin and penicillin was <3.0% (Figure 6e; Table S20).
Multiple drug resistance
MDR was notably prevalent among the Enterobacterales, with Proteus spp. (54.6%), Enterobacter spp. (53.2%), E. coli (53.0%) and Klebsiella spp. (45.0%) exhibiting substantial MDR rates. In contrast, Acinetobacter spp. and Pseudomonas spp. had lower MDR rates (33.5% and 16.2%, respectively) (Table S21). Interestingly, feline isolates consistently demonstrated higher MDR rates than canine isolates. CoPS exhibited significantly higher MDR rates than CoNS (70.0% versus 35.2%). Notably, canine CoPS and CoNS were more resistant to antimicrobial agents than feline ones, with MDR rates of 75.1% versus 57.0% and 53.8% versus 31.0%, respectively. Among Enterococcus spp. isolates, E. faecium had a higher overall MDR rate than E. faecalis (92.3% versus 66.0%, respectively). Streptococcus spp. isolates exhibited relatively low MDR rates at 2.1%.
Discussion
In this study, we identified and characterized bacterial isolates from clinical samples collected from pet animals across most provinces in China. The primary focus was on assessing the AMR of these isolates to establish the current AMR status across Chinese pet populations. To the best of our knowledge, this study is the largest 1 year survey of the prevalence and AMR of isolates from hospitalized companion animals in China. Similar to the CARPet data reported in 2018–21, the most common specimen sites for clinical isolates were the urinary tract, respiratory tract and skin, with E. coli and S. pseudintermedius as the predominant pathogens. However, in contrast to CARPet isolates, 90% of which were obtained from pets around Beijing, the present study has a broader, nationwide scope of surveillance, covering almost the entire country. Over 60% of the specimens were collected from eastern China (Shanghai, Guangdong, Zhejiang and Jiangsu), with the majority of positive samples originating from this region. Previous reports of AMR in companion animals in these areas have focused on specific pathogens, such as E. coli in Guangzhou and Salmonella in Xuzhou and Hangzhou.22–24 In contrast, the current study provides a broader perspective on pet-derived AMR in 2023 in China and especially elucidates the status in the southern regions.
Although more feline than canine samples were collected, the positive sample rate was significantly higher in dogs, particularly in urinary tract infections. In the present study, 66.5% of canine and 51.3% of feline urinary tract samples tested positive for bacterial infections. This trend aligns with the prevalence rates of uropathogens in dogs and cats (43.9% versus 38.5%, respectively) reported by a veterinary microbiological diagnostic laboratory in Germany in 2019–20, with our study reporting a higher percentage.25 Bacterial urinary tract infections, such as sporadic bacterial cystitis and sub-clinical bacteriuria, are more common in dogs. However, most cats, especially kittens, present with fewer urinary tract infection signs and do not have bacterial cystitis.26,27 For non-bacterial disorders, such as feline idiopathic/interstitial cystitis, confirming the diagnosis is essential and unnecessary antimicrobial treatment must be avoided.28 Canine skin samples (n = 523) had a significantly higher positive rate (78.4%, P < 0.05) than feline samples (n = 303; 72.1%). Canine pyoderma, a highly common bacterial skin infection,29 may explain the higher number of canine than feline skin samples, with the latter consisting only 15.7% of positive samples. Furthermore, bacterial folliculitis/furunculosis accounted for 10% of feline dermatological cases at Cornell University.30 The dermatology department of the Sydney Veterinary Teaching Hospitals report a prevalence of feline superficial pyoderma of ∼20%.31 Superficial pyoderma in cats is traditionally considered rare but is actually underdiagnosed. Our findings highlight a significant difference between the number and proportion of positive feline and canine samples.
CHINET, established in 2005, monitors AMR across teaching hospitals in China and provides data up to 2023, whereas CARPet, established in 2021, analyses AMR data from companion animals across various regions, with data published from 2018 to 2021. Therefore, we compared our data with those of CARPet and CHINET to evaluate the resistance profiles of bacterial isolates from similar sources and periods. Carbapenems have been considered the last line of defence against Gram-negative bacterial infections in human medicine.32 However, studies in 2018 and 2021 have found that E. coli isolated from pets have significantly higher resistance rates to carbapenems than those from humans.18 In the present study, resistance to carbapenems in pet-derived E. coli was significantly higher from that in CARPet data (7.1% versus 3.5%, respectively; P < 0.01). ESBL-producing Enterobacterales are widely distributed and enhance AMR, particularly against third- and fourth-generation cephalosporins and aztreonam, which are last-line antibiotics for Enterobacterales, including E. coli, infections. In our study, ESBL-producing E. coli accounted for 45.1% (344/762) of isolates, which is consistent with the 2021 findings of Cui et al.,33 who reported a rate of 43.0% (34/79) of isolates from companion animals in Shandong, China. However, in 2021 Salgado-Caxito et al.2 reported global prevalence rates of ESBL-producing E. coli in dogs and cats through meta-analysis, with significant variability across continents, ranging from 0.63% and 0% in Oceania to 16.6% and 16.8% in Africa, respectively. Thus, ESBL strains are more prevalent in companion animals in China, which emerge as a potentially significant reservoir of AMR. The prevalence of MDR Gram-negative bacteria in our study was higher than that reported in CARPet, likely because our study sample consisted of diseased animals. High MDR levels present a significant challenge for effective treatment and increase the risk of treatment failure. Methicillin resistance in Staphylococcus is a highly alarming form of acquired resistance, which creates resistance to most β-lactam antibiotics, including methicillin, oxacillin and cephalosporins. MRS strains often exhibit MDR, making MRS infections difficult to treat.34 Thus, MRSP poses a growing concern for zoonotic transmission and clinical outbreaks in companion animals. Laboratory susceptibility testing of S. pseudintermedius isolates in the USA between 2019 and 2021 confirmed substantial resistance to methicillin (oxacillin), with an average of 32.7% of isolates classified as non-susceptible.35 In our study, the MRSP rate was 55.8%, which is higher than the 45.5% reported by CARPet, which would be concerning to veterinary medicine practitioners. The high MRSP rate may be linked to the prevalence of canine pyoderma and more limited antimicrobial treatment options in veterinary than in human medicine.
Veterinary diagnostic laboratories (VDLs) are crucial in the microbiological examination of companion animals, which differs from human and livestock diagnostics. The diagnostic services provided by VDLs are essential to veterinarians, who rely on diagnostics for determining antimicrobial treatment prescriptions. VDLs guide appropriate sample collection, test selection and results interpretation, making them a vital component in combating AMR. Pathogen detection and susceptibility testing are fundamental to ensuring accurate and informed recommendations for veterinary practitioners, ultimately helping to control AMR in pets. If VDLs fail to quickly and accurately identify AMR, public health responses may be delayed or inadequate. Previous studies have demonstrated the value of data provided by VDLs in AMR monitoring.36 Between 1 January 2019 and 30 June 2020, antimicrobial susceptibility testing of several thousand Enterobacterales isolates was conducted across 21 laboratories in the USA, identifying at least 46 CRE isolates.37 Furthermore, data from the commercial VDL IDEXX were used to analyse bacterial pathogens and antimicrobial susceptibility patterns in canine urinary samples in South East Queensland, Australia, apprizing local antimicrobial stewardship efforts and ensuring effective treatment.38 The use of de-identified commercial laboratory data in large studies has been useful for assessing resistance patterns across regions and providing essential data for AMR surveillance in the veterinary community. Data contributed by ZRL, a commercial laboratory specializing in companion animal diagnostics, were valuable in the present study, offering supplementary information to CARPet, regardless of regional or temporal differences.
This study has some limitations that should be considered. First, while it includes a large dataset with broad geographical coverage, it excludes a detailed analysis of the specific causes of drug resistance, which would be essential for understanding the underlying factors contributing to AMR in clinical settings. Second, because ZRL is a commercial laboratory, specific data on antibiotic use in individual cases could not be obtained. Consequently, we could not make targeted recommendations regarding antibiotic usage or analyse the direct sources of resistance. Future studies should conduct in-depth analysis of common resistance phenotypes in pets, including the assessment of clinical antibiotic use through questionnaires during sample collection. These steps would facilitate a more comprehensive investigation into the mechanisms underlying drug resistance. Third, our study relied on the VITEK 2 COMPACT system for antimicrobial susceptibility testing, which, although widely used and reliable, has limitations. While the system incorporates expert rules for known patterns of intrinsic resistance (e.g. P. aeruginosa and Pr. vulgaris), it may not capture all instances of intrinsic resistance in certain bacterial species. For example, data are lacking on cephalosporin resistance in enterococci in the VITEK 2 database, the discrepancies for which we manually corrected. However, the closed nature of the system limits the ability to update or verify all expert rules, potentially underestimating resistance in some species. Future studies could benefit from complementary methods, such as expanded expert-rule databases, to provide a more comprehensive assessment of AMR patterns. Last, AMR data were compared with those from the CARPet and CHINET networks in China. However, the influence of differences in data collection methods across these datasets, such as sample selection, laboratory protocols and timeframes, on the comparability of the results must be noted. Thus, while these comparisons provide valuable context, they should be interpreted with caution. Moreover, the potential methodological discrepancies may affect the direct applicability of the findings across different data sources. Therefore, we emphasize the need for standardized protocols in future surveillance efforts to ensure more accurate and meaningful comparisons between datasets.
Conclusions
Companion animals have often been overlooked in discussions on AMR, primarily due to the scarcity of population-level data required for conducting epidemiological studies. Our comprehensive analysis of microbial pathogen identification and antimicrobial susceptibility patterns in companion animals in China from October 2022 to October 2023 would hopefully alleviate this data scarcity. Cats and dogs are carriers of various bacterial species, including MDR strains, which pose significant medical and public health challenges. Furthermore, commercial laboratories are crucial in addressing AMR in veterinary medical practice. The data generated by these laboratories provide a valuable foundation for AMR surveillance within the veterinary community, enabling data-driven decisions in empirical treatment and antimicrobial stewardship. Further in-depth analyses of these data will enhance the monitoring of both known and emerging AMR issues.
Funding
This study was conducted as part of routine work.
Transparency declarations
None to declare.
Author contributions
Y.L. conceptualized the review and was responsible for writing, organizing, editing, and referencing the manuscript. Y.M.Z. collected the data and prepared the figure. Y.Z., C.J., H.L., Z.L., Y.Y., and J.S. carried out the daily experimental work. S.Y. supervised the overall activities and work of the team.
Supplementary data
Tables S1–S21 and the zone diameter and MIC breakpoints used in this article are available as Supplementary data at JAC-AMR Online.
References
Author notes
Yang Liu and Yimeng Zhai co-first authors.

Comments