


Abstract
Evidence-based clinical susceptibility breakpoints have been lacking for antimicrobial agents used for diphtheria.
We aimed to evaluate broth microdilution and disc diffusion methods and create a dataset of MIC values and inhibition zone diameters (ZDs) from which breakpoints could be determined.
We included 400 recent clinical isolates equally distributed by species (Corynebacterium diphtheriae and Corynebacterium ulcerans) and by national surveillance programmes (France and Germany). Non-duplicate toxigenic and non-toxigenic isolates were chosen to enable the inclusion of a diversity of susceptibility levels for the 13 agents tested. Broth microdilution and disc diffusion, using EUCAST methodology for fastidious organisms, were used.
The distributions of MIC and ZD values were largely in agreement among methods and countries. Breakpoints to allow categorization of WT isolates as susceptible, i.e. susceptible (S) or susceptible, increased exposure (I) were determined for 12 agents. The data supported a breakpoint for benzylpenicillin and amoxicillin of resistant (R) > 1 mg/L since WT isolates were inhibited by 1 mg/L or less. WT isolates were categorized as I (S ≤ 0.001 mg/L) for benzylpenicillin, emphasizing the need for increased exposure, and S (S ≤ 1 mg/L) for amoxicillin. Erythromycin breakpoints were set at S ≤ 0.06 mg/L and R > 0.06 mg/L. The corresponding ZD breakpoints were determined for all agents except amoxicillin, for which categorization was based on benzylpenicillin results.
This work provided a large set of antimicrobial susceptibility data for C. diphtheriae and C. ulcerans, using a harmonized methodology. The dataset allowed EUCAST and experts in the diphtheria field to develop evidence-based breakpoints in January 2023.
Introduction
Diphtheria was a major scourge of humanity until the large-scale roll-out of vaccination.1 Corynebacterium diphtheriae, the classical agent of diphtheria, is highly transmissible among humans and causes outbreaks of potentially fatal respiratory disease. Cutaneous infections are endemic mainly in tropical areas, but also occasionally in underprivileged populations in other regions.2–4 Corynebacterium ulcerans is a zoonotic agent of diphtheria that is most often transmitted from household cats and dogs, and can cause infections similar to classical diphtheria, with the important difference that it is not transmissible among humans.5
Classical diphtheria, caused by toxigenic C. diphtheriae, is currently re-emerging in multiple world regions. Large outbreaks are currently ongoing or have been recently observed, e.g. in Yemen, Bangladesh, Nigeria and Guinea.6–8 In Europe, an outbreak of diphtheria among populations of migrants was reported in 2022.3,4,9 In addition, non-toxigenic isolates of C. diphtheriae can cause invasive infections and are often recovered from cutaneous infections, while C. ulcerans has been increasingly reported in some Western countries in recent years.5,10,11
Other phylogenetically related corynebacterial species are medically less prominent. The zoonotic species Corynebacterium pseudotuberculosis causes a distinct disease (lymphadenitis) and is mainly transmitted from sheep and goats.12 Although belonging to the potentially toxigenic species, C. pseudotuberculosis is extremely rare in humans and nearly always non-toxigenic. Isolates of Corynebacterium rouxii and Corynebacterium belfantii are, so far, always tox negative.13,14 Corynebacterium silvaticum isolates, so far, have all been reported as non-toxigenic toxin-gene bearing (NTTB), while the rarely isolated Corynebacterium ramonii can be tox positive or tox negative.15,16 The four latter species were recently described and are much more rarely encountered than C. diphtheriae and C. ulcerans. For practical reasons, and because they form a unique phylogenetic branch within the diversity of corynebacteria, the seven above species are grouped into the C. diphtheriae species complex (CdSC).
Although vaccination is the most effective approach to control diphtheria, coverage rates are nowadays insufficient in multiple countries or settings.1 For clinical cases, diphtheria antitoxin (DAT) is the most important treatment, which must be promptly administered to limit the effects of the diphtheria toxin, but DAT does not limit transmission of the infecting agent, and stockpiles are limited, causing procurement issues. Antimicrobial therapy is therefore critical for clinical care, for reducing transmission and for prophylactic treatment. Benzylpenicillin and erythromycin are the recommended first-line agent treatment options in diphtheria guidelines.
However, there are no consensual antimicrobial susceptibility testing (AST) methods and interpretations for the agents of diphtheria. First, there has been a lack of erythromycin breakpoints. Second, CLSI published the first standardized recommendations for antibiotic susceptibility testing of Corynebacterium spp. (including C. diphtheriae) in 2006, but its proposed penicillin-susceptible breakpoint was changed in 2015.17 Third, EUCAST published its first Corynebacterium spp. (except C. diphtheriae) recommendations in 2014 (EUCAST Breakpoint Tables, version 4.0; https://www.eucast.org/clinical_breakpoints) and updated them by including C. diphtheriae in 2016 (version 6.0). In 2019 (version 9.0), C. diphtheriae was excluded again from Corynebacterium breakpoints. Fourth, interpretations are based on data from other clinically relevant Corynebacterium spp. with higher resistance rates, for example Corynebacterium jeikeium. This somewhat confusing situation has been maintained until now, in part due to the lack of large series of data from epidemiologically representative isolates, using a harmonized and controlled methodology. Recently, Marosevic et al.18 analysed a large series of C. diphtheriae and C. ulcerans isolates for MIC of 12 antimicrobial agents and proposed tentative epidemiological cut-off values, but unfortunately, the erythromycin distribution was truncated.
Here, we aimed to generate data that would enable definition of diphtheria breakpoints using recent clinical isolates. We focused on generating MIC and zone diameter (ZD) distributions for C. diphtheriae and C. ulcerans, the two aetiological agents of diphtheria, and used clinical isolates from two European reference laboratories in two countries. Both centres had accumulated large isolate collections with AST data, enabling us to pick isolates representative of a range of MIC values for each antimicrobial class. A standardized methodology was assessed and validated based on well-established EUCAST guidelines and processes. The generated data were shared with the EUCAST Steering Committee and subjected to public consultation, leading to proposed and eventually accepted breakpoints that could be included in the EUCAST Breakpoint Tables v. 13.0, January 2023.
Materials and methods
Set-up of a harmonized methodology
To define a single methodology and to control for the quality of materials and procedures, a pilot study organized by the EUCAST Development Laboratory (EDL) aimed to introduce EUCAST methodology and quality requirements in both reference laboratories (France and Germany). Several practice and calibration runs were performed. A collection of Corynebacterium spp., comprising C. diphtheriae, C. pseudodiphtheriticum, C. striatum and C. ulcerans isolates, carefully selected for representativeness of technical challenges in growth and reading, and with reproducible reference broth microdilution (BMD) results (MIC, mg/L) and disc diffusion results (ZD), was created and distributed from the EDL to the two reference laboratories, together with BMD panels, Mueller–Hinton Fastidious (MH-F) broth and antimicrobial discs. MH-F plates were procured by each laboratory. Testing at the trial sites was blinded. Results were analysed by the EDL and feedback provided to the two participant laboratories. Testing was continued until results, both for MICs and disc diffusion, agreed across the three laboratories. Streptococcus pneumoniae ATCC 49619 was included at each test occasion as quality control (QC).
C. diphtheriae and C. ulcerans isolates
A total of 400 clinical isolates, 100 isolates each of C. diphtheriae and C. ulcerans for each site, were included. Toxigenic (tox+) and non-toxigenic (tox−) strains, with and without previously reported resistance to any of the agents in the study, were included. The ones with previous AST data were chosen to represent a wide range of MIC or ZD values. In France, the clinical C. diphtheriae isolates (62 tox−; 38 tox+) were collected from humans (n = 99; for 1 isolate the origin was unknown), over the years 1951–2017, and the included C. ulcerans clinical isolates (50 tox−; 50 tox+) were collected from humans (n = 60) and animals (n = 40; 18 cats; 20 dogs; 1 horse; 1 rat) over the years 2015–20. In Germany, the included clinical C. diphtheriae isolates (54 tox−; 46 tox+) were collected from humans (n = 96) and animals (n = 4) over the years 2010–21, and the included C. ulcerans clinical isolates (39 tox−; 61 tox+) were collected from humans (n = 74) and animals (n = 26; 5 cats; 8 dogs) over the years 2010–21. For QC, S. pneumoniae ATCC 49619 was used both for disc diffusion and MIC determination.
AST
Both laboratories used the same lots of BMD panels (Sensititre, Thermo Scientific, UK, custom-made), MH-F broth (in-house produced from BD Difco broth) and antimicrobial discs (Thermo Fisher Scientific, Basingstoke, UK). Local MH-F medium was used for disc diffusion: in France, in-house-produced BD Difco MH-F plates (circular 90 mm); in Germany, commercial pre-poured bioMérieux MH-F plates (square 120 × 120 mm). Disc diffusion was performed according to EUCAST methodology for fastidious organisms, identical to the method recommended for other species of corynebacteria.19 BMD (MIC; mg/L) was performed according to ISO 20776-1 using MH-F broth. BMD and disc diffusion were performed in parallel using the same inoculum suspension. A few C. diphtheriae isolates (n = 12) with cefotaxime BMD MICs above the highest concentration on the panel (2 mg/L) were retested with cefotaxime gradient strips (ETEST, bioMérieux, Marcy-l’Étoile, France).
Antibiotic concentration ranges in MIC panels, and disc content, are shown in Table 1. The antimicrobial agents included in the study were agreed with the EUCAST Steering Committee. For benzylpenicillin, the disc content (potency) of 1 IU was used.
Antimicrobial agents, disc potencies and MIC ranges for BMD panels
| Antimicrobial agent | Disc content (potency) (µg) | MIC range on Sensititre BMD panel (mg/L) |
|---|---|---|
| Benzylpenicillin | 1 IU | 0.016–2 |
| Ampicillin | 2 | NA |
| Amoxicillin | NT | 0.016–2 |
| Cefotaxime | 5 | 0.016–2 |
| Meropenem | 10 | 0.016–2 |
| Ciprofloxacin | 5 | 0.03–4 |
| Erythromycin | 15 | 0.008–2 |
| Clindamycin | 2 | 0.03–8 |
| Doxycycline | NT | 0.03–2 |
| Tetracycline | 30 | 0.06–4 |
| Linezolid | 10 | 0.06–4 |
| Rifampicin | 5 | 0.008–2 |
| Trimethoprim/sulfamethoxazole | 1.25–23.75 | 0.125–8 |
NT, not tested (discs for amoxicillin and doxycycline are not part of the EUCAST disc diffusion testing methods for other organisms); NA, not available.
Data analysis
MIC distributions and MIC versus ZD correlation graphs were generated for each antimicrobial agent for C. diphtheriae and C. ulcerans separately. The MIC versus ZD correlation graphs were analysed visually to ensure that (i) the putative WT isolates formed a Gaussian-shaped normal distribution and (ii) populations with and without resistance mechanisms clearly distinguishable by MIC were also clearly distinguishable by inhibition ZD. The MIC distributions were presented to the EUCAST Steering Committee and were used, together with other relevant information, to establish clinical MIC breakpoints. ZD breakpoints, corresponding to the EUCAST clinical MIC breakpoints, were established with the aim to avoid reporting isolates as falsely susceptible. The numbers of false-susceptible and false-resistant results for the disc diffusion method were calculated for each species–agent combination.
Results
QC
QC testing was performed with S. pneumoniae ATCC 49619. The results showed that 95.6% (241/252) and 98.0% (294/300) of MICs and 92.7% (191/206) and 96.5% (251/260) of disc diffusion results were within the QC ranges at the German and French laboratories, respectively. MIC and inhibition ZD distributions for the QC strain per site are presented in Table S1(a and b) (available as Supplementary data at JAC Online).
MIC distributions
The distributions of MIC values obtained per test site for each species–agent combination are presented in Figure 1 for benzylpenicillin, erythromycin and tetracycline, and in Figure S1 for all agents. The distributions of MIC values based on aggregated data from the two reference laboratories are summarized in Tables 2 and 3 for C. diphtheriae and C. ulcerans, respectively.
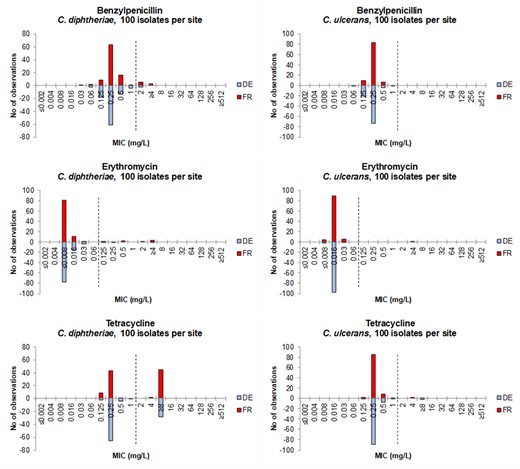
MIC distributions per test site for benzylpenicillin, erythromycin and tetracycline for C. diphtheriae isolates (to the left) and C. ulcerans isolates (to the right). DE = Germany (blue bars), FR = France (red bars). EUCAST MIC breakpoints (EUCAST Breakpoint Tables v. 13.1) are shown as dotted lines (I/R for benzylpenicillin, S/R for erythromycin and tetracycline).
MIC distributions (mg/L) for C. diphtheriae (n = 200) based on aggregated data from testing at two laboratories (100 isolates each)
| Antimicrobial agent | 0.008 | 0.016 | 0.03 | 0.06 | 0.125 | 0.25 | 0.5 | 1 | 2 | 4 | 8 | 16 |
|---|---|---|---|---|---|---|---|---|---|---|---|---|
| Benzylpenicillin | 1 | 4 | 27 | 124 | 29 | 5 | 7 | 3 | ||||
| Amoxicillin | 1 | 2 | 15 | 116 | 53 | 7 | 3 | 3 | ||||
| Cefotaxime | 1 | 31 | 166 | 2 | ||||||||
| Meropenem | 3 | 23 | 144 | 21 | 8 | 1 | ||||||
| Ciprofloxacin | 6 | 152 | 22 | 4 | 9 | 3 | 1 | 1 | 2 | |||
| Erythromycin | 158 | 26 | 5 | 2 | 1 | 2 | 1 | 4 | ||||
| Clindamycin | 4 | 34 | 135 | 20 | 2 | 5 | ||||||
| Doxycycline | 5 | 104 | 17 | 10 | 8 | 4 | 52 | |||||
| Tetracycline | 11 | 108 | 5 | 1 | 2 | 73 | ||||||
| Linezolid | 1 | 190 | 6 | 3 | ||||||||
| Rifampicin | 179 | 7 | 2 | 3 | 9 | |||||||
| Trimethoprim/sulfamethoxazole | 116 | 15 | 4 | 7 | 12 | 10 | 9 | 27 |
Truncated MIC distributions are indicated by an extremity in italics, and isolates resistant by EUCAST breakpoints are in bold.
MIC distributions (mg/L) for C. ulcerans (n = 200) based on aggregated data from testing at two laboratories (100 isolates each)
| Antimicrobial agent | 0.008 | 0.016 | 0.03 | 0.06 | 0.125 | 0.25 | 0.5 | 1 | 2 | 4 | 8 | 16 |
|---|---|---|---|---|---|---|---|---|---|---|---|---|
| Benzylpenicillin | 1 | 31 | 156 | 11 | 1 | |||||||
| Amoxicillin | 27 | 164 | 9 | |||||||||
| Cefotaxime | 11 | 175 | 14 | |||||||||
| Meropenem | 16 | 127 | 53 | 3 | 1 | |||||||
| Ciprofloxacin | 5 | 151 | 16 | 19 | 2 | 1 | 2 | 3 | 1 | |||
| Erythromycin | 6 | 187 | 6 | 1 | ||||||||
| Clindamycin | 1 | 3 | 10 | 78 | 106 | 1 | 1 | |||||
| Doxycycline | 1 | 121 | 72 | 3 | 2 | 1 | ||||||
| Tetracycline | 3 | 174 | 16 | 2 | 2 | 3 | ||||||
| Linezolid | 80 | 119 | 1 | |||||||||
| Rifampicin | 200 | |||||||||||
| Trimethoprim/sulfamethoxazole | 185 | 14 | 1 |
Truncated MICs distributions are indicated by an extremity in italics, and isolates resistant by EUCAST breakpoints are in bold.
The data were highly consistent between the two laboratories, implying that the populations of isolates included from both countries had closely similar MIC ranges and distributions (Figure S1). Median MIC values for the WT distributions were identical between the two laboratories, except for C. ulcerans with doxycycline, for which the median was one dilution higher in the French laboratory (Figure S1p). It was notable that clindamycin was inherently less active against C. ulcerans (Figure S1n), whereas the other agents had very comparable WT MIC distributions for the two species.
The following distributions appeared unimodal, hence with an absence of apparent acquired-resistance isolates: linezolid for C. diphtheriae; linezolid, benzylpenicillin, amoxicillin, cefotaxime, rifampicin and trimethoprim/sulfamethoxazole for C. ulcerans.
Correlation between MICs and ZD values
We next analysed the correlation between MICs and ZDs for each species–agent combination, based on aggregated data from both sites. MIC versus ZD distributions were produced for each species, as shown for benzylpenicillin, erythromycin and tetracycline in Figure 2 and for all tested agents in Figure S2.
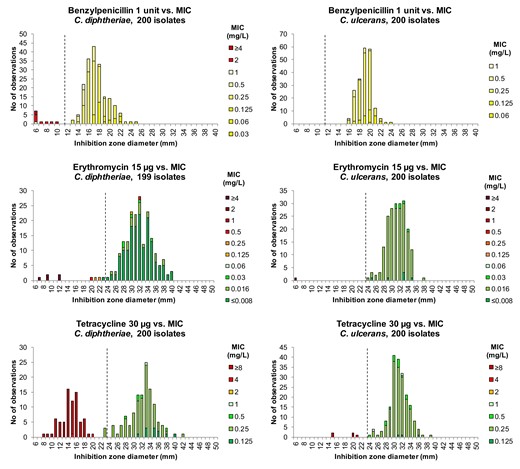
Inhibition ZD distributions for benzylpenicillin, erythromycin and tetracycline for C. diphtheriae isolates (to the left) and C. ulcerans isolates (to the right), showing aggregated data from two laboratories (n = 100 isolates per species per site). Corresponding MIC values on Sensititre panels are shown as coloured bars according to EUCAST MIC breakpoints: susceptible (S) = green, susceptible, increased exposure (I) = yellow and resistant (R) = orange/red. EUCAST zone diameter breakpoints are indicated by dotted lines (I/R for benzylpenicillin, S/R for erythromycin and tetracycline).
The concordance between MIC and ZD values was excellent for all agents tested. Isolates categorized as susceptible (S), or ‘susceptible, increased exposure’ (I) where no S category exists, were separated by ZD values, from isolates categorized as resistant (R) with the clinical MIC breakpoints. ZD breakpoints were proposed by visual examination of the MIC–ZD correlation graphs (see, for example, Figure 2), considering the aim to avoid reporting isolates as falsely susceptible. Error rates for the proposed ZD breakpoints versus BMD MICs were low (Table 4).
Errors observed for proposed ZD breakpoints versus reference BMD MICs
| C. diphtheriae (n = 200) | C. ulcerans (n = 200) | |||||||
|---|---|---|---|---|---|---|---|---|
| Antimicrobial agent | No. of susceptiblea isolates | No. of resistantb isolates | No. of false-susceptiblec results | No. of false-resistantd results | No. of susceptiblea isolates | No. of resistantb isolates | No. of false-susceptiblec results | No. of false-resistantd results |
| Benzylpenicillin | 190 | 10 | 0 | 1 | 200 | 0 | NA | 0 |
| Cefotaxime | 198 | 2 | 0 | 2 | 200 | 0 | NA | 0 |
| Meropenem | 199 | 1 | 0 | 4 | 199 | 1 | 0 | 1 |
| Ciprofloxacin | 193 | 7 | 1 | 4 | 193 | 7 | 0 | 7 |
| Erythromycin | 189 | 10 | 2 | 1 | 199 | 1 | 0 | 0 |
| Clindamycin | 195 | 5 | 0 | 1 | — | — | — | — |
| Tetracycline | 125 | 75 | 0 | 3 | 195 | 5 | 0 | 0 |
| Linezolid | 200 | 0 | NA | 0 | 200 | 0 | NA | 3 |
| Rifampicin | 191 | 9 | 0 | 0 | 200 | 0 | NA | 0 |
| Trimethoprim/sulfamethoxazole | 135 | 65 | 0 | 8 | 200 | 0 | NA | 0 |
NA, not applicable since no resistant isolates were included.
aCategorized as susceptible (S) or susceptible, increased exposure (I) according to MIC.
bCategorized as resistant (R) according to MIC.
cSusceptible (S) or susceptible, increased exposure (I) with disc diffusion; resistant (R) with BMD.
dResistant (R) with disc diffusion; susceptible (S) or susceptible, increased exposure (I) with BMD.
Inferred susceptibility to other β-lactams from benzylpenicillin
The correlation between the benzylpenicillin 1 IU disc and MIC values for other β-lactam agents for C. diphtheriae and C. ulcerans was investigated (Figure S3). Disc diffusion with the benzylpenicillin 1 IU disc (ZD breakpoint R < 12 mm) was able to detect all isolates with non-WT MICs to benzylpenicillin, amoxicillin, cefotaxime and meropenem (Figure S3).
Discussion
The datasets previously used to suggest breakpoints for corynebacteria were either incomplete, because of truncated concentration series, or did not include the two most important species that cause diphtheria. Hence, the agents used for diphtheria were excluded from the EUCAST breakpoint tables (Breakpoint Tables v. 4.0, 2014). In recent attempts to provide epidemiological cut-offs,18,20 the methodology used was not generally accepted. Therefore, evidence-based breakpoints of C. diphtheriae and C. ulcerans have been missing. In addition, breakpoints for benzylpenicillin have been under discussion.17 The lack of agreed methodology and breakpoints has confused knowledge on the prevalence and geographical distribution of resistance to antimicrobial agents. Indeed, it is difficult to interpret most previous studies reporting resistance, given the uncontrolled methodology and because the raw MIC or ZD values are typically not provided. This confusion is illustrated by highly inconsistent reports on benzylpenicillin susceptibility, with some studies reporting most or all isolates as resistant,21 whereas other studies report very few resistant isolates.18,20 Here, we aimed to generate data that would enable definition of breakpoints for C. diphtheriae and C. ulcerans, using at the same time, large representative datasets generated from recent clinical isolates, and a standardized methodology. The resurgence of diphtheria in low- and middle-income countries (LMICs) (mostly due to C. diphtheriae) and in Western countries (often caused also by C. ulcerans), underlines the timeliness of defining breakpoints based on firm evidence.
A pilot study was conducted to ensure reproducibility and comparability of the generated MIC and ZD values across three laboratories. Controlling for agar depth, inoculation quantities and methods, and drying of MH-F plates were shown to be important to reach comparability, and were adjusted accordingly in the harmonized procedure.
Following the defined EUCAST methodology, we generated distributions of MIC and ZD values using two large and independent sets of clinical isolates from two national surveillance programmes. The distributions were remarkably consistent between countries, providing confidence in the dataset and supporting its use as a basis for breakpoint definitions.
Based on the observed MIC and ZD distributions and correlations, EUCAST proposed clinical MIC breakpoints and disc diffusion correlates for routine susceptibility testing of the 12 agents including benzylpenicillin and erythromycin, the two first-line agents recommended by WHO. The breakpoints proposed by EUCAST were subjected to public consultation, leading to proposed, and eventually accepted, breakpoints, which were included in the EUCAST Breakpoint Tables v. 13.0, 2023. Following the present work, benzylpenicillin breakpoints for the other corynebacteria were changed to S ≤ 0.001/R > 1 mg/L from v. 14.0 of the breakpoint tables (EUCAST Breakpoint Tables v 14.0, preliminary version, 5 December 2023.). A table with an overview of the EUCAST breakpoints and their comparison with CLSI breakpoints is provided (Table 5). As is evident, there are several major differences, which from an international public health angle would benefit from a discussion with the aim to harmonize between the two committees. It should be noted that CLSI breakpoints are common for all corynebacteria, whereas EUCAST breakpoints for C. diphtheriae and C. ulcerans are specific for these species and separated from breakpoints for other Corynebacterium species.
Comparison of EUCAST and CLSI MIC breakpoints (mg/L) for C. diphtheriae and C. ulcerans
| Antimicrobial agent | EUCAST MIC breakpointsa for C. diphtheriae and C. ulcerans (S ≤ /R>) | CLSI MIC breakpointsb for Corynebacterium spp. including C. diphtheriae (S ≤ /R>) |
|---|---|---|
| Benzylpenicillin | 0.001/1 | 0.125/2 |
| Amoxicillin | 1/1 | — |
| Cefotaxime | 0.001/2 | 1/2 |
| Meropenem | 0.25/0.25 | 0.25/0.5 |
| Ciprofloxacin | 0.001/0.5 | 1/2 |
| Erythromycin | 0.06/0.06 | 0.5/1 |
| Clindamycin | 0.5/0.5c | 0.5/2c |
| Doxycycline | 0.5/0.5 | 4/8 |
| Tetracycline | 1/1 | 4/8 |
| Linezolid | 2/2 | 2/- |
| Rifampicin | 0.06/0.06 | 1/2 |
| Trimethoprim/sulfamethoxazole | 0.5/0.5 | 2/2 |
aEUCAST Breakpoint Tables for Interpretation of MICs and Zone Diameters v. 13.1, 2023 and v. 14.0, 2024.
bCLSI M45—Methods for Antimicrobial Dilution and Disk Susceptibility Testing of Infrequently Isolated or Fastidious Bacteria. Third Edition, 2015. In this table, CLSI breakpoints are expressed in the EUCAST format (S≤, R>) for comparison.
cBreakpoints apply to C. diphtheriae only.
For species–agent combinations where there is clinical evidence and practice with WT isolates, i.e. isolates lacking any evidence of phenotypically detectable acquired resistance, the general EUCAST principle for setting breakpoints for an agent to a species is to primarily assign a susceptibility category of S or I to WT isolates and to then, depending on clinical evidence, tradition and experience, pharmacokinetic/pharmacodynamic (PK/PD) data, dosing traditions etc., categorize non-WT isolates with MICs above a defined level as R.
When comparing C. diphtheriae and C. ulcerans, MIC values showed highly similar distributions, with the notable difference of clindamycin, which was inherently less active to C. ulcerans, as previously reported.18 Hence, no clindamycin breakpoint was proposed for C. ulcerans. The mechanism by which most C. ulcerans are resistant to clindamycin deserves further investigation. For other agents, although the WT distribution was almost identical, the C. diphtheriae dataset included more isolates with acquired resistance, most notably to benzylpenicillin, erythromycin, tetracycline and trimethoprim/sulfamethoxazole (Figures 1 and 2, Figures S1 and S2). This was consistent with our choice to include isolates with acquired resistance mechanisms that were previously described in this species, including pbp2m, erm(X), tet(33), tet(O), tet(W) and sul1.22
The precision of disc diffusion and its ability to predict resistance was high, as the observed false-positive and false-negative results were very low (Table 4). This result is important, as it indicates that the disc diffusion method, which is easier and less expensive than MIC determination, is suitable as a first-line method to define susceptibility. Error rates with ZD values were very low and almost always false resistant (major error; ME) and very rarely false susceptible (very major error; VME). For clinical purposes, in most cases reporting the actual MIC value will rarely be helpful; therefore, susceptibility can be reported as S, I or R, based on the disc diffusion result. In a routine surveillance workflow, in outbreak situations and for research purposes, MIC determination would be needed only for resistant isolates as determined by disc diffusion.
Interestingly, benzylpenicillin susceptibility can be used to predict susceptibility to other (more potent) β-lactam agents. This enables a penicillin screening testing strategy; since most isolates will be in the WT distribution for β-lactams, these can, without further testing, be reported as S to amoxicillin and meropenem and/or I to cefotaxime, based on the benzylpenicillin test result. Only the few benzylpenicillin-resistant isolates should then also be tested for other β-lactam agents. Similarly, tetracycline can be used to infer susceptibility to doxycycline.
This study has two limitations. First, the isolate collection comprised isolates from two neighbouring European countries. However, these were large collections of isolates, deduplicated with respect to epidemiological links, and it was shown that the phylogenetic diversity of surveillance isolates from these countries is highly representative of the global diversity of phylogenetic sublineages that circulate elsewhere.22,23 However, more geographically representative collections of isolates should be characterized in the future to confirm the WT MIC distributions that were found herein. Second, other species of the CdSC, including C. pseudotuberculosis, C. belfantii, C. rouxii and C. silvaticum, were not tested. These species either cause other infections (C. pseudotuberculosis), are tox negative (C. rouxii and C. belfantii) or are rare zoonotic non-toxigenic species (C. silvaticum). Given their phylogenetic and biological proximity, it can be expected that the proposed breakpoints for C. diphtheriae and C. ulcerans may be applied to these species too. However, future studies should test this hypothesis, as there might be exceptions, as illustrated here for clindamycin, which differs in its potency against C. diphtheriae and C. ulcerans.
Given the critical importance of antimicrobial therapy and prophylaxis in diphtheria clinical care and transmission control, and the increasing reporting of MDR tox-positive C. diphtheriae isolates,22,24,25 the EUCAST breakpoints determined based on the data of this work appear as a timely addition to the response against the resurgence of diphtheria. They should be useful to guide clinical handling of patients and their contacts, to harmonize surveillance data, and to prioritize outbreak control efforts towards limiting the spread of MDR C. diphtheriae sublineages.
Acknowledgements
Parts of the results from this study have been presented as a poster at the 33rd ECCMID, Copenhagen, Denmark, 2023 (Åhman J, Brisse S, Badell E, Marosevic D, Berger A, Sing A, Matuschek E and Kahlmeter G, Corynebacterium diphtheriae and C. ulcerans—Development of clinical breakpoints using EUCAST methodology. Poster no. 0348).
The French participant laboratory authors would like to thank Annie Carmi-Leroy and Sylvie Brémont for expert laboratory assistance. The German participant laboratory authors thank Wolfgang Schmidt, Andrea Seifarth, Helga Kocak and Turgut-Cengiz Dedeoglu for expert laboratory assistance.
Funding
The National Reference Center for Corynebacteria of the Diphtheriae Complex is supported financially by Santé publique France (Public Health France) and Institut Pasteur. The EUCAST Development Laboratory is supported by the European Society of Clinical Microbiology and Infectious Diseases (ESCMID). The German National Consiliary Laboratory on Diphtheria is supported by the German Federal Ministry of Health via the Robert Koch-Institute and its National Reference Laboratories Network (09-47, FKZ 1369-359). This research was funded, in whole or in part, by Institut Pasteur and Santé publique France. For the purpose of open access, the authors have applied a CC-BY public copyright license to any Author Manuscript version arising from this submission.
Transparency declarations
The authors declare no conflicts of interest.
Author contributions
J.Å., E.M. and G.K. (EUCAST Development Laboratory) were responsible for study design, data analysis and QC of materials; J.Å. produced the summary figures and tables; E.B. performed the experiments and produced the data in the French participant laboratory, with help from N.Z; A.B. performed the experiments and produced the data in the German participant laboratory; S.B. proposed the study, coordinated the French laboratory activities, and wrote the first draft of the manuscript with input from J.Å; A.S. coordinated the German laboratory; all authors contributed to the writing of the manuscript and approved the final version.
Supplementary data
Figures S1 to S3 and Table S1 are available as Supplementary data at JAC Online.
References
Author notes
Anja Berger, Edgar Badell and Jenny Åhman contributed equally.
G.K., A.S. and S.B. co-supervised the work.
