


Abstract
Reducing antibiotic use is central to antimicrobial stewardship, but may have unintended consequences.
To examine associations between size of decline in antibiotic prescriptions in general practices and (i) rate of hospitalization for infection and (ii) patient satisfaction.
Routine data analysis for all general practices in Scotland, quarter one 2012 (Q1 2012) to quarter one 2018 (Q1 2018). Practices were grouped into quartiles of rate of change in prescribing and changes in rates of hospitalization were compared across groups. For satisfaction analysis, associations between practice-level patient satisfaction in 2017–18 (Scottish Health and Care Experience Survey) and prior change in antibiotic prescription were examined.
Antibiotic prescriptions overall fell from 194.1 prescriptions/1000 patients in Q1 2012 to 165.3 in Q1 2018 (14.9% reduction). The first quartile of practices had a non-significant increase in prescriptions [change per quarter = 0.22 (95% CI −0.42 to 0.86) prescriptions/1000 patients], compared with large reductions in the other three groups, largest in quartile four: −2.95 (95% CI −3.66 to −2.24) prescriptions/1000 patients/quarter (29.7% reduction overall). In all quartiles, hospitalizations with infection increased. The increase was smallest in quartile four (the biggest reduction in prescriptions) and highest in quartile one (no significant change in prescriptions): 2.18 (95% CI 1.18 to 3.19) versus 3.68 (95% CI 2.64 to 4.73) admissions/100 000 patients/quarter, respectively [difference = − 1.50 (95% CI −2.91 to −0.10)]. There was no statistically significant association between change in antibiotic prescriptions and patient satisfaction.
Very large reductions in antibiotic prescriptions in Scottish general practices have not been associated with increases in hospitalization with infection or changes in patient satisfaction.
Introduction
Antimicrobial resistance is one of the biggest challenges faced by health systems across the world. Inappropriate use and overuse of antibiotics in humans is a major driver of antimicrobial resistance.1 Antimicrobial stewardship initiatives globally encourage prescribing of antibiotics only for patients who need them, with the aim of reducing unnecessary prescribing, while ensuring that those who need antibiotics still get them.2 Primary care (community ambulatory care) is where the majority of antibiotics are prescribed globally,3 with primary care accounting for 82.9% of all antibiotic use in Scotland in 2019.4 A significant proportion of primary care antibiotic prescribing is unnecessary5 and primary care is therefore a key target for antimicrobial stewardship interventions. There is evidence that such interventions are effective at reducing prescribing6,7 and some evidence of subsequent stabilizing or reductions in clinically important antimicrobial resistance.8
Potential adverse unintended effects of decreasing antibiotic prescribing must be considered alongside benefits, such as reducing antibiotic resistance or reducing other adverse effects of prescribing (such as Clostridioides difficile infection).9 In particular, there is concern that decreasing antibiotic prescribing in primary care may result in increased hospitalizations for more severe infections if treatment is delayed in people with more severe infections. Gulliford et al.10 reported that lower rates of antibiotic prescribing for respiratory tract infections at practice level were associated with slightly higher rates of pneumonia and peritonsillar abscess, but not increased rates of meningitis or intracranial abscess. Balinskaite et al.11 found that an antimicrobial stewardship intervention in England that financially rewarded primary care providers for targeted reductions in antibiotic prescribing had no overall effect on the rate of overall hospital admissions with infection, although at the level of specific conditions, such as quinsy, some associations were seen. The authors were wary of concluding these effects were due to the targeted decreases in antibiotic prescribing, attributing them to confounders, such as policy changes or the small numbers of cases.
There have also been concerns that decreasing antibiotic prescribing could lead to reduced patient satisfaction with primary care providers. In cross-sectional analysis, Ashworth et al.12 found that practices with lower than average antibiotic prescription rates had lower patient satisfaction. Perceived risk of a decrease in patient satisfaction and trust could be a barrier to primary care physicians (GPs) changing their prescribing behaviour.
The Scottish Antimicrobial Prescribing Group was established in Scotland in 2008 to co-ordinate and lead antimicrobial stewardship nationally, with a range of interventions implemented.13 Antibiotic use in primary care in Scotland (excluding dentistry) has been falling steadily in recent years with a 9.1% decrease in total antibiotic use in primary care between 2015 and 2019.4 However, there is considerable variation in how antibiotic prescribing has changed at individual GP practice level. The aim of this study is to examine how varying changes in antibiotic prescribing at GP practice level are associated with hospitalizations for infections and patient satisfaction.
Methods
Study design
The overall design is a longitudinal analysis of Scottish primary care practice-level data per calendar quarter from the first quarter of 2012 to the first quarter of 2018, examining associations between change in antibiotic prescriptions and both hospital admissions with infection and patient satisfaction with the practice.
Data
All data analysed were sourced from the NHS Scotland Information Services Division14,15 or Scottish Government.16 Quarterly data were available at practice level for antibiotic prescriptions. Admissions data were not available at practice level because small numbers of patients admitted per practice per quarter created unacceptable risks of identifying individual patients, so these were provided at group level where the groups were defined as four groups with equal numbers of practices (quartiles) with progressively increasing reductions in antibiotic use. Practice-level patient satisfaction data were obtained from the NHS Scotland Health and Care Experience Survey.17 The survey is distributed every 2 years by the Scottish Government to a random sample of people registered with each general practice in Scotland, with the minimum number of respondents dependent on practice size. The 2017–18 survey sampled 611 638 people, with 132 972 (22%) responding. The survey aims to improve care nationally and locally, informing both national planning and structured feedback to individual practices.17 Data were analysed for practices that were in existence for the entire period from calendar quarter one 2012 (Q1 2012) to quarter one 2018 (Q1 2018). Hospital admissions with infection were defined using Scottish Morbidity Records 01 (SMR01) data where the infection code was in the primary position.18 This included admissions with pneumonia, COPD, cellulitis, urinary tract infection, sepsis, mastoiditis and peritonsillar abscess. The ICD-10 codes included for each admission type are listed in Table S1 (available as Supplementary data at JAC Online).
Antibiotic prescriptions
Practice-level dispensed antibiotic prescription rates were calculated as the total number of antibiotic items prescribed from that practice and subsequently dispensed by a community pharmacist or dispensing GP practice (‘prescriptions’) in a quarter divided by the total number of registered patients in that quarter. For each practice in the dataset, the rate of change in antibiotic prescriptions was estimated in a linear regression model with total antibiotic prescriptions as the independent variable. Practices were ranked in ascending order of rate of change in total antibiotic prescriptions then grouped into quartiles of rate of change in prescriptions (four groups with equal numbers of practices).
Hospitalizations
The rate of hospital admissions was calculated for practices in each prescription quartile as the number of admissions with infection per 100 000 registered patients, for all included infection admissions and for specific infections (see above). Linear regression was used to estimate change in admissions per quarter between Q1 2012 and Q1 2018, and to examine change in admissions in the three quartiles of practices with reductions in antibiotic prescriptions compared with the quartile with no significant change.
Patient satisfaction
The outcome for the satisfaction analysis was the percentage of respondents with a positive response (excellent or good) to the question ‘Overall, how would you rate the care provided by your GP surgery?’ in the 2017–18 NHS Scotland Health and Care Experience Survey. Analysis of associations between change in antibiotic prescriptions from 2012 to 2018 and patient satisfaction in 2017–18 used linear regression analysis of practice-level data, with adjustment for practice list size (continuous variable), baseline satisfaction in 2011–12 (continuous variable), age of practice population (percentages aged <5 and ≥65 years as continuous variables), location (categorized into urban area, small town or rural area) and socioeconomic deprivation [categorized into quintiles based on the average Scottish Index of Multiple Deprivation (SIMD) of registered patients].19 All factors were included in adjusted models regardless of significance in univariate analyses as all were considered relevant.
Ethics, permissions and software
Ethical approval was not required for this study as all data were publicly available and subject to standard NHS Scotland procedures to ensure no risk of individual patient identification. Data analysis used R Studio version 3.6.0 (2019-04-26).
Results
Eight hundred and seventy-six practices with data available over the entire study period were included, with mean list size 6008 (SD 3459) accounting for 93% of Scottish practices and 92% of registered patients in 2018.20 Practices were predominately located in urban areas (66.0%), with 18.9% of registered patients aged ≥65 years and 5.0% aged <5 years.
Across all practices, antibiotic prescriptions fell by 14.9% (95% CI −15.1 to −14.6), reducing by 28.8 prescriptions per 1000 registered patients, from 194.1 in Q1 2012 to 165.3 in Q1 2018. From linear regression the rate of change was −1.24 (95% CI −1.89 to −0.60) prescriptions per 1000 registered patients per quarter. At practice level, the median change in prescriptions was −14.7%, but with considerable variation between practices (IQR −24.4% to −3.7%), with 18.2% of practices having an increase in their antibiotic prescription rate.
Antibiotic prescription quartiles
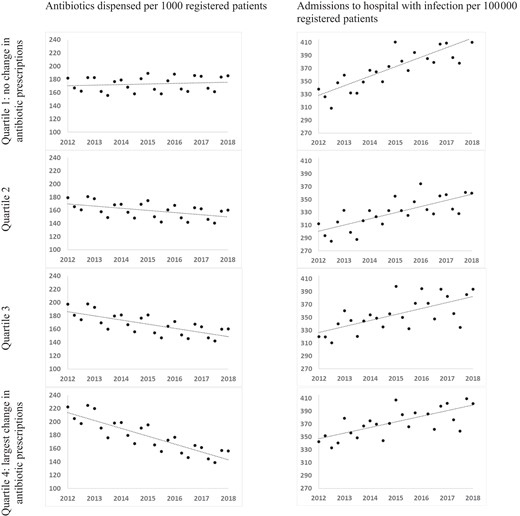
In the quartile of practices with the lowest rate of change in prescription (quartile one), the change per quarter was not statistically significantly different from zero at 0.22 (95% CI −0.42 to 0.86) prescriptions per 1000 patients per quarter. There were statistically significant reductions in quartile two [−0.82 (95% CI −1.42 to −0.22) prescriptions/1000/quarter], quartile three [−1.56 (95% CI −0.20 to −0.91) prescriptions/1000/quarter] and quartile four [−2.95 (95% CI −3.66 to −2.24) prescriptions/1000/quarter] (Table 1). The two prescription quartiles with the largest reductions had higher baseline prescribing in Q1 2012 (197.3 and 222.2 prescriptions/1000 patients in quartiles three and four, respectively) than the two prescription quartiles with the smaller reductions (181.7 and 179.4 in quartiles one and two, respectively). Overall, across the whole period from Q1 2012 to Q1 2018, prescription rates rose slightly in quartile 1 (an increase of 2.0%), but fell substantially by 10.6% in quartile 2, 18.7% in quartile 3 and 29.7% in quartile 4 (Table 1 and Figure 1).
Antibiotic prescriptions and hospital admissions between 2012 and 2018 in each quartile of prescribing change.
Descriptive statistics for all practices and by quartile of change in antibiotic prescriptions
| Variable | All practices, N = 876 | Quartile 1: no change in antibiotic prescriptions, N = 218 | Quartile 2, N = 219 | Quartile 3, N = 219 | Quartile 4: largest decrease in antibiotic prescriptions, N = 220 |
|---|---|---|---|---|---|
| List size, mean (SD) | 6008 (3459) | 5571 (3547) | 6853 (3489) | 6323 (3483) | 5288 (3100) |
| Percentage of registered patients ≥65 years old, mean (SD) | 18.9 (5.6) | 19.8 (5.5) | 18.1 (5.6) | 18.6 (5.5) | 19.2 (5.8) |
| Percentage of registered patients <5 years old, mean (SD) | 5 (1.2) | 4.6 (1.2) | 4.8 (1.1) | 4.7 (1.1) | 4.6 (1.3) |
| Practice urban–rural classification, n (%) | |||||
| urban | 578 (66.0) | 138 (63.3) | 158 (72.1) | 150 (68.5) | 132 (60.0) |
| small town | 119 (13.6) | 36 (16.5) | 25 (11.4) | 32 (14.6) | 26 (11.8) |
| rural | 179 (20.4) | 44 (20.2) | 36 (16.4) | 37 (16.9) | 62 (28.2) |
| Practice quintile of deprivation, n (%)a | |||||
| 1 (most deprived) | 174 (20) | 44 (20.4) | 39 (17.8) | 39 (17.8) | 52 (23.6) |
| 2 | 174 (20) | 63 (29.2) | 27 (12.3) | 46 (21.0) | 38 (17.3) |
| 3 | 174 (20) | 37 (17.1) | 49 (22.4) | 41 (18.7) | 47 (21.4) |
| 4 | 174 (20) | 39 (18.1) | 41 (18.7) | 45 (20.5) | 49 (22.3) |
| 5 (most affluent) | 174 (20) | 33 (15.3) | 62 (28.3) | 46 (21.0) | 33 (15.0) |
| Antibiotic prescribing rate/1000 patients | |||||
| 2012 | 194.1 | 181.7 | 179.4 | 197.3 | 222.2 |
| 2018 | 165.3 | 185.4 | 160.4 | 160.4 | 156.2 |
| change per quarter | −1.24 (−1.89 to −0.60) | 0.22 (−0.42 to 0.86) | −0.82 (−1.42 to −0.22) | −1.55 (−2.20 to −0.90) | −2.95 (−3.66 to −2.24) |
| percentage change over entire period | −14.8 | 2.0 | −10.6 | −18.7 | −29.7 |
Six practices missing deprivation data.
Hospitalization
The rate of admissions with any infection increased by 8.5% overall from 306.9 admissions per 100 000 registered patients in Q1 2012 to 332.9 in Q1 2018, similar to changes in emergency admissions in Scotland for any cause.21
Statistically significant increases in rate of admissions with any infection were observed in all four quartiles of practices (defined by change in antibiotic prescription), with larger increases in quartile one [no change in antibiotic prescription, hospital admissions increased by 3.68 (95% CI 2.64 to 4.73) admissions/100 000 per quarter] than in quartiles with reducing antibiotic prescription [for quartile four, admissions increased by 2.18 (95% CI 1.18 to 3.19) admissions/100 000 per quarter]. The differences in rate of change in admissions between quartile one and quartiles two and three were not statistically significant, but the difference in rates between quartiles one and four was significant [difference −1.50 (95% CI −2.91 to −0.10) admissions/100 000 per quarter; Table 2 and Figure 1].
Hospital admissions with infection (all admissions and common specific infections)
| Practices grouped in quartiles of change in antibiotic prescribing 2012–18 | Admissions per 100 000 patients in Q1 2012 | Admissions per 100 000 patients in Q1 2018 | Change (95% CI) in rate per quarter 2012–18 | Change in rate per quarter (95% CI) compared with quartile one |
|---|---|---|---|---|
| All hospitalizationsa | ||||
| quartile 1 (no change) | 337.8 | 410.1 | 3.68 (2.64 to 4.73) | REF |
| quartile 2 | 312.3 | 360.0 | 2.38 (1.46 to 3.31) | −1.30 (−2.70 to 0.11) |
| quartile 3 | 320.1 | 394.1 | 2.34 (1.18 to 3.49) | −1.35 (−2.75 to 0.06) |
| quartile 4 (largest fall) | 342.7 | 401.5 | 2.18 (1.18 to 3.19) | −1.50 (−2.91 to −0.10) |
| Bacterial pneumonia | ||||
| quartile 1 (no change) | 88.5 | 88.5 | 1.16 (0.39 to 1.94) | REF |
| quartile 2 | 86.2 | 86.2 | 0.95 (0.33 to 1.57) | −0.21 (−1.20 to 0.78) |
| quartile 3 | 89.4 | 89.4 | 0.98 (0.22 to 1.74) | −0.18 (−1.17 to 0.81) |
| quartile 4 (largest fall) | 98.8 | 98.8 | 0.67 (-0.09 to 1.42) | −0.50 (−1.49 to 0.49) |
| Cellulitis | ||||
| quartile 1 (no change) | 45.3 | 46.0 | 0.30 (0.03 to 0.64) | REF |
| quartile 2 | 44.7 | 45.5 | 0.30 (0.04 to 0.57) | −0.003 (−0.41 to 0.40) |
| quartile 3 | 41.4 | 46.1 | 0.32 (0.05 to 0.59) | 0.01 (−0.40 to 0.42) |
| quartile 4 (largest fall) | 38.9 | 46.7 | 0.45 (0.13 to 0.77) | 0.15 (−0.26 to 0.56) |
| COPD | ||||
| quartile 1 (no change) | 99.6 | 106.4 | 0.51 (−0.08 to 1.10) | REF |
| quartile 2 | 86.3 | 86.2 | 0.24 (−0.27 to 0.76) | −0.27 (−1.04 to 0.51) |
| quartile 3 | 87.8 | 91.7 | 0.05 (−0.51 to 0.61) | −0.46 (−1.23 to 0.32) |
| quartile 4 (largest fall) | 97.5 | 105.0 | 0.23 (−0.38 to 0.84) | −0.28 (−1.06 to 0.49) |
All hospitalizations includes: (i) bacterial pneumonia, cellulitis and COPD – these have also been analysed individually; (ii) sepsis and urinary infections – these have not been analysed individually due to non-linearity; and (iii) mastoiditis and peri-tonsillar infections – these have not been analysed individually as numbers are very small (Figure S1 and Table S2).
Initial examination of the data showed that trends in sepsis and urinary tract infections were not linear, with increases in sepsis admissions in the latter half of 2017 and reductions in urinary tract infections (likely due to changes in coding).11 The rates of admissions with mastoiditis and peritonsillar abscess were very low, even combined (Figure S1 and Table S2). The rates of change in these infections, and associations with changes in prescriptions per quartile, were therefore not analysed individually although they were included in the analysis of any infection admission.
For bacterial pneumonia admissions, the overall rate increased by 28.1% from 90.4 admissions per 100 000 registered patients in Q1 2012 to 115.8 in Q1 2018. For cellulitis admissions, the overall rate increased by 11.3% from 41.4 admissions per 100 000 registered patients in Q1 2012 to 46.0 in Q1 2018. For admissions with exacerbations of COPD, the overall rate increased by 4.6% from 92.3 admissions per 100 000 registered patients in Q1 2012 to 96.5 in Q1 2018. For admissions with bacterial pneumonia and exacerbations of COPD, increases over time were smaller in quartiles with larger reductions in antibiotic prescriptions, whereas for cellulitis the reverse pattern was seen. However, there were no statistically significant associations between prescription quartile and admissions with individual infections (Table 2).
Patient satisfaction
Eight hundred and fifty-five practices were included in the patient satisfaction analysis (9 practices in the above analysis had missing data for patient satisfaction in 2017–18, while a further 12 were missing data for adjustment). Median patient satisfaction per practice fell during the study period from 91.4% (IQR 86.25% to 95.1%) in the 2011–12 survey to 85.7% (IQR 81.6% to 89.3%) in the 2017–18 survey. In univariate analysis, patient satisfaction in 2017–18 was higher in practices where satisfaction was higher at baseline [an increase of 0.3 (95% CI 0.2 to 0.3) percentage points in 2017–18 for every percentage point higher in 2011–12], in rural practices compared with urban practices [3.2 (95% CI 2.2 to 4.2) percentage points higher], in practices with more older patients [0.2 (95% CI 0.1 to 0.3) percentage points higher for every 1% increase in the percentage of patients aged ≥65 years] and in more affluent practices [3.8 (95% CI 2.5 to 5.0) percentage points higher in practices in the most affluent quintile of deprivation compared with the least affluent quintile]. There was no association with practice-level rate of change in antibiotic prescriptions (Table 3).
Associations between practice characteristics and patient overall satisfaction with the practice in 2017–18
| Practice characteristics (units for continuous measures) | Percentage point difference (95% CI) in patient satisfaction with overall care in 2017–18 | |
|---|---|---|
| univariate | adjusted | |
| Antibiotic prescriptions per 1000 patients per quarter (unit decrease) | 0.04 (−0.2 to 0.3) | 0.04 (−0.2 to 0.3) |
| Baseline satisfaction in 2011–12 (percentage point increase) | 0.3 (0.2 to 0.3) | 0.2 (0.1 to 0.3) |
| List size (1000 increase in list size) | −0.3 (−0.4 to −0.2) | −0.1 (−0.2 to 0.03) |
| Percentage of patients <5 years old (percentage point increase) | −0.5 (−0.8 to −0.1) | 0.3 (−0.01 to 0.7) |
| Percentage of patients ≥65 years old (percentage point increase) | 0.2 (0.1 to 0.3) | 0.1 (0.03 to 0.2) |
| Deprivation quintile | ||
| 1 (most deprived) | REF | REF |
| 2 | 0.6 (−0.6 to 1.9) | 0.4 (−0.9 to 1.6) |
| 3 | 1.4 (0.2 to 2.6) | 0.5 (−0.8 to 1.7) |
| 4 | 3.4 (2.2 to 4.6) | 2.1 (0.8 to 3.4) |
| 5 (most affluent) | 3.8 (2.5 to 5.0) | 2.5 (1.1 to 3.8) |
| Location (urban–rural classification) | ||
| urban area | REF | REF |
| small town | 1.0 (−0.1 to 2.2) | 0.1 (−1.1 to 1.3) |
| rural area | 3.2 (2.2 to 4.2) | 0.5 (−0.8 to 1.8) |
In adjusted analysis, baseline satisfaction, the percentage of older patients and affluence remained significantly associated with satisfaction in 2017–18 (Table 3). The rate of change of antibiotic prescriptions was not associated with satisfaction in 2017–18 after adjustment for other factors [0.04 (95% CI −0.22 to 0.29) percentage points higher per unit decrease in antibiotic prescriptions/1000/quarter].
Discussion
Principal findings
In this population-based study we found that antibiotic prescriptions in Scottish primary care fell by 14.8% between 2012 and 2018, but with marked variation between practices. In the four quartiles of change in prescriptions, rates rose slightly in quartile one (a statistically non-significant increase of 2.0%), but fell substantially and statistically significantly by 10.6% in quartile two, 18.7% in quartile three and 29.7% in quartile four (Figure 1). Although quartile one had a higher baseline prescription rate than quartile four, the endpoint of quartile four was still 29.2 prescriptions per thousand patients per quarter lower than quartile one (Table 1 and Figure 1). Although hospitalization with included infection diagnoses increased over the time period (Figure 1), this analysis found no evidence of increased rates of hospitalization in practices with larger decreases in antibiotic prescriptions compared with those with no change (and there was some evidence of smaller increases in hospitalization in practices with the largest reductions in prescriptions compared with practices with no change). Patient satisfaction fell over the period examined, but practice satisfaction in 2017–18 was not associated with changes in antibiotic prescriptions between 2012 and 2018.
Strengths and limitations
The key strength of this study was the use of routinely collected population data for an entire country. The use of antibiotic dispensing, rather than prescribing, is also a strength given the outcome of hospitalization. The universal use of the unique patient Community Health Index (CHI) number across primary and secondary care in the Scottish NHS enabled accurate linkage of hospital admissions to patients’ registered practices. Aggregation of patient data by practice, and by prescription quartile for hospitalizations, was done within NHS National Services Scotland with aggregate anonymized data provided for the analysis. A further strength is the longitudinal design with data that were consistently collected over a 6 year study period during which there were substantial reductions in antibiotic prescriptions and large variation between practices, which provides stronger evidence of the validity of the observed associations compared with cross-sectional analysis.
A potential limitation of this study is that data on the indication for antibiotic prescriptions were not available. However, indication is not reliably or consistently recorded, with one English primary care study reporting that 38.8% of antibiotics prescribed were not coded with a specific clinical condition and a further 15.3% of infections were not associated with any codes at all.22 The 8.5% increase in hospital admissions with infection over the study period is very similar to the increase in all emergency hospital admissions in Scotland (an 8.3% increase from 2012–13 to 2018–19),21 likely reflecting the ageing population and shorter hospital admissions (resulting in an increased number of readmissions for some comorbid and/or frail patients). However, coding of specific infections in hospital discharge data is subject to secular change, which makes such analyses more difficult. In this analysis, there was an increase in sepsis ICD-10 coding in 2017 following updated sepsis guidelines,23,24 and implementation of the Scottish Patient Safety Programme Sepsis Collaborative,25 and it is possible that admissions previously coded as urinary infection were subsequently coded as sepsis. Similar changes in coded data have been observed in an English study also looking at hospital admissions over time.11 A limitation of the patient satisfaction data is that a random sample of all patients are invited to complete the survey rather than those prescribed or requesting antibiotics,17 so the patients answering the survey positively may not be the same patients as those who have visited their GP expecting antibiotics. The NHS Scotland Health and Care Experience Survey is also conducted bi-annually, while the antibiotic prescription data are available quarterly. However, these survey data are the best available national data. Finally, as with all observational studies, residual confounding cannot be excluded and conclusions about causation must be cautious. We were not able to adjust the associations between prescription quartile and hospital admissions for any other factors, such as the age and socioeconomic distribution of the practice populations within each quartile, but these were similar across the quartiles (Table 1). In the satisfaction analysis, which was adjusted at the practice level, there was no observed association with change in antibiotic prescriptions.
Comparison with other literature
This study found no evidence of an association between larger decreases in antibiotic use and higher rates of hospital admissions with infection. This is contrary to the findings of Gulliford et al.10 (2016) who found that lower prescribing of antibiotics in primary care consultations coded as being for respiratory tract infections was associated with a higher incidence of admissions with pneumonia and peritonsillar abscess. However, observed absolute differences were very small, with a 10% reduction in antibiotic prescriptions for respiratory tract infections estimated to lead to one additional hospital admission with pneumonia annually and one additional admission with peritonsillar abscess in 10 years per practice.10 Consistent with this study, a recent UK trial showed that a primary care stewardship intervention led to modest reductions in antibiotic prescribing with no evidence of increased serious bacterial complications.26 Similarly, a Swedish study found no associations between decreasing antibiotic prescribing for respiratory tract infections and rates of infection, such as mastoiditis, peritonsillar abscess and orbital abscess,27 and an English study of the effects of a national antimicrobial stewardship programme found no evidence of an association between changes in antimicrobial prescribing and overall hospital admission rates.11
This analysis also found that even a large decrease in antibiotic prescriptions over time was not significantly associated with changes in patient satisfaction. This result is contrary to a previous cross-sectional study, which found lower antibiotic prescribing to be associated with lower satisfaction,12 but this longitudinal analysis with adjustment for baseline satisfaction provides stronger evidence of a lack of causal association.
Implications for practice
With a few exceptions,11 antimicrobial stewardship interventions seeking to reduce primary care antibiotic prescribing in the UK have not been accompanied by evaluation of unintended consequences. Balanced evaluation of impact of stewardship is important9 and this study provides reassurance that practices can considerably reduce antibiotic prescriptions without risking increases in hospital admissions with infection.11,27 Similarly, patient expectations are known to be a significant predictor of patient satisfaction in primary care.28 Prescribers have reported patient expectations of an antibiotic prescription as a barrier to reducing prescribing,29,30 although there is evidence that doctors commonly overestimate patients’ expectations of prescribing.31 Although not prescribing may require careful explanation to avoid short-term dissatisfaction, this study provides some reassurance that there is no broader change in satisfaction, and delayed prescribing remains an option where individual patients are initially unconvinced.32
Implications for research
More research is needed to examine whether varying sizes of reduction in antibiotic prescribing are associated with changes in antimicrobial resistance, as has been shown for reductions in broad-spectrum antibiotics in Scotland.8 Antimicrobial stewardship is intended to ensure appropriate use of antibiotics, rather than less use (although in the context of widespread overuse, stewardship will lead to less use overall). As prescribing falls, then future research will need to examine appropriate use in more detail to ensure rapid prescription of the right antibiotic for those who need them and avoidance of antibiotics in those who do not. Collecting the data required for such analysis is challenging, but the continued growth of high-quality linked datasets makes this increasingly feasible. Finally, this research was carried out prior to the COVID-19 pandemic. While it would be interesting to see what happened to the associations we observed during the pandemic, there would be extensive confounding due to necessary changes in access to primary and secondary care that are outside the control of general practices.
Conclusions
Large reductions in antibiotic prescriptions in general practice in Scotland have not been associated with increases in hospitalization with infection or changes in patient satisfaction.
Acknowledgements
We acknowledge the Scottish Antimicrobial Prescribing Group (SAPG) and NHS National Services Scotland for providing the data and approval for the analysis.
Funding
I.G. was funded by a summer studentship from Medical Research Scotland (Vac-1431-2019). Other authors contributed as part of routine work, including the SAPG work programme, which is funded by the Scottish Government.
Transparency declarations
None to declare.
Supplementary data
Tables S1 and S2 and Figure S1 are available as Supplementary data at JAC Online.
